UNIVERSITÉ DE MONTRÉAL
TOWARDS ACCURATE FORECASTING OF EPILEPTIC SEIZURES: ARTIFICIAL INTELLIGENCE AND EFFECTIVE CONNECTIVITY FINDINGS
ELIE BOU ASSI
INSTITUT DE GÉNIE BIOMÉDICAL ÉCOLE POLYTECHNIQUE DE MONTRÉAL
THÈSE PRÉSENTÉE EN VUE DE L’OBTENTION DU DIPLÔME DE PHILOSOPHIAE DOCTOR
(GÉNIE BIOMÉDICAL) AOÛT 2018
UNIVERSITÉ DE MONTRÉAL
ÉCOLE POLYTECHNIQUE DE MONTRÉAL
Cette thèse intitulée:
TOWARDS ACCURATE FORECASTING OF EPILEPTIC SEIZURES: ARTIFICIAL INTELLIGENCE AND EFFECTIVE CONNECTIVITY FINDINGS
présentée par : BOU ASSI Elie
en vue de l’obtention du diplôme de : Philosophiae Doctor a été dûment acceptée par le jury d’examen constitué de :
M. DAVID Jean Pierre, Ph. D., président
M. SAWAN Mohamad, Ph. D., membre et directeur de recherche M. NGUYEN Dang Khoa, Ph. D., membre et codirecteur de recherche Mme RIHANA Sandy, Ph. D., membre et codirectrice de recherche M. LESAGE Frédéric, Ph. D., membre
DEDICATION
To my beloved parents, Gladys and Georges, Who always picked me up on time and encouraged me to go on every adventure, Especially this one…
ACKNOWLEDGEMENTS
First and foremost, I would like to express my sincere gratitude to my advisors Prof. Mohamad Sawan, Dr. Dang K. Nguyen, and Dr. Sandy Rihana for the continuous support throughout my Ph. D. and related research. Many thanks for your patience, motivation, and immense knowledge. Your guidance helped me in all the time of research until the writing of this thesis. I could not have imagined having better advisors for my Ph. D. journey. Since the begin, you were not only research supervisors but also life mentors who have influenced a lot of decisions shaping my future career.
Beside my advisors, I would like to thank Prof. Frédéric Lesage and Dr. Philippe Pouliot who instructed me through several meetings as I was their own student. Prof. Lesage’s comments and advices, especially during my comprehensive exam, were of great contribution to the work reported in this thesis.
My sincere thanks also go to the jury members namely Prof. Jean-Pierre David, Prof. Frederic Lesage, Prof. Jean-Marc Lina and Prof. Steven Dufour for their time beside their busy schedules. I am grateful to my family who have provided me through moral and emotional support in my life. I am also grateful to my friends who have supported me along the way.
I gratefully acknowledge the funding received towards my PhD from the Natural Sciences and Engineering Research Council of Canada and Epilepsy Canada. I am also grateful to the Agence Universitaire de la Francophonie (AUF) and the Electrical Engineering Department of Polytechnique Montreal for the Excellence Doctoral Mobility and the Excellence Scholarship for Graduate Students respectively.
I would also like to thank my fellow lab mates and staff at the CHUM Epilepsy research group namely Dr. Denahin Toffa, Dr. Laurence Martineau, Daphné Perla Citherlet, Jimmy Ghaziri, Ali Kassab, Younes Zerouali, Veronique Cloutier, and Manon Robert, for our stimulating discussions, and for all the fun we had in the last four years.
And finally, last but by no means least, also to everyone in the Polystim Neurotech Laboratory, especially Laura Gagliano, Antoine Tantin, Abbas Hamoud, Leila Montazeri, Armin Najarpour, and Marie-Yannick Laplante. It was great sharing the laboratory with all of you during last four years.
RÉSUMÉ
L’épilepsie est une des maladies neurologiques les plus fréquentes, touchant près d’un pourcent de la population mondiale. De nos jours, bien qu’environ deux tiers des patients épileptiques répondent adéquatement aux traitements pharmacologiques, il reste qu’un tiers des patients doivent vivre avec des crises invalidantes et imprévisibles. Quoique la chirurgie d’épilepsie puisse être une autre option thérapeutique envisageable, le recours à la chirurgie de résection demeure très faible en partie pour des raisons diverses (taux de réussite modeste, peur des complications, perceptions négatives). D’autres avenues de traitement sont donc souhaitables. Une piste actuellement explorée par des groupes de chercheurs est de tenter de prédire les crises à partir d’enregistrements de l’activité cérébrale des patients. La capacité de prédire la survenue de crises permettrait notamment aux patients, aidants naturels ou personnels médical de prendre des mesures de précaution pour éviter les désagréments reliés aux crises voire même instaurer un traitement pour les faire avorter. Au cours des dernières années, d’importants efforts ont été déployés pour développer des algorithmes de prédiction de crises et d’en améliorer les performances.
Toutefois, le manque d’enregistrements électroencéphalographiques intracrâniens (iEEG) de longue durée de qualité, la quantité limitée de crises, ainsi que la courte durée des périodes interictales constituaient des obstacles majeurs à une évaluation adéquate de la performance des algorithmes de prédiction de crises. Récemment, la disponibilité en ligne d’enregistrements iEEG continus avec échantillonnage bilatéral (des deux hémisphères) acquis chez des chiens atteints d’épilepsie focale à l’aide du dispositif de surveillance ambulatoire implantable NeuroVista a partiellement facilité cette tâche. Cependant, une des limitations associées à l’utilisation de ces données durant la conception d’un algorithme de prédiction de crises était l’absence d’information concernant la zone exacte de début des crises (information non fournie par les gestionnaires de cette base de données en ligne). Le premier objectif de cette thèse était la mise en œuvre d’un algorithme précis de prédiction de crises basé sur des enregistrements iEEG canins de longue durée. Les principales contributions à cet égard incluent une localisation quantitative de la zone d’apparition des crises (basée sur la fonction de transfert orientée –DTF), l’utilisation d’une nouvelle fonction de coût via l’algorithme génétique proposé, ainsi qu’une évaluation quasi-prospective des performances de prédiction. Les résultats ont montré une amélioration des
performances de prédiction par rapport aux études antérieures, atteignant une sensibilité moyenne de 84.82 % et un temps en avertissement de 10 %.
La DTF, utilisée précédemment comme mesure de connectivité pour déterminer le réseau épileptique (objectif 1), a été préalablement validée pour quantifier les relations causales entre les canaux lorsque les exigences de quasi-stationnarité sont satisfaites. Ceci est possible dans le cas des enregistrements canins en raison du nombre relativement faible de canaux. Pour faire face aux exigences de non-stationnarité, la fonction de transfert adaptatif pondérée par le spectre (Spectrum weighted adaptive directed transfer function - swADTF) a été introduit en tant qu’une version variant dans le temps de la DTF. Le second objectif de cette thèse était de valider la possibilité d’identifier les endroits émetteurs (ou sources) et récepteurs d’activité épileptiques en appliquant la swADTF sur des enregistrements iEEG de haute densité provenant de patients admis pour évaluation pré-chirurgicale au CHUM. Les générateurs d’activité épileptique étaient dans le volume réséqué pour les patients ayant des bons résultats post-chirurgicaux alors que des foyers différents ont été identifiés chez les patients ayant eu de mauvais résultats post-chirurgicaux. Ces résultats démontrent la possibilité d’une identification précise des sources et récepteurs d’activités épileptiques au moyen de la swADTF ouvrant la porte à la possibilité d’une meilleure sélection d’électrodes de manière quantitative dans un contexte de développement d’algorithme de prédiction de crises chez l’humain.
Dans le but d’explorer de nouvelles avenues pour la prédiction de crises épileptiques, un nouveau précurseur a aussi été étudié combinant l’analyse des spectres d’ordre supérieur et les réseaux de neurones artificiels (objectif 3). Les résultats ont montré des différences statistiquement significatives (p<0.05) entre l’état préictal et l’état interictal en utilisant chacune des caractéristiques extraites du bi-spectre. Utilisées comme entrées à un perceptron multicouche, l’entropie bispectrale normalisée, l’entropie carrée normalisée, et la moyenne ont atteint des précisions respectives de 78.11 %, 72.64% et 73.26%.
Les résultats de cette thèse confirment la faisabilité de prédiction de crises à partir d’enregistrements d’électroencéphalographie intracrâniens. Cependant, des efforts supplémentaires en termes de sélection d’électrodes, d’extraction de caractéristiques, d’utilisation des techniques d’apprentissage profond et d’implémentation Hardware, sont nécessaires avant l’intégration de ces approches dans les dispositifs implantables commerciaux.
ABSTRACT
Epilepsy is a chronic condition characterized by recurrent “unpredictable” seizures. While the first line of treatment consists of long-term drug therapy about one-third of patients are said to be pharmacoresistant. In addition, recourse to epilepsy surgery remains low in part due to persisting negative attitudes towards resective surgery, fear of complications and only moderate success rates. An important direction of research is to investigate the possibility of predicting seizures which, if achieved, can lead to novel interventional avenues.
The paucity of intracranial electroencephalography (iEEG) recordings, the limited number of ictal events, and the short duration of interictal periods have been important obstacles for an adequate assessment of seizure forecasting. More recently, long-term continuous bilateral iEEG recordings acquired from dogs with naturally occurring focal epilepsy, using the implantable NeuroVista ambulatory monitoring device have been made available on line for the benefit of researchers. Still, an important limitation of these recordings for seizure-prediction studies was that the seizure onset zone was not disclosed/available. The first objective of this thesis was to develop an accurate seizure forecasting algorithm based on these canine ambulatory iEEG recordings. Main contributions include a quantitative, directed transfer function (DTF)-based, localization of the seizure onset zone (electrode selection), a new fitness function for the proposed genetic algorithm (feature selection), and a quasi-prospective assessment of seizure forecasting on long-term continuous iEEG recordings. Results showed performance improvement compared to previous studies, achieving an average sensitivity of 84.82% and a time in warning of 10 %.
The DTF has been previously validated for quantifying causal relations when quasi-stationarity requirements are met. Although such requirements can be fulfilled in the case of canine recordings due to the relatively low number of channels (objective 1), the identification of stationary segments would be more challenging in the case of high density iEEG recordings. To cope with non-stationarity issues, the spectrum weighted adaptive directed transfer function (swADTF) was recently introduced as a time-varying version of the DTF. The second objective of this thesis was to validate the feasibility of identifying sources and sinks of seizure activity based on the swADTF using high-density iEEG recordings of patients admitted for pre-surgical
monitoring at the CHUM. Generators of seizure activity were within the resected volume for patients with good post-surgical outcomes, whereas different or additional seizure foci were identified in patients with poor post-surgical outcomes. Results confirmed the possibility of accurate identification of seizure origin and propagation by means of swADTF paving the way for its use in seizure prediction algorithms by allowing a more tailored electrode selection.
Finally, in an attempt to explore new avenues for seizure forecasting, we proposed a new precursor of seizure activity by combining higher order spectral analysis and artificial neural networks (objective 3). Results showed statistically significant differences (p<0.05) between preictal and interictal states using all the bispectrum-extracted features. Normalized bispectral entropy, normalized squared entropy and mean of magnitude, when employed as inputs to a multi-layer perceptron classifier, achieved held-out test accuracies of 78.11%, 72.64%, and 73.26%, respectively.
Results of this thesis confirm the feasibility of seizure forecasting based on iEEG recordings; the transition into the ictal state is not random and consists of a “build-up”, leading to seizures. However, additional efforts in terms of electrode selection, feature extraction, hardware and deep learning implementation, are required before the translation of current approaches into commercial devices.
TABLE OF CONTENTS DEDICATION ... iii ACKNOWLEDGEMENTS ... iv RÉSUMÉ ... v ABSTRACT... vii TABLE OF CONTENTS………ix
LIST OF TABLES ... xiii
LIST OF FIGURES ... xiv
LIST OF SYMBOLS AND ABBREVIATIONS ... xvii
LIST OF APPENDICES ... xx
CHAPTER 1 INTRODUCTION ... 1
1.1 Epilepsy ... 1
1.1.1 General definition, prevalence, incidence, and etiology ... 1
1.1.2 Epileptic seizures ... 1
1.1.3 Electroencephalography ... 2
1.1.4 The EEG in focal epilepsy ... 5
1.1.5 Treatment of epilepsy ... 7
1.2 Problem statement... 9
1.2.1 Seizure detection ... 9
1.2.2 Seizure prediction ... 11
1.3 Objectives, hypotheses, and research work overview ... 13
CHAPTER 2 LITERATURE REVIEW ... 17
2.1 State-of-the-art ... 17
2.1.1 Basic conventions in seizure prediction studies ... 17
2.1.2 Different approaches to seizure prediction ... 18
2.1.3 Algorithmic-based studies ... 18
2.2 Discussion ... 37
CHAPTER 3 THEORY AND METHODOLOGY ... 39
3.1 EEG signal processing and classification ... 39
3.1.1 Feature extraction... 39
3.1.2 Feature selection: genetic algorithm ... 43
3.1.3 Classification ... 44
3.1.4 Regularization function ... 46
3.2.1 Directed Transfer Function... 46
3.2.2 Spectrum weighted adaptive directed transfer function ... 48
3.2.3 Outflow and inflow of seizure activity... 49
3.2.4 Statistical validation of causal relations: surrogate data testing ... 49
CHAPTER 4 ARTICLE 1 A FUNCTIONAL-GENETIC SCHEME FOR SEIZURE FORECASTING IN CANINE EPILEPSY ... 50
4.1 Abstract ... 50
4.2 Introduction ... 51
4.3 Materials and methods ... 53
4.3.1 Database ... 53
4.3.2 Kmeans-DTF: SOZ extent ... 54
4.3.3 Seizure-prediction algorithm ... 57
4.3.4 Data splitting... 61
4.3.5 Performance evaluation ... 62
4.4 Results ... 62
4.4.1 Kmeans-DTF: SOZ extent ... 63
4.4.2 Seizure-prediction algorithm ... 66
4.5 Discussion ... 69
4.6 Conclusion ... 71
4.7 Acknowledgments ... 72
4.8 References ... 72
CHAPTER 5 ARTICLE 2 EFFECTIVE CONNECTIVITY ANALYSIS OF OPERCULO-INSULAR SEIZURES ... 75
5.1 Abstract ... 75
5.2 Introduction ... 76
5.3 Materials and Methods ... 78
5.3.1 Patients ... 78
5.3.2 Spectrum weighted adaptive directed transfer function ... 79
5.3.3 Surrogate data testing ... 81
5.3.4 Outflow and inflow of seizure activity... 81
5.3.5 Synthetic iEEG recordings ... 83
5.4 Results ... 83
5.4.1 Simulation results... 83
5.4.2 Sources of seizure activity – group results ... 85
5.5 Discussion ... 90
5.6 Conclusion ... 92
5.7 Acknowledgements ... 92
5.8 References ... 92
CHAPTER 6 ARTICLE 3 LEVERAGING HIGHER ORDER SPECTRA AND ARTIFICIAL NEURAL NETWORKS: TOWARDS NEW PRECURSORS OF SEIZURE ACTIVITY ... 95
6.1 Abstract ... 95
6.2 Introduction ... 96
6.3 Methods ... 97
6.3.1 Database ... 97
6.3.2 Higher order spectra ... 98
6.3.3 Higher order spectra features ... 98
6.3.4 Statistical analysis ... 100
6.3.5 Seizure prediction algorithm ... 101
6.4 Results ... 103
6.4.1 Statistical Analysis ... 103
6.4.2 Seizure prediction algorithm ... 106
6.5 Discussion ... 106
6.6 Conclusion ... 108
6.7 Acknowledgements ... 109
6.8 References ... 109
CHAPTER 7 GENERAL DISCUSSION ... 112
7.1 Summary of contributions ... 112
7.2 Adequate assessment of seizure forecasting ... 114
7.3 Bilateral recordings for seizure prediction ... 115
7.4 Electrode selection based on raw recordings ... 115
7.5 Performance comparison ... 116
7.6 Ambulatory iEEG recordings ... 117
7.8 Limitation of iEEG recordings ... 118
CHAPTER 8 CONCLUSION AND RECOMMENDATIONS ... 119
BIBLIOGRAPHY ... 123
LIST OF TABLES
Table 2.1 Recent studies comparing scalp and iEEG performances ... 20
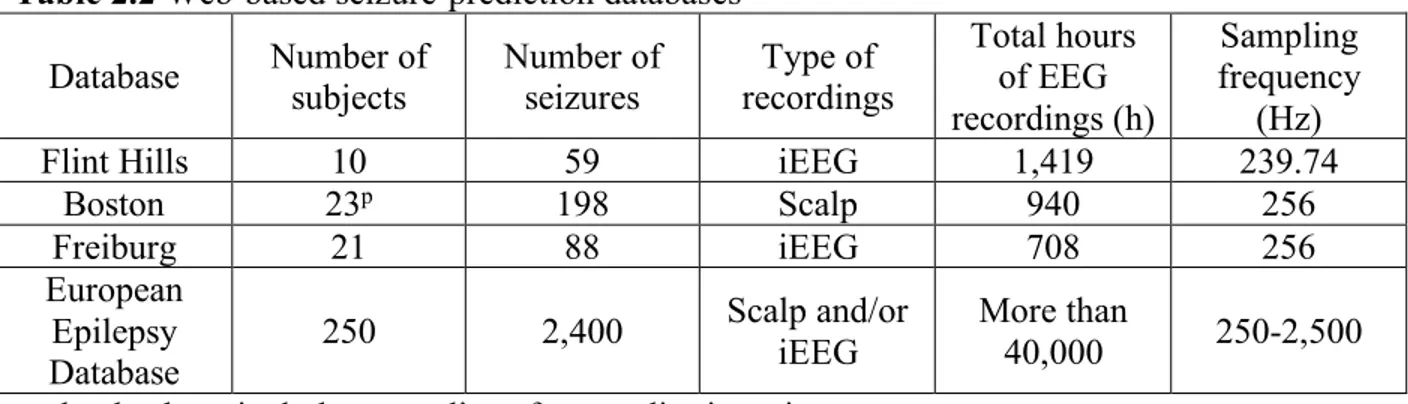
Table 2.2 Web-based seizure-prediction databases ... 21
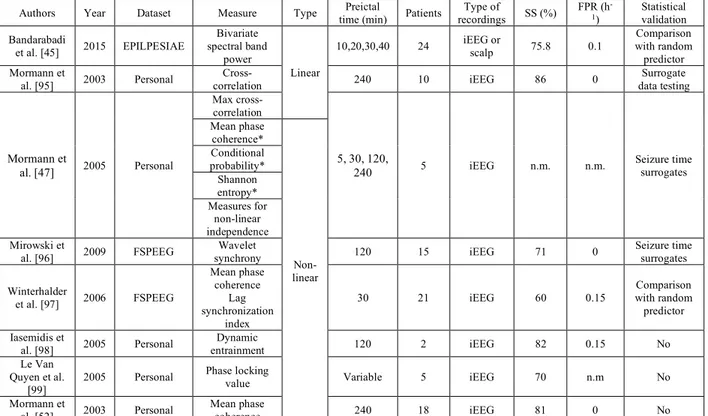
Table 2.3 Prominent univariate features used in algorithmic seizure prediction studies ... 27
Table 2.4 Prominent bivariate features used in algorithmic seizure prediction studies ... 29
Table 2.5 Prominent feature selection and classification methods used in algorithmic seizure prediction studies ... 31
Table 4.1 Data splitting into train, validation, and test ... 59
Table 4.2 Functional connectivity results averaged across 3 seizures per dog ... 62
Table 4.3 Seizure-forecasting results ... 67
Table 4.4 Comparison with previous work ... 68
Table 5.1 Clinical caracteristics of patients ... 77
Table 5.2 Group results in terms of resected regions, sources, and sinks of seizure activity... 84
Table 6.1 Mean values of HOS features and One-Way ANOVA global statistical analysis results ... 101
LIST OF FIGURES
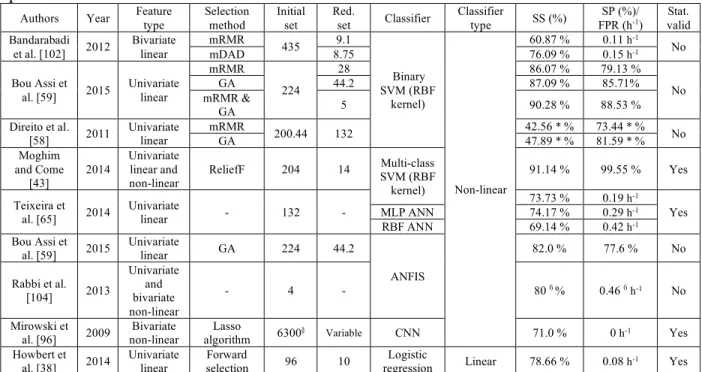
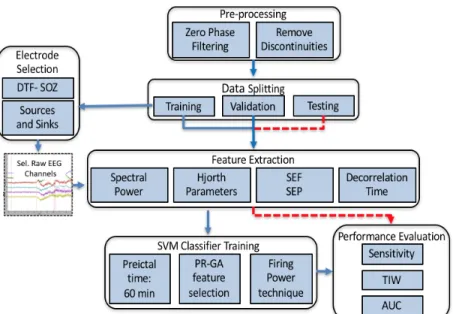
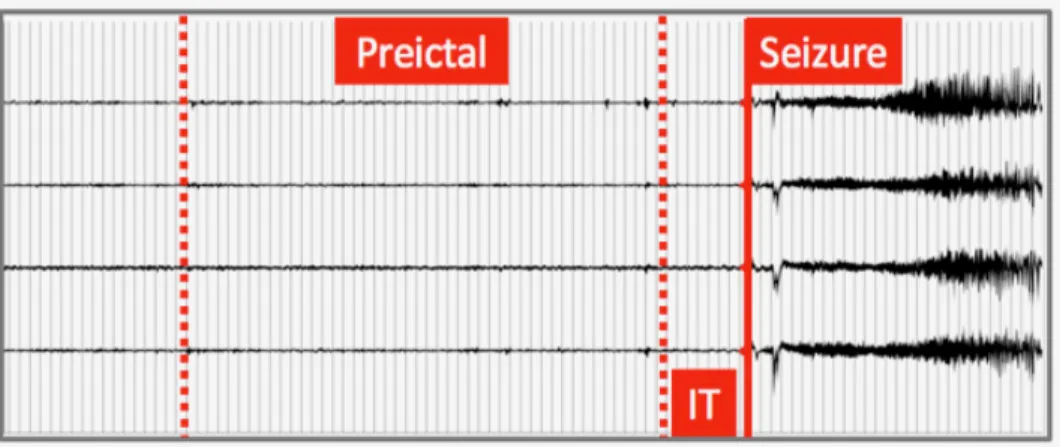
Figure 1.1 Scalp EEG electrode placement according to the 10-10 international electrode placement system [19] ... 4 Figure 1.2 Intracranial electroencephalography. A: Intracranial study combining grid and strip electrodes as well as depth electrodes; B: Depth electrodes and grid electrodes; C: Skin flap sutured back with recorded wires tunnelling out; D: 3-D Representation of a subdural grid electrodes, strip electrodes and depth electrodes; E: Raw iEEG recordings from 5 electrode contacts. ... 5 Figure 1.3 NeuroVista ambulatory monitoring device’s implantation in dogs with naturally occurring focal epilepsy [38]. ... 10 Figure 1.4 Five-channels iEEG illustrating typical epileptic brain states; IT: intervention time .. 11 Figure 2.1Typical block diagram of algorithmic-based studies ... 19 Figure 3.1Support vector machine optimal linear hyperplane ... 44 Figure 3.2 Multi-layer perceptron network architecture ... 45 Figure 4.1 Framework of proposed seizure-prediction algorithm; The first cluster in each dog was used for training and validation (seizure used for training were not included in validation or testing); All remaining clusters were completely held out during algorithm development and were used for testing. DTF-SOZ: direct transfer function-seizure onset zone; SEF: spectral edge frequency; SEP: spectral edge power; PR-GA: precision recall-genetic algorithm; TIW: time in warning; AUC: area under the curve. ... 52 Figure 4.2 Approximate positioning of iEEG electrodes. The 3D canine brain mesh was generated by segmentation and reconstruction of magnetic resonance imaging canine brain scans on Matlab. ... 53 Figure 4.3 Four-channel iEEG recording showing preictal time and IT ... 54 Figure 4.4 Flowchart of proposed PR-based genetic algorithm. SVM: support vector machine; PR_AUC: precision recall-area under the curve; CL: chromosome length; #SF: number of selected features ... 58 Figure 4.5 Time frequency-energy distribution of seizure onset patterns in each dog ... 61 Figure 4.6 Averaged DTFs of all dogs. Electrodes 2, 3 and 4 were identified as sources of seizure activity in dog A0002, 11 in dog A0003, and 13 in dog A0004. ... 64
Figure 4.7 Strength of causal interactions in dogs A0003 and A0004. The results highlight inter-hemispheric seizure flow during seizure initiation, even in dogs with focal epilepsy ... 65 Figure 4.8 Alarms generation based on the Firing power technique. Area highlighted in yellow and red respectively depict a 30 min preictal time and 5 min IT. Blue and black lines represent the firing power output and probabilistic support vector machine output respectively. The vertical red line and arrow respectively indicates seizure onset and generated alarm. Any alarm generated during the preictal period (highlighted in yellow) is considered as true ... 68 Figure 4.9 Selected features distribution ... 70 Figure 5.1 Framework of the swADTF-based connectivity implementation (iEEG: intracranial electroencephalography; MVAAR: multivariate adaptive autoregressive model; swADTF: spectrum weighted adaptive directed transfer function) ... 78 Figure 5.2 Graphical node illustration of the simulated propagation pattern. Node 5 was simulated as a generator of seizure activity that propagates to all remaining nodes (sinks). 79 Figure 5.3 Illustrative one-channel raw iEEG recordings with different SNRs. top: SNR = 12 dB; middle: SNR = 0 dB; bottom: SNR= -12 dB. A Gaussian white noise was added with SNRs ranging from -12 dB to 12 dB to assess the proposed framework’s robustness to noise; SNR: Signal to noise ratio. ... 80 Figure 5.4 Simulation results: swADTF transfer matrix (left), outflow (right, top) and inflow (right, bottom) of seizure activity ... 81 Figure 5.5 Noise simulation results (-12 dB ≤ SNR ≤ 11 dB): The swADTF is stable in identifying node 5 as the generator of seizure activity. Noise simulation results highlight swADTF’s resistance to noise for a SNR as low as -12 dB. ... 82 Figure 5.6 Time-Frequency energy distribution for seizures of (a) Patient 1, (b) Patient 2 , and (c) Patient 3 ... 83 Figure 5.7 Individual swADTF connectivity results for patient 1; U: insular depth electrodes, G: Grid electrodes OF: orbito-frontal strip electrode; MEG: Magnetoencephalography ... 85 Figure 5.8 Individual swADTF connectivity results for patient 4 ... 86 Figure 5.9 Seizure specific swADTF analysis for patient 4. Seizure 1 is a night seizure characterized by complex motor behavior semiology while seizure 2 is a diurnal seizure characterized by somatosensory semiology ... 87
Figure 5.10 Individual swADTF connectivity results for patient 7; SPECT: single-photon emission computed tomography ... 89 Figure 6.1 2D Bispectrum color map highlighting the non-redundant region used in feature extraction; FFT = Fast Fourier Transforms. Axes coordinates display relative/normalized frequencies where 0.5 represents the maximum frequency (180 Hz). Color indicates degree of coupling (Bispectral value) between f1 and f2. ... 99
Figure 6.2 Artificial neural network architecture. The input layer consists of 16 nodes. The first, second, and third hidden layers respectively consists of 30, 60, and 30 nodes. The output layer features 2 nodes for a binary classification. ... 100 Figure 6.3 Box and Whisker plots for all features from all three dogs. The red central mark indicates the median, the bottom and top edges of the box indicate the 25th and 75th percentiles, respectively, and the whiskers extend to the most extreme data points to a maximum of 1 times the interquartile range. Outliers are points located beyond the whiskers and are marked with a red ‘+’. The columns from left to right show plots for Mave,, P1 and
P2, while the rows correspond to the 3 dogs. All available seizures are included in these box
plots. ... 102 Figure 6.4 Mann-Whitney statistical test results: percentage of predictable seizures using each of the extracted features (p<0.05). From top to bottom: Dog 2, Dog 3, Dog 4. Each cell represents a combination of a HOS feature and a contact. Dark red color indicates that 100% of seizures showed a statistically significant change in that feature during the preictal period at that specific contact. ... 105 Figure 6.5 Distribution of P1 values during preictal (left) and interictal (right) periods. Each represents values extracted from 1h of continuous recording from Dog 2. ... 107
LIST OF SYMBOLS AND ABBREVIATIONS
3D Three dimensional
Ach Acetylcholine
ADTF Adaptive directed transfer function ANFIS Adaptive neuro fuzzy inference system
ANN Artificial neural network
ANOVA Analysis of variance
AR Autoregressive
AUC Area under the curve
BIC Bayesian Information Criterion
BIS Bispectrum
CFC Cross frequency coupling
CL Chromosome length
Cl- Chloride
Cm2 Square centimeter
CNN Cellular neural network
CNNs Convolutional neural networks
CPU Central processing unit
DTF Directed transfer function
DWT Discrete wavelets transform
ECoG Electrocorticography
EEG Electroencephalography
FDA Food and drugs administration
FIR Finite impulse response
FPR False prediction rate
GA Genetic algorithm
GABA Gamma-amino-butyric acid
GC Granger causality
HFOs High frequency oscillations
HM Hjorth mobility
HOS Higher order spectra
IBM International business machines
iDTF Integrated directed transfer function iEEG Intracranial electroencephalography
IIR Infinite impulse response
Inter Interictal
IT Intervention time
K+ Potassium
K-W Kruskal Wallis
Lmax Largest Lyapunov exponent
Mave Mean of magnitude
mDAD Maximum difference of amplitude of mean amplitude histograms
MEG Magnetoencephalography
min Minimum
MLP Multi-layer perceptron
MPC Mean phase coherence
MRI Magnetic resonance imaging
mRMR Minimum redundancy maximum relevance
MVAAR Multi variate adaptive autoregressive nDTF Normalized directed transfer function
nIV Normalized inflow
nOV Normalized outflow
P1 Normalized bispectral entropy
P2 Normalized squared bispectral entropy
PAC Phase amplitude coupling
PET Positron emission tomography
PR-AUC Precision recall area under the curve
Pre Preictal
RAM Random access memory
RBF Radial basis function
Relu Rectifier linear unit
RNS Responsive neurostimulation
ROC Receiver operating characteristic
S1 Harmonic mean of sensitivity and specificity
SEF Spectral edge frequency
SEP Spectral edge power
SF Selected features
SNR Signal to noise ratio
SOP Seizure occurrence period
SOZ Seizure onset zone
SP Specificity
SPECT Single-photon emission computed tomography
SS Sensitivity
SVM Support vector machine
swADTF Spectrum weighted adaptive directed transfer function
LIST OF APPENDICES
CHAPTER 1
INTRODUCTION
1.1 Epilepsy
1.1.1 General definition, prevalence, incidence, and etiology
Epilepsy is one of the most common neurological disorders affecting ~300,000 people in Canada and 70 million worldwide [1]. It was first defined by Jackson in 1873 as “an occasional sudden and excessive discharge of grey matter”. This definition lasted for a long period of time, during which, investigations have given more insights into the characterization and mechanisms of this medical disorder on several levels. The fundamental elements of epilepsy are unprovoked, recurrent seizures [2] resulting from abnormal excessive hypersynchronous neuronal discharges. Seizure manifestations vary greatly depending on the site, intensity and propagation of the seizure discharge. In between seizures, brief (milliseconds) asymptomatic discharges called interictal epileptiform discharges (also known as spikes) may occur [3]. Although epilepsy can appear at any age, its incidence is higher in children and elderly (after the age of 65) [4]. The main causes of epilepsy include genetic mutations, gliosis from acquired brain insults (hypoxia, ischemia/stroke, trauma, and infection), malformations of cortical development, vascular malformations, brain tumours and degenerative disorders.
1.1.2 Epileptic seizures
A seizure is defined as a transient disturbance of brain functions due to an abnormal electrical synchronization of groups of neurons. Epileptic seizures can be divided into two main categories: focal and generalized [5]. Seizures are said to be focal when they start from a restricted area of the brain (thus in one hemisphere) while generalized seizures involved the whole of both hemispheres [6]. Focal seizures can be further classified into frontal, temporal, insular, parietal, and occipital, depending on the lobe involved at seizure onset. In generalized seizures, there is impaired consciousness from the onset as the excessive electrical discharge is widespread from the beginning. With focal seizures, earliest symptoms depend on the lobe of seizure onset (ex. visual symptoms with occipital lobe seizures, sensory symptoms in parietal lobe seizures, motor symptoms in frontal lobe seizures etc.). Consciousness is frequently not impaired at the onset of a focal seizure but such impairment may occur as the discharge spreads to larger areas of the brain
and even manifest as bilateral tonic-clonic seizures if the discharge spreads to the whole brain [6].
Studies over the last few years have suggested that network connectivity is at the centre of epilepsy. A more complex ‘epileptic network’ concept has replaced the classical simplistic notion of a single epileptic focus [7]. In the ‘epileptic network’, the synchronized activity of ‘nodes’ with increased excitability (or decreased inhibition) is involved in the generation of pathological interictal epileptiform discharges as well as seizures [8, 9]. Vulnerability to seizure activity in any one part of the network is influenced by the activity elsewhere in the network, and the network as a whole is responsible for epileptic discharges and seizures. The network structures are connected functionally and structurally and the seizure activity can be entrained from any of its various parts [10]. One (or more) node(s) would have a level of excitability so high, that it (they) could autonomously generate seizure onset fast oscillations, driving or entraining through excitatory connections other distant nodes (acting as relays of those fast oscillations). Seizures can subsequently propagate in a variably extensive way that might involve any region or neural structure with anatomic connections to the primary seizure network. Seizure manifestations depend on these phenomena, which in some cases can mimic a normal cognitive process or, on the contrary, disrupt it. This ‘epileptic network’ concept may help reconcile some observations, such as the complex electrophysiological patterns seen during many focal seizures in intracranial electroencephalography (EEG) studies, often with the involvement of several distinct structures in as much that a clear qualitative (visual) identification of the area of seizure onset is difficult and the non-negligible failure rates (from 10 to 50%, notably in refractory focal epilepsy cases with normal magnetic resonance imaging (MRI)) of classical epilepsy surgeries, which consist of the resection of a single ‘epileptogenic zone’[7].
1.1.3 Electroencephalography
1.1.3.1 General definition and brief history
Because epilepsy is fundamentally the result of abnormal neuronal discharges, EEG is the single most important investigative technique for the study of epilepsy. EEG consists in an electrophysiological recording of the brain’s electrical activity. The electroencephalogram (recorded signal) displays spatial and temporal voltage variations due to ionic currents flowing
within brain neurons. It is characterized by a high temporal resolution (order of ms), allowing the evaluation of dynamic cerebral functions [11].
The first reported electrical activity-based neurophysiological monitoring was performed by Canton (British neuropsychologist) in 1875 in monkeys and rabbits [12]. It took another half century until the first recording of human brain electrical activity was performed by Hans Berger (German psychiatrist) in 1924 [12]. By the 1950’s EEG became widely used in clinical practice [13]. EEG is most widely used in clinical practice for the diagnosis of patients with epilepsy, suspected seizures (e.g. psychogenic seizures), unusual spells, and sleep disorders [14]. It has also been adopted to monitor the depth of anaesthesia during surgery [15]. In addition, EEG is extensively investigated in several research areas namely neuroscience, brain computer interfaces, and neuropsychology [11].
1.1.3.2 Brief background of EEG
EEG displays neuronal electrical activity resulting from the summation of inhibitory and excitatory postsynaptic potentials of large group of neurons. It is considered to be mainly produced by pyramidal cortical neurons, which are arranged in parallel, perpendicularly to the surface of the brain, and have their cell bodies mainly in layers III and V of the cerebral cortex [16]. Spatial organization of the pyramidal cortical neurons creates a cortical dipole layer, that is assumed to be the electrical source of scalp-recorded EEG signals. Scalp EEG measures brain’s electrical activity by placing electrodes directly on the scalp (Figure 1.1). Thus, the electrical signal displayed on a selected channel is produced by clusters of similarly angled cortical neurons near the recording site. Each contact records a minimum of 6 cm2 of synchronous cortical activity
(104 – 106 neurons). The summed electrical activity can be modelled as a dipole (a field with
negative and positive poles) [17]. Direction of the energy flow of the generated dipole is parallel to the angle of the involved pyramidal cells. Negative poles are optimally sensed when they are perpendicular to the recording electrode. In such case, the dipole’s positive end is subcortical and can be only detected with depth electrodes. Thus, scalp EEG highly depends on the orientation and distance between the dipole and the corresponding recording electrode [18]. The highly resistive nature of the skull, the inhomogeneity and anisotropy of the intervening tissue as well as the head’s complex geometry result in a relatively high attenuation and distortion at the EEG signal level, with amplitudes, which are around 10 times smaller than those of extracellular field potentials [11].
Figure 1.1 Scalp EEG electrode placement according to the 10-10 international electrode placement system [19]
1.1.3.3 Intracranial EEG
Intracranial electroencephalography (iEEG) allows to overcome the distortion of signals from the skull’s resistance. It is an invasive electrophysiological investigation requiring the placement of macro-electrodes directly on the surface or inside of the brain, allowing for a higher signal to noise ratio (as compared to scalp recordings). A grid or strip of electrodes can be placed on or slipped under the brain (Figure 1.2A) to record the brain’s electrical activity. Grid and strip electrodes can be complemented by depth contacts to record deep brain structures (Figure 1.2B). Thus, electrical fields generated by groups of neurons are measured intracranially. Unlike scalp EEG, electrode positions are chosen in a patient-specific manner during iEEG investigations. 1.1.3.4 EEG frequency bands
The EEG has a relatively large frequency bandwidth that can be sub-divided into well-defined rhythms or oscillatory waveforms. Main EEG rhythms are generally classified based on amplitude, frequency range, and area of the recorded brain signals [11]. The delta rhythm (0.5 – 4 Hz) is characterized by high amplitude signals usually observed in sleep over frontal and occipital areas in adults and children respectively. The theta rhythm (4 – 8 Hz) shows an irregular morphology and is characteristic of sleep and drowsiness in adults. The alpha rhythm (8 - 13 Hz) is observed over the posterior regions of the head during wakefulness. The beta rhythm (13 – 30 Hz) appears mainly in frontal and central regions during motor tasks but usually decreases during the execution of movements.
Figure 1.2 Intracranial electroencephalography. A: Intracranial study combining grid and strip electrodes as well as depth electrodes; B: Depth electrodes and grid electrodes; C: Skin flap
sutured back with recorded wires tunnelling out; D: 3-D Representation of a subdural grid electrodes, strip electrodes and depth electrodes; E: Raw iEEG recordings from 5 electrode
contacts.
The gamma rhythm (30 – 80 Hz) is associated with information processing, consciousness and perception.
1.1.4 The EEG in focal epilepsy
Patients with focal epilepsy exhibit focal epileptiform abnormalities. These are usually divided into a) ‘interictal’ discharges (‘spikes’) which are brief (20-200ms) asymptomatic paroxysmal EEG transients clearly distinguished from background; and b) ‘ictal’ discharges which are sudden focal rhythmic activity with characteristic pattern of evolution (with respect to amplitude, frequency and spatial distribution) lasting at least several seconds to minutes. These ictal discharges are generally associated with clinical seizure manifestations (electroclinical seizures) but can sometimes be clinically silent (electrical seizures) [20]. With a routine 30- min EEG, interictal spikes can be found in approximately 50% of epileptic patients (and in up to 84% by the third serial EEG).
Because routine EEGs are brief in duration, seizures are rarely captured. In circumstances when seizures need to be recorded, long-term video-EEG monitoring is performed. Long-term video-EEG monitoring is particularly useful for the evaluation of drug-refractory epileptic patients who are candidate for epilepsy surgery [21]. It may provide useful information to localize the epileptic focus that needs to be removed to ensure seizure-freedom. Electrically, seizures typically appear as a sudden rhythmic activity evolving in frequency, amplitude and distribution over time with an abrupt ending. Seizures are analysed to infer on the side (lateralization) and site (localization) of the epileptic focus. For example, rhythmic epileptic discharges over the right temporal surface electrodes at seizure onset suggest a right temporal lobe focus. During their 1-2 week stay in the epilepsy monitoring unit, several (usually 3 to 5) seizures are recorded to make sure that the patient has only one epileptic focus, rather than multiple foci. While this can be easily achieved in patients with very frequent attacks, withdrawal of anticonvulsant medication under clinical supervision may be required when seizures do not occur with sufficient regularity for proper recording [22].
When scalp EEG and complementary non-invasive studies (such as brain MRI and positron emission tomography (PET)) fail to adequately localize the focus, invasive intracranial EEG studies are generally required to delineate the focus with more precision. These studies consist of the implantation of intracranial electrodes through craniotomy or burr holes under general anaesthesia in brain regions of suspected epileptogenicity, based on presurgical non-invasive tests and hypotheses about the localization of the epileptogenic zone. A post-implantation MRI is then used to verify the precise 3D location of each electrode contact. Whereas a large cortical surface (of about 6-10 cm2) is required to generate a recordable signal by extracranial electrodes, intracranial electrodes can pick up potential changes occurring over only a few millimetres of cortex with excellent temporal resolution (~ 1ms). While intracerebral EEG overcomes the sensitivity limitations of scalp electrodes because they are closer to bioelectric sources of epileptiform activity, only a limited number may be safely implanted to minimize risk of haemorrhage, oedema or infection. With intracranial EEG, several patterns have been reported at seizure onset but the most frequent one is the sudden appearance of a low voltage fast activity discharge with subsequent increase in amplitude and decrease in frequency. Propagation may be gradual or extremely rapid to surrounding and more distant structures for variable reasons, notably because of the connectivity of involved structures. Although intracranial electrodes allow
for better definition of the epileptogenic zone, its complete delineation may sometimes remain elusive. The reason for this is, in many cases, the seizure discharge may appear quite complex by visual inspection, with rapid involvement of more than one brain region due to the rapid propagation of discharges. Finally, it must also be mentioned that inadequate intracranial electrode coverage may produce a false electrographic picture as the first signal recorded may simply represent propagation if there is no electrode over the actual seizure onset zone.
1.1.5 Treatment of epilepsy
1.1.5.1 Medical treatment of epilepsyFollowing the diagnosis of epilepsy, the first line of therapy consists of the use of antiepileptic drugs. Several antiepileptic drugs are currently available on the market. The choice of the antiepileptic drug depends on several factors such as the type of seizures, the epileptic syndrome, antiepileptic drug side effects, comorbid medical conditions (such as psychiatric, renal or hepatic conditions for example), potential interactions with other drugs taken by the patients and costs [23].
While there are more than 15 antiepileptic drugs to choose from, a third of patients continue to suffer from uncontrolled seizures. An important study by Kwan and Brodie has shown that after the first antiepileptic drug used, seizures in approximately 50% of patients are controlled, while in another 10%, seizures are eventually controlled by using a second antiepileptic drug. However, for the remaining patients, whatever next drug is chosen, only 5% of the patients show eventual control [24]. Potential explanations for this drug-refractoriness include the fact that several antiepileptic drugs share the mechanisms of action (ex. several are presynaptic voltage-gated sodium channel blockers), the fact that most of these drugs were discovered/screened using the same old animal models of epilepsy, or that the patients have an intrinsic multidrug resistance mechanism. Finally, it must be noted that although majority of the epileptic patients are well controlled on medication, this may sometimes be accompanied by side effects (dizziness, fatigue, intermittent double vision, mental slowing, somnolence …). Furthermore, although a patient’s epilepsy is generally well controlled, it does not necessarily mean that he cannot have breakthrough seizures from time to time. Besides, adherence to treatment is a major issue as some studies, using a variety of direct and indirect methods, indicate that 30-60% of epileptic patients do not fully adhere to their antiepileptic drug [23].
Alternative possible treatments for patients with refractory epilepsy are discussed below. 1.1.5.2 Non-medical treatment of epilepsy
Several non-medical therapies are available. The ketogenic diet is sometimes used in very specific types of drug-resistant epilepsy, notably, for some epileptic encephalopathies in young children [25]. This treatment, however, is quite challenging and long-term consequences of a high fat, low sugar diet remains uncertain particularly on growth, cardiovascular and bone health. Vagus nerve stimulation is another non-medicinal option, which consists of the chronic stimulation of the left Vagus nerve using a generator inserted under the pectoralis muscle. However, this treatment is considered a palliative treatment. Indeed, while 30-40% of patients can experience a 50% reduction of their baseline seizure frequency, less than 3% of the patients become seizure-free [26].
Epilepsy surgery is also an interesting option which consists in the surgical resection of the epileptic focus to cure seizures. In order to localize the epileptic focus to be removed, patients first need to undergo a battery of complementary non-invasive tests [27], which include: a) a good clinical history (seizure semiology can provide clues to focus localization); b) an MRI (looking for causal epileptogenic lesions); c) video-EEG monitoring (to observe seizure semiology and to characterize epileptic activity between and during seizures); and d) positron emission tomography (to reveal localized areas of abnormal glucose use). Some centers are also equipped to perform ictal single photon emission computed tomographies (revealing localized areas of increased blood flow during seizures), simultaneous EEG and functional MRI (analysing areas of transient increased blood flow and decrease in reduced haemoglobin during averaged spikes) and magnetoencephalography (to pinpoint sources of spike-triggered magnetic field disturbances). In case, these complementary non-invasive studies fail to adequately localize the epileptogenic zone, an invasive EEG study is then performed as mentioned above (required for about 25% of the patients with refractory epilepsy enrolled in the pre-surgical evaluation protocol) [27]. Despite important advances in the field of presurgical evaluation and epilepsy surgeries, it must be noted that success rates of these approaches remain modest. In temporal lobe epilepsy surgeries, the probability of becoming seizure-free is approximately 75% in lesional cases (i.e. with an MRI identifiable lesion) and only 50% in nonlesional cases. In frontal lobe epilepsy surgeries, the probability of becoming seizure-free is only 60% in lesional and a mere 35% in nonlesional cases [28]. The most obvious explanation for surgical failures is inaccurate
localization of the epileptic focus [29]. This can in part be accounted for by limitations in the current localization techniques. Furthermore, not all patients can benefit from surgery, such as patients whose epileptogenic zone overlies eloquent functionally important brain regions (language, visual and sensorimotor cortices), patients with multifocal epilepsy and patients for whom the seizure onset could not be adequately identified.
1.2 Problem statement
Because of their unpredictable nature, uncontrolled seizures represent a major personal handicap and source of worry for patients. In addition, persistent seizures constitute a considerable burden on healthcare resources, accounting for a high number of disability days or unemployment and low annual income [1, 30]. Some difficulties and challenges faced in the treatment of drug-refractory patients can be overcome by algorithms able to anticipate seizures. Seizure detection and prediction algorithms have been proposed in an attempt to deliver therapies during times of high likelihood of seizures [31]. It has been recently demonstrated that seizures are more likely to be controlled by means of closed-loop stimulations as compared to open loop strategies [32]. Although detection algorithms are currently better in terms of sensitivity (SS) and specificity (SP) than prediction algorithms, the activation of seizure-aborting interventions (such as focal cooling, electrical stimulation or release of anticonvulsants) after the electrical seizure onset means that patients could already have disabling clinical manifestations or that the brain has reached a point of no return after which it will evolve into a seizure with impaired consciousness or with bilateral tonic-clonic convulsions [33].
1.2.1 Seizure detection
Over the last decade, we and others have mainly focused on seizure detection using scalp and iEEG recordings [34, 35]. Our group has worked on: a) a low-power integrated circuit, intended for real-time epileptic seizure detection, which was tested using intracranial long-term EEG recordings from 7 patients with an average seizure detection delay of 13.5s [36]; b) a low-power closed-loop neuro- stimulator composed of a detector chip and an electrical stimulator assembled with recording electrodes [37]; and c) a responsive focal drug delivery system based on a new asynchronous seizure detector (~16s latency) [31].
Figure 1.3 NeuroVista ambulatory monitoring device’s implantation in dogs with naturally occurring focal epilepsy [38].
Recently, the responsive neurostimulation (RNS) system (NeuroPace Inc.) was approved by the food and drug administration (FDA) as an adjunctive treatment of adult patients with medically refractory focal epilepsy [39]. The device continuously monitors brain activity and provides electrical stimulation upon seizure detection. Unfortunately, reduction in seizure frequency was only modest (44% at one year) [32, 40] and the device could only retain a low number of brief detected epochs due to power and storage constraints [41]. On the other hand, the NeuroVista ambulatory monitoring device was recently proposed to continuously acquire iEEG data and transmit them to an external processing unit for subsequent storage and analysis [42]. The implantable part of the device combines a lead assembly (4 x 4-contacts’ silicone strips) and telemetry unit. Intracranial EEG signals are amplified and sampled at 400 Hz within the implantable telemetry unit and then transmitted to a personal advisory device that features an embedded seizure detection algorithm, a user interface, and an email algorithm for output [42]. Interestingly, long-term continuous iEEG recordings spanning more than one year in some dogs, were recently acquired and made freely available at the ieeg.org portal.
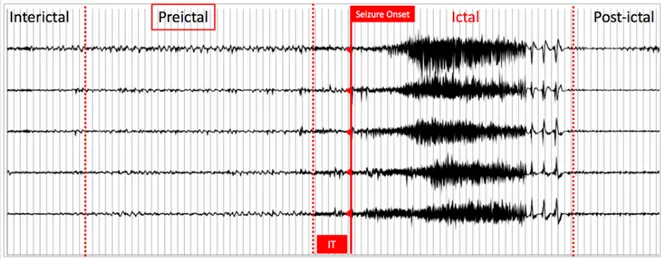
Figure 1.4 Five-channels iEEG illustrating typical epileptic brain states; IT: intervention time Conceptually, any intervention based on seizure detection is faced with the problem that for most patients, overt clinical manifestations are already present by the time a seizure is detected (~10-15s), at which stage, aborting a seizure is more difficult (possibly past the ‘point of no return’). In contrast, seizure forecasting investigates the possibility of detecting patterns before seizure onset, providing more warning time and intervention much before the point of no return.
1.2.2 Seizure prediction
Cumulative data now indicate that there is a gradual transition between the interictal (in between) and ictal (during) seizure states, known as the preictal state [43-47]. Thus, seizure prediction can be considered as the early detection of the preictal state. Figure 1.4 shows 5-channel- iEEG recordings, illustrating typical brain states. The intervention time (IT) lies between the end of the preictal period and seizure onset. Unfortunately, the ability to accurately identify the pre-seizure state remains elusive [33, 48, 49]. The guidelines proposed by Mormann et al. 2007 have paved the way to more realistic and reproducible results although less optimistic [33]. In a recent review, we critically analysed all the existing work on seizure prediction, from signal acquisition to performance evaluation [48]. Although results varied between studies, many showed acceptable performances that could be appealing for the design of advisory/intervention devices. There is, however, a great potential for improvement and optimization in the seizure forecasting framework [33, 48, 49].
Some of the critical aspects that need to be addressed to improve seizure forecasting performances are briefly discussed below:
1) In a great majority of previous seizure prediction investigations, an initial set of only six electrodes (3 focal, 3 afocal) have been used [33, 48, 49]. This is mainly because these were the only ones available in international databases, selected based on visual inspections of seizure origin and propagation by expert neurophysiologists. Snyder et al. (2008) emphasized that reliable seizure forecasting algorithms should be implemented on electrodes placed in brain areas, where preictal changes are detectable [50]. Gadhoumi et al. (2012) reported promising results by including three bipolar channels for the 4-deepest contacts implanted in the seizure onset zone [51]. In contrast, several endeavours claimed that remote channels could also carry predictive information [52, 53]. Subsequently, Gadhoumi et al. (2015) highlighted the need for including
bilateral neocortical electrodes in the design of seizure predictors [49]. On the other hand, due to
the explosive nature of seizure propagation through the brain, recent studies have demonstrated an imperfect visual identification of the epileptogenic regions and favour the use of quantitative functional connectivity-based methods [7, 10, 54-56].
2) Previous seizure forecasting investigations have generally looked at discontinuous recordings either from the University of Freiburg database, the European Epilepsy Database, Boston database, or local recordings. Considering the established effects of drug tapering/changes in medication, changes in vigilance states, and circadian influences on the dynamics of EEG recordings, more caution should be considered when assessing seizure forecasting performances based on such discontinuous recordings. In addition, because the discriminability of iEEG features is highly dependent on time and the non-stationary nature of EEGs can culminate in mis-estimation of algorithm performance, long-term continuous recordings that mimic real clinical scenarios, rather than discontinuous recordings, are recommended [57]. Gadhoumi et al. (2015) established that the assessment of seizure forecasting algorithms on continuous long-term EEG recordings encompassing several conditions and states is sufficient to prove its clinical validity [49].
3) Previous feature selection efforts focused on ranking methods to select the most discriminative characteristics [45, 58, 59]. Although much effort has been made towards identifying unique precursors of seizure activity, no single feature has been shown to be capable of individually characterizing the preictal state [33, 48, 49]. However, a combination of features may be able to display brain dynamics during transition to seizure [49]. Thus, it is important to
use incremental feature selection algorithms that tend to establish which combination of features is discriminative of the preictal state.
4) Spectral band power, which aims to display amplitude modulations within defined frequency bands over time, has been most commonly used in previous seizure forecasting investigations. While this feature could quantify phase changes, it failed in identifying interactions between different frequencies. In contrast, higher order spectral measures based on cross frequency coupling have been proposed to be the carrier mechanism for the relationships of global and local neuronal processes. Two recent studies in the field of seizure prediction attempted to explore cross frequency and reported promising performances [45, 60]. Investigating
other types of frequency coupling may be an interesting and promising avenue for feature
extraction in epileptic seizure prediction.
1.3 Objectives, hypotheses, and research work overview
The overarching goal of this thesis was the development of an accurate seizure forecasting algorithm based on continuous long-term iEEG recordings.
Our specific aims are:
AIM 1: To develop an accurate seizure forecasting algorithm, validated on long-term continuous
canine bilateral iEEG recordings acquired using an ambulatory monitoring device.
We hypothesize that 1) an adequate selection of electrodes based on an adaptive effective connectivity approach and 2) a new incremental feature selection based on a genetic algorithm can improve seizure forecasting capabilities.
Article 1: Elie Bou Assi, Dang K. Nguyen, Sandy Rihana and Mohamad Sawan, A Functional-Genetic Scheme for Seizure Forecasting in Canine Epilepsy, IEEE Transactions on Biomedical
Engineering (IF: 4.288), 65(6), 1339-1348, June 2018, included in the journal’s feature story/
website main page, https://doi.org/10.1109/TBME.2017.2752081.
This work was presented as an invited talk at the 1st Symposium on the Applications of Artificial
Intelligence in Medicine (Montreal, May 2018).
AIM 2: To investigate the feasibility of accurate identification of generators and sinks of seizure activity using high density human iEEG recordings based on the spectrum weighted adaptive
directed transfer function (swADTF) in patients with drug-resistant epilepsy and being investigated for potential epilepsy surgery.
We hypothesize that the use of effective connectivity measures based on the swADTF allows an accurate identification of seizures’ origin and propagation (network of seizure activity).
Article 2: Elie Bou Assi, Dang K. Nguyen, Sandy Rihana and Mohamad Sawan, Effective Connectivity Analysis of Operculo-Insular Seizures, Epilepsy Research (IF: 2.49), submitted (July 2018).
This work was presented as part of an Investigators’ workshop entitled Insular Epileptic Networks at the 71st Annual Meeting of the American Epilepsy Society (Washington DC,
December 2017).
AIM 3: To assess the feasibility of seizure forecasting based on higher order spectral analysis and artificial neural networks.
We hypothesize that 1) capturing information about multifrequency behaviours, quantified by complex metrics, related to the concept of cross-frequency coupling and 2) the design of a classifier based on such inputs can emerge as a new avenue for seizure forecasting.
Article 3: Elie Bou Assi, Laura Gagliano, Dang K. Nguyen, Sandy Rihana and Mohamad Sawan, Leveraging Higher Order Spectra and Artificial Neural Networks: Towards New Precursors of Seizure Activity, Scientific Reports (IF: 4.122), revised version submitted (July 2018).
This work will be presented as part of the Artificial Intelligence in Epilepsy workshop at the 2018 Canadian League Against Epilepsy Scientific Meeting (St John’s, September 2018).
In parallel, additional scientific contributions were published during this thesis through auxiliary collaborative work:
Additional related Articles (2):
Elie Bou Assi, Dang K. Nguyen, Sandy Rihana, Mohamad Sawan, Towards accurate prediction of epileptic seizures: A review, Biomedical Signal Processing and Control, 34, 2017, 144-157, ISSN 1746-8094, https://doi.org/10.1016/j.bspc.2017.02.001.
Laura Gagliano, Elie Bou Assi, Dang K. Nguyen, Sandy Rihana, and Mohamad Sawan, Bilateral preictal signature of phase-amplitude coupling in canine epilepsy, Epilepsy Research, 139, 2018, 123-128, https://doi.org/10.1016/j.eplepsyres.2017.11.009
Conference proceedings (4):
Elie Bou Assi, Dang K. Nguyen, Sandy Rihana, and Mohamad Sawan, "A hybrid mRMR-genetic based selection method for the prediction of epileptic seizures," 2015 IEEE Biomedical Circuits
and Systems Conference (BioCAS), Atlanta, GA, 2015, pp. 1-4.
Elie Bou Assi, Dang K. Nguyen, Sandy Rihana, and Mohamad, "A 2D clustering approach investigating inter-hemispheric seizure flow by means of a Directed Transfer Function," 2016 3rd
Middle East Conference on Biomedical Engineering (MECBME), Beirut, 2016, pp. 68-71.
Elie Bou Assi, Dang K. Nguyen, Sandy Rihana and Mohamad Sawan, "Refractory epilepsy: localization, detection, and prediction," 2017 IEEE 12th International Conference on ASIC (ASICON), Guiyang, 2017, pp. 512-515.
Laura Gagliano, Elie Bou Assi, Dang K. Nguyen, and Mohamad Sawan, Bicoherence of intracranial EEG: A novel precursor of seizure activity in canine epilepsy, submitted to the 2018 2nd IEEE Life Sciences conference, Montreal, 2018.
Related Conference abstracts (3):
Elie Bou Assi, Dang K. Nguyen, Sandy Rihana, M. Sawan, "On the proper selection of electrodes for seizure forecasting in canine epilepsy" International Conference on Technology and Analysis of Seizures, 20-23 Aug. 2017
Laura Gagliano, Elie Bou Assi, Dang K. Nguyen, Sandy Rihana, M. Sawan, "Bilateral Preictal Signature of Phase Amplitude Coupling in Canine Epilepsy" International Conference on Technology and Analysis of Seizures, 20-23 Aug. 2017
Elie Bou Assi, Dang K. Nguyen, Sandy Rihana, M. Sawan, "Dimensionality reduction in seizure prediction studies" (Epilepsy Currents), 69th Annual Meeting of the American Epilepsy Society, 4-8 Dec. 2015
This thesis is organized as follows: Chapter 2 reviews the general framework of reliable algorithmic seizure prediction studies, discussing each component of the whole block diagram. It explores steps along the pathway from signal acquisition to adequate performance evaluation that should considered in the design of an efficient seizure advisory/intervention system. Chapter 3 briefly introduces different signal processing approaches used in this thesis. Chapters 4, 5, 6 consist of published/submitted papers that addresses the 3 main objectives of this work. Chapter 7 and 8 respectively elaborates a general discussion and conclusion of the entire thesis.
CHAPTER 2
LITERATURE REVIEW
To date, very interesting reviews of seizure prediction have been published [33, 49], but none has been specifically dedicated to classification methods in an algorithmic seizure prediction framework. We start by presenting basic conventions and considerations for reliable seizure prediction. Various seizure prediction approaches adopted by the epilepsy research community are discussed while paying special attention to algorithmic studies because of their applicability in seizure advisory/intervention implantable devices. The basics, history, and advancements in algorithmic studies are detailed in a block-by-block fashion. We have reviewed state-of-the-art achievements in each block, highlighting signal processing methods that have contributed to progress and yielded realistic evidence in the field. Several acquisition modalities are covered, focusing on intracranial (iEEG) and/or scalp EEG recordings. The algorithmic studies reviewed are based on personal and international databases as well as long-term recordings with ambulatory devices. Feature extraction covers linear and nonlinear methods with both univariate and multivariate approaches. Prominent feature selection techniques, classifiers as well as regularization functions are compared. The discussion section emphasizes current issues and required considerations with analyses of the progress made in each block.
2.1 State-of-the-art
2.1.1 Basic conventions in seizure prediction studies
Seizure detection employs algorithms that aim to detect seizure onset. Seizure prediction looks at the possibility of forecasting seizure occurrence and is therefore intended for fulfillment much earlier than detection. This review focuses solely on algorithmic seizure prediction studies. Published works were selected to cover different signal processing strategies proposed in a seizure forecasting framework. When several studies using similar processing approaches were found, only those adhering to the recommendation for reliable seizure prediction were selected [33]. Studies proposing novel methods, but not adhering to the reliable forecasting recommendations, were discussed, highlighting potential pitfalls. Numerous investigations have demonstrated gradual transition between interictal (in-between) and ictal (during ) seizure states, known as the preictal state [49]. Thus, seizure prediction can be considered as early detection of the preictal state. Some recent studies have added the notion of intervention time (IT) or seizure horizon [38]. IT, assumed to lie between the end of the preictal period and seizure onset, should
ensure enough time for intervention and help to distinguish seizure prediction from simple seizure detection.
2.1.2 Different approaches to seizure prediction
Seizure prediction is an active research topic dating back to the 1970s. In a detailed review on the predictability of epileptic seizures, Mormann et al. [33] presented a chronological overview of seizure prediction studies and their findings. Early approaches searched for precursors from scalp EEG with linear methods, such as autoregressive modeling [61, 62]. Then, studies suggesting the possibility of preictal phenomena started emerging. The latter – generally based on nonlinear dynamics [63] – were, however, limited to investigations of the preictal state, without taking the normal brain state into account. They were followed by proof-of-principle and controlled studies on predictability that tackled the issue of specificity by making comparisons between preictal and interictal states. Although these early findings were optimistic, the absence of statistical validation and reproducibility was a major constraint in the development of clinical devices. They led to a phase that Mormann et al. [33] called “the rise of skepticism”, during which studies based on extensive databases revealed poorer performance than earlier ones. It highlighted the need for statistical validation and long-term multi-day EEG recordings made possible at the turn of the millennium due to booming mass storage capability. Current seizure prediction approaches can be grouped into 2 main categories: analytical/statistical and algorithmic. Since the main goal of prediction studies is seizure control, it can be achieved by implementing algorithms able to track the preictal state. Accurate seizure-prediction algorithms may open possibilities for on-demand, EEG-triggered interventions once the preictal state is detected. Below, we review algorithm-based studies in a methodological manner, discussing each component of the whole block diagram.
2.1.3 Algorithmic-based studies
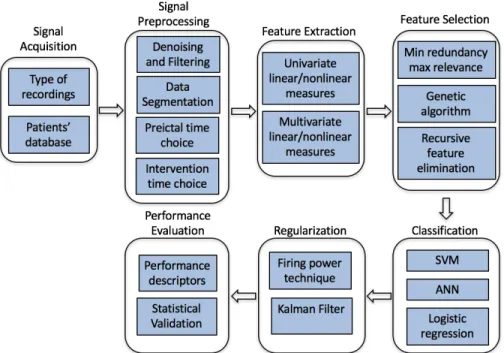
These studies, which implement algorithms to detect the preictal state based on EEG recordings, typically start by preprocessing EEG signals to enhance their quality, extract different features able to display preictal state dynamics, and then select the most discriminative ones as inputs to the classifier. Most seizure prediction algorithms have a regularization function as a postprocessing step to smooth classifier output. Performance of the algorithm is then evaluated (Figure 2.1).
Figure 2.1Typical block diagram of algorithmic-based studies 2.1.3.1 Signal acquisition
2.1.3.1.1 Recording type: scalp EEG vs iEEG
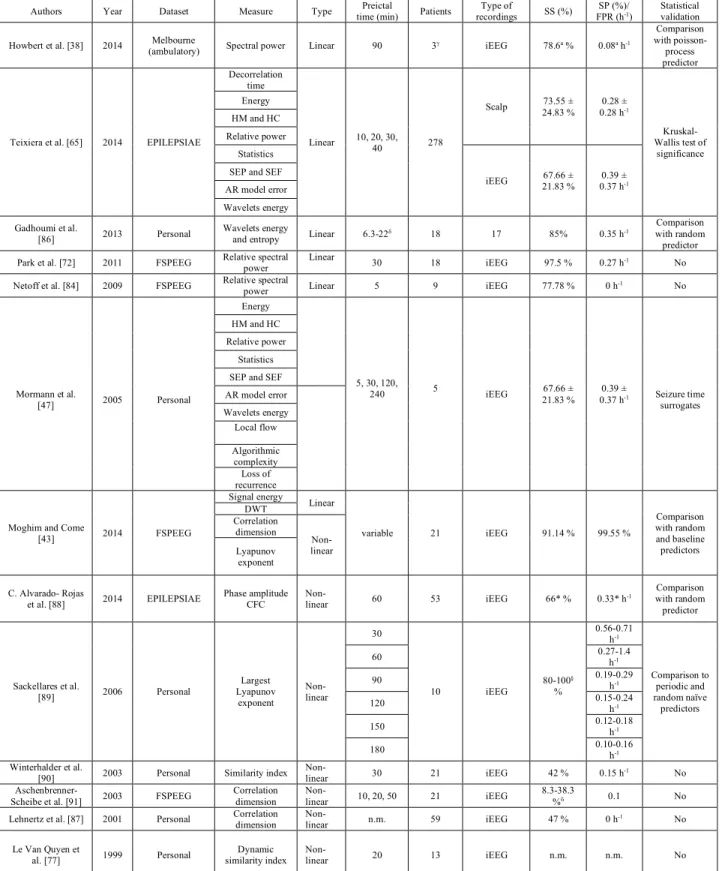
Both scalp and iEEG recordings have been considered in seizure prediction studies. Scalp EEG captures brain activity with equally-spaced surface electrodes glued to the skin while iEEG involves intracranial electrodes positioned in areas of suspected epileptogenicity identified from available clinical, structural and functional data collected prior to implantation [64]. Several studies have explored the utility of scalp recordings for seizure prediction [33]. For example, Teixeira et al. [65] compared the performance of a subject-specific algorithm on scalp EEG, iEEG and mixed scalp and iEEG recordings. Performance values were slightly better in terms of sensitivity and false prediction rate (FPR) with scalp EEG (sensitivity=73.55%±24.83%; FPR=0.28 h-1±0.28 h-1) than intracranial recordings (sensitivity=67.66%±21.83%; FPR=0.39 h -1±0.37 h-1). However, when comparing statistical significance of the results with the
Kruskal-Wallis (K-W) test (p=0.01), these differences were found to be nonsignificant. Rasekhi et al. [66] tested the preprocessing effects of 22 linear univariate features on the performance of seizure-prediction methods and concluded that scalp EEG (sensitivity=76.67%, FPR=0.08 h-1) fared
better than iEEG recordings (sensitivity=68.7%, FPR=0.33 h-1). Their work was, however,
![Figure 1.1 Scalp EEG electrode placement according to the 10-10 international electrode placement system [19]](https://thumb-eu.123doks.com/thumbv2/123doknet/2325256.30203/24.918.185.734.106.368/figure-scalp-electrode-placement-according-international-electrode-placement.webp)
![Figure 1.3 NeuroVista ambulatory monitoring device’s implantation in dogs with naturally occurring focal epilepsy [38]](https://thumb-eu.123doks.com/thumbv2/123doknet/2325256.30203/30.918.189.752.119.547/figure-neurovista-ambulatory-monitoring-implantation-naturally-occurring-epilepsy.webp)