ContentslistsavailableatScienceDirect
Journal
of
Hydrology:
Regional
Studies
j ou rn a l h o m epa ge : w w w . e l s e v i e r . c o m / l o c a t e / e j r h
Scenarios
of
groundwater
chemical
evolution
in
a
region
of
the
Canadian
Shield
based
on
multivariate
statistical
analysis
Ombeline
Ghesquière
∗,
Julien
Walter,
Romain
Chesnaux,
Alain
Rouleau
Centred’étudessurlesressourcesminérales,UniversitéduQuébecàChicoutimi,555Boul.del’Université,
Chicoutimi,Québec,CanadaG7H2B1
a
r
t
i
c
l
e
i
n
f
o
Articlehistory:Received6February2015 Receivedinrevisedform7June2015 Accepted8June2015
Availableonline21July2015 Keywords:
Hierarchicalclusteranalysis
Factoranalysis
Regionalhydrogeochemistry
CanadianShield
Quaternarysediments
a
b
s
t
r
a
c
t
Studyregion:Thestudyofgroundwaterchemistryofthe Charlevoix/Haute-Côte-Nord(CHCN)regionintheprovinceofQuebecinCanadaispartofaregional hydrogeologicalcharacterizationproject.
Studyfocus:Groundwaterwassampledin113wellsoverthe4500km2study
areaandanalyzedfor39parametersincludingmajor,minor,traceandinorganic constituents,plusstableisotopes2Hand18O.Twomultivariatestatistical meth-ods,hierarchicalclusteranalysis(HCA)andR-modefactoranalysis(RFA)were combinedwithgraphicmethodstoclassifythesamplesaccordingtoplausible levelsofgroundwaterevolutioninthatregion.
Newhydrologicalinsightsfortheregion:Foursampleclusterswereidentified. Cluster1iscomposedoflow-salinityCa-HCO3groundwatercorrespondingto
recentlyinfiltratedwaterinsurfacegranularaquifersinrechargeareas.Cluster 4Na-(HCO3-Cl)groundwaterismoresalineandcorrespondstomoreevolved
groundwaterprobablyfromconfinedbedrockaquifers.Cluster2andCluster3 (Ca-Na)-HCO3andCa-HCO3 groundwater,respectively,correspondtomixed
orintermediatewaterbetweenCluster1andCluster4frompossibly inter-connectedgranularandbedrockaquifers.Thisstudyidentifiesgroundwater recharge,water–rockinteractions,ionexchange,solutediffusionfrommarine clayaquitards,saltwaterintrusionandalsohydraulicconnectionsbetweenthe CanadianShieldandthegranulardeposits,asthemainprocessesaffectingthe hydrogeochemicalevolutionofgroundwaterintheCHCNregion.
©2015TheAuthors.PublishedbyElsevierB.V.Thisisanopenaccessarticle undertheCCBY-NC-NDlicense(http://creativecommons.org/licenses/ by-nc-nd/4.0/).
∗ Correspondingauthor.Tel.:+14188158671.
E-mailaddresses:ombeline.ghesquiere1@uqac.ca(O.Ghesquière),julienwalter@uqac.ca(J.Walter),
romainchesnaux@uqac.ca(R.Chesnaux),alainrouleau@uqac.ca(A.Rouleau).
http://dx.doi.org/10.1016/j.ejrh.2015.06.004
2214-5818/©2015TheAuthors.PublishedbyElsevierB.V.ThisisanopenaccessarticleundertheCCBY-NC-NDlicense
1. Introduction
ThechemistryofgroundwaterintheCanadianShieldanditsevolutionwithdepthorwith dis-tancealongaflowpathhavebeeninvestigatedbynumerousauthors,namelyGascoyneandKamineni (1994).Recentandshallowgroundwaterchemistryiscontrolledbythecompositionofthelocalrock, wheredissolutionreactionsdominate,whileitsisotopiccompositionreflectstheprecipitation.In con-trast,thechemistryofdeepergroundwateristheresultofextensive,long-terminteractionswiththe bedrock(Frapeetal.,1984).Anumberofstudies(e.g.MelloulandCollin,1992;GülerandThyne,2004; Silva-Filhoetal.,2009)haveshownthatthehydrogeologicalcontext,combinedwith hydrogeochem-icalandisotopiccharacterizationofanaquifercanhelptoidentifydifferenttypesofgroundwater (Ca-HCO3,Na-HCO3andNa-Cltypes)aswellasthemainfactorsthatinfluencethechemical compo-sitionofgroundwater.Otherstudies(Cloutieretal.,2008;Beaudry,2013;Montcoudioletal.,2014) havedemonstratedasignificantcorrelationbetweenthehydrogeologicalcontextandthe groundwa-terchemistryinregionsoftheCanadianShield.Characterizingthehydrogeologicalcontextinparallel withthehydrogeochemicalandisotopicstudyofgroundwaterallowsabettercharacterizationof groundwaterflowandoftheevolutionofitschemicalcomposition.
Güleretal.(2002)showedthatthecombinationofgraphicalandmultivariatestatisticaltechniques providesaconsistentandobjectivemeansofclassifyinglargenumbersofsampleswhilestill preserv-ingtheeaseofclassicgraphicalrepresentations.Cloutieretal.(2008),Yidana(2010)andMontcoudiol etal.(2014)usedmultivariatestatisticalanalysistosupplementgraphicalrepresentationssuchas Schoeller,Stiff,DurovandPiperdiagrams.Usingastatisticalapproach,theysuccessfullyidentified majorgroundwatergroupsandfactorsaffectingthegroundwaterchemistryinanaquifer.
The main objective of this research is to characterize groundwater chemistry and to iden-tify the relationships between the hydrogeological context and groundwater chemistry in the Charlevoix/Haute-Côte-Nord(CHCN)regionbyusingacombinationofmultivariatestatisticalanalysis, graphicalrepresentationsandmaps.“Hierarchicalclusteranalysis”(HCA)and“R-modefactor anal-ysis”(RFA)arecombinedwithgraphicalanalysisusingDurovandStiffdiagramstodevelopabetter understandingofthegroundwaterchemistryanditsevolutionintheCHCNaquifersystemlocatedin theCanadianShield.
2. Studyarea
In 2008, the Government of Quebecimplemented the Programme d’acquisition de connais-sancessurleseauxsouterraines(PACES;GroundwaterKnowledgeAcquisitionProgramme)under theMDDEFP(MinistèreduDéveloppementDurable,del’Environnement,delaForêtetdesParcs),in ordertoimproveknowledgeofthisresource(GovernmentofQuebec,2015a,b).Thisprogramme con-sistsofanumberofregionalhydrogeologicalcharacterizationprojectsaimingtoacquireknowledge ongroundwaterresourcesinthesouthern,moredenselyinhabitedpartsoftheProvinceofQuebec, withtheobjectivesofprotectinggroundwaterandensuringthesustainabilityofitssupply(Chesnaux etal.,2011).
A regional hydrogeologicalcharacterization project, conducted by the Centre d’études sur les ressourcesminérales(CERM)atUniversitéduQuébecàChicoutimi(UQAC),startedin2012intheCHCN regionaspartofthePACESprogramme.Eventhoughongoingindustrialandagriculturaldevelopment presentsariskforgroundwatercontaminationinthisregion,noregionalhydrogeological charac-terizationprojecthadyetbeencarriedout.Thissituationcallsforapropercharacterizationofthe naturalgeochemicalpropertiesofgroundwaterandabetterunderstandingofthenaturalgeochemical processesthataffectthegroundwaterchemistryduringitsevolutionintheaquifersystems.
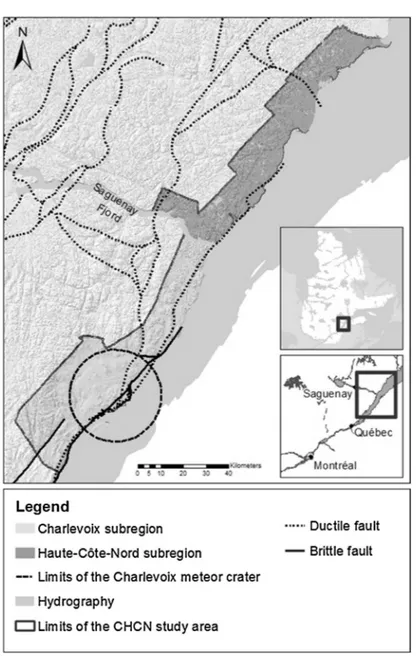
TheCHCNregionislocatedonthenorthshoreoftheSaint-LawrenceRivertothenortheastof Quebeccity(Fig.1).ThestudyregionformsanNEelongatedstretchoflandextendingover236km, approximately20kmwide,foratotalareaof4500km2.Theclimateoftheregionischaracterizedby longandcoldwinters,followedbyshort,warmandhumidsummers.Precipitationiswelldistributed throughouttheyear,mostlyinsnowfromNovembertoApril,andtotallingaround900mmperyear (GovernmentofQuebec,2015a,b).Thevegetationismainlycomposedofdeciduousandmixedtree stands.Mostoftheterritoryisforested;partsofitareexploitedbytheforestryindustry.
Fig.1.LocationandprincipalstructuralfeaturesoftheCHCNregion,Quebec,Canada.
AnimportantphysiographicfeatureistheWNW-trendingSaguenayFjordthatseparatesthestudy areaintwoparts:theCharlevoixsubregiontothesouth-westandtheHaute-Côte-Nordsubregionto thenorth-east(Cousineauetal.,2014).ThetopographyoftheCharlevoixsubregionischaracterizedby ameteoricimpactcraterdatedat372–335Ma,calledthe“Charlevoixmeteorcrater”(Rondot,1968). TheMontdesÉboulementscentraluplift,relatedtothemeteorcrater,isboundedbynormalfaultsand surroundedbyannularliftsanddepressions,suchasthevalleysofBaieSt.PaulandLaMalbaie,where thetopographyflattensandelevationsdecreasetosealevel(Rondot,1998).TheCharlevoixsubregion liesalongtheSt.Lawrenceriftsystemandisaseismicallyactivezone.TheCHCNregionismarkedby numerousnormalfaultswhichwereinitiatedorreactivatedduringvarioustectonicevents.Manyof thesenormalfaultsareconsideredtobestillactive(Fig.1).
3. Geologicalandhydrogeologicalfeatures
TheCHCNregionislocatedattheboundarybetweenthreegeologicalprovincesofeasternCanada; itisconstitutedof:(i)crystallinerocksoftheGrenvilleProvinceoftheCanadianShield,(ii)alower PaleozoicsedimentarysuccessionoftheSt.LawrencePlatform,and(iii)unitsofdeformedand trans-portedrocksoftheAppalachianorogentothesoutheast.ThebasementiscomprisedofProterozoic rockssuchasintrusiveigneousrocksandhigh-grademetamorphicrocks.TheGrenvillianrocksofthe Charlevoixareaaremainlycomposedofhigh-gradeorthogneissesandparagneisses,charnockites, andanorthositicandgraniticintrusions(Lemieuxetal.,2003).IntheHaute-Côte-Nord,Grenvillian rocksincludemigmatiteandgabbro.TheGrenvillebasementisoverlainbyLowerPaleozoic siliciclas-ticrocksoftheSt.LawrencePlatformjuxtaposedagainstaccretedunitsoftheAppalachianorogene (Lemieuxetal.,2000).
ThesedimentaryrockunitsofthestudyareaarerarelyexposedbecauseoftheQuaternary sedi-mentsthatoverlaythem.Quaternarysurfacesedimentsmainlyconsistofatilllayer,butglaciomarine, glaciofluvial,lacustrineandalluvialsedimentsarealsopresent.Tilldepositscanreachathicknessof 10mandlieunconformablyonrock.IntheHaute-Côte-Nord,thereisalargerproportionofcoastal glaciomarinesedimentsthaninCharlevoix,duetothelargecoastalareaandthegreatextentofthe deltaicsystems.Thinglaciomarinesedimentssuchassilty andclay-richdepositscanreachmore than100minthickness,whilecoastalanddeltaicsilty-sandorsanddepositsvaryfrom1to20min thickness(Cousineauetal.,2014).
BedrockaquifersprovidemostofthedrinkingwaterintheCharlevoixsubregion,whiletheresource ismostlypumpedfromsuperficialgranularaquifersintheHaute-Côte-Nordsubregion.A predomi-nanceofunconfinedaquiferscanbeidentifiedintheCharlevoixsubregion.TheChamplainSeainvasion thatoccurred10,000yearsagointhesoutheasternpartoftheCanadianShieldisstillaffecting ground-waterqualityinaquiferslocatedinareasthatwerecoveredbythatsea(Cloutieretal.,2008;Walter, 2010;Beaudry,2013;Montcoudiolet al.,2014).Silicateweathering,carbonatedissolution,Ca/Na cationexchangeandmixinghavebeenidentifiedasthemainprocessescontrollingthechemical evo-lutionofgroundwaterinthisarea(Cloutieretal.,2008;Walter,2010;Beaudry,2013;Montcoudiol etal.,2014).
4. Methodology
4.1. Hydrogeochemicaldataset
Atotalof113wells(Fig.2),distributedovertheentirestudiedareaandatamaximumdepthof approximately170m,weresampledusingasamplingprotocoldescribedinCERM-PACES(2013).The typeofaquiferintersectedbyeachsampledwell,i.e.,eitherbedrock(n=60)orQuaternarydeposits (n=53),andthewelldepthweredeterminedusingdatafromdrillingreports.Insitufield measure-mentswereconductedfor severalparameters suchastemperature(T),pH,redox potential(Eh), dissolvedoxygen(DO)andtotaldissolvedsolids(TDS).Groundwatersampleswereanalyzedfor39 parameters(Table1)includingmajor,minor,sometraceandinorganicconstituents,plusthestable isotopesdeuterium2Hand 18O.Theion-balanceerrorwascalculated inordertoverifythe elec-troneutralityofthesamples.Basedonthisdata,105samplesoutofthe113samplescollectedwere selectedforstatisticalanalysis(8sampleswererejectedastheypresentedanion-balanceerrorabove ±10%).
4.2. Graphicalanalysis
Twographicalmethodsareusedtosortgroundwatergeochemistrysamplesintogroups:theDurov diagram(Durov,1948)andtheStiffdiagram(Stiff,1951),usingthesoftwareAquachem5.0(Waterloo HydrogeologicInc.,2005).
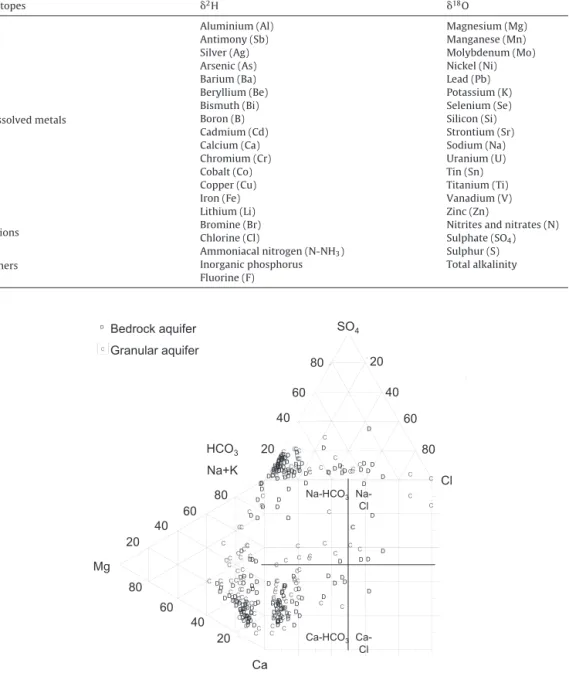
TheDurovdiagramdisplaystherelativeconcentrationsofthemajorcationsandanionsontwo separatetrilinearplotstogetherwithacentralsquareplotwherethepointsfromthetwotrilinear
Fig.2.Locationofthesamplingsitesindicatingtheaquifertypeintersectedbythesampledwells.
plotsareprojected.Mostofthe105groundwatersamples(Fig.3;Table2)areCa-HCO3watertype (n=80).TheremaininggroundwatersamplesareNa-HCO3 (n=13),Na-Cl(n=11)andCa-Cl(n=1) watertypes.
TheStiffdiagramisapolygoncreatedfromthreeparallelhorizontalaxesextendingoneitherside ofaverticalzeroaxis.Cationsareplottedtotheleftoftheaxisandanionstotheright,inunitsof milliequivalentsperlitre(meq/L)(Güleretal.,2002).TheStiffdiagramallowsavisualcomparisonof waterswithdifferentcharacteristics.Sincethepatterntendstomaintainitsshapeuponconcentration ordilution,theStiffdiagramalsoallowsthetracingofflowpaths(Güleretal.,2002).TheStiffdiagram isparticularlyusefulforcomparingresultsfrommanysamplesincombinationwithamultivariate statisticalanalysis,aspresentedbelow.
Table1
Chemicalparametersanalyzedinthelaboratory.
Isotopes ␦2H ␦18O
Dissolvedmetals
Aluminium(Al) Magnesium(Mg)
Antimony(Sb) Manganese(Mn)
Silver(Ag) Molybdenum(Mo)
Arsenic(As) Nickel(Ni)
Barium(Ba) Lead(Pb)
Beryllium(Be) Potassium(K)
Bismuth(Bi) Selenium(Se)
Boron(B) Silicon(Si)
Cadmium(Cd) Strontium(Sr)
Calcium(Ca) Sodium(Na)
Chromium(Cr) Uranium(U)
Cobalt(Co) Tin(Sn)
Copper(Cu) Titanium(Ti)
Iron(Fe) Vanadium(V)
Lithium(Li) Zinc(Zn)
Anions BromineChlorine(Br)(Cl) NitritesSulphateand(SOnitrates(N)
4) Others
Ammoniacalnitrogen(N-NH3) Sulphur(S)
Inorganicphosphorus Totalalkalinity
Fluorine(F)
Fig.3. Durovdiagramofthe105groundwatersampleslabelledaccordingtotheaquifertype.Thecentralsquareplotofthe Durovdiagramisdividedintofoursquarestoidentifythemaingroundwatertypes.
Table2
Numberofgroundwatersamplesfrombedrockaquifersandfromgranularaquifersforeachwatertype.
Ca-HCO3 Na-HCO3 Ca-Cl Na-Cl
R 48 8 1 5
G 32 5 0 6
Table3
Parametersexcludedforthemultivariatestatisticalanalysis.
Parametersexcluded Reasonfortheexclusion
EC,TDS,pH,Eh Parameterswithadditivecharacteristics
Temperature Physicalparameter
DO,␦2H,␦18O Parameterswithlowregionalvariations
Totalalkalinity ParameterlinkedtoHCO3−concentration
Al,Sb,Ag,As,Ba,Be,Bi,B,Cd,Cr,Co,Cu,Sn,Fe,Li,Mn, Mo,Ni,Pb,Se,U,Ti,V,Zn,N-NH3,Br,F,N,P
Parameterswithmorethan15%ofthesamplesbelow thedetectionlimit
Table4
Descriptivestatisticsforthe105groundwatersamples(concentrationsinmg/L).
Parameter Mean(x) Median Minimum Maximum Standarddeviation(s) Skewness
Ca2+ 18.673 16.000 1.700 110.000 17.276 2.712 Mg2+ 3.165 2.100 0.200 25.000 3.698 3.839 K+ 1.676 0.850 0.055 13.000 2.074 2.916 Si4+ 6.494 5.900 0.220 16.000 2.446 1.188 Sr2+ 0.190 0.095 0.013 2.600 0.383 5.076 Na+ 23.815 5.200 1.000 540.000 63.322 5.961 HCO3− 81.786 62.220 3.660 634.400 85.622 3.712 Cl− 25.418 2.700 0.300 550.000 73.658 4.887 SO4− 8.037 5.000 0.275 150.000 15.322 7.925
4.3. Datapreparationforthemultivariatestatisticalanalysis
Themultivariatestatisticalanalysisisanapproachtogroundwaterclassificationthatallowsthe definitionofdistinctgroupsofgroundwatersamples,aswellascorrelationsbetweenchemical param-etersandgroundwatersamples(Cloutieretal.,2008).Thehierarchicalclusteranalysis(HCA)and theR-modefactoranalysisinprincipalcomponents(RFA)areappliedhereusingthesoftware Sta-tisticaversion12(StatsoftInc.,2013).Thedatapreparationformultivariatestatisticalanalysisis based ontheapproach usedby Cloutieretal.(2008); severalparameterswere excludedforthe analysis,asexplainedinTable3(Sanfordetal.,1993).Themultivariatestatisticalanalysisisthus appliedtoasubgroupofthecompletehydrogeochemicaldataset.Thedatasetusedinthisanalysis constitutesadatamatrixof105samplingsites(observations)byninechemicalparameters (vari-ables).ThenineselectedparametersincludethemajorconstituentsCa2+,Mg2+,Na+,K+,HCO
3−,Cl−, SO42−andtheminorconstituentsSr2+andSi4+.Forthemultivariatestatisticalanalysis, concentra-tionvalueslowerthanthedetectionlimitweresetat0.55timesthedetectionlimit(Güleretal., 2002).
Allthe parameters except Si4+ are highly positivelyskewed and theirfrequency distribution inmg/Ldoesnotfollow anormaldistribution(Table4).Thus, eachchemicalparameterwas log-transformed exceptSi4+.Allthevariables were thenstandardized totheir standardscores Zias follows:
Zi= (xi−x)
s (1)
whereZ=standardscoreofthesamplei,xi=valueofsamplei,x=meanands=standarddeviation (Davis,1986).Thestandardizationisappliedtoensurethateachvariablehasequalweightinthe statisticalanalyses.
4.4. Hierarchicalclusteranalysis
Hierarchicalclusteranalysis(HCA)isthemostwidelyappliedclusteringtechniqueinEarth Sci-encesandisoftenusedfortheclassificationofhydrogeochemicaldata(Cloutieretal.,2008).The
agglomerativeprocedurestartswithasmanyclustersasobjects(orindividuals).Theclustersare thensuccessivelymerged,accordingtotheirsimilarity,untilonlyoneremains(Templetal.,2008). Thisagglomerativeprocedureallowstoclassifylargeamountsofhydrogeochemicaldataintoseveral groups basedonspecificcharacteristics(Lambrakisetal.,2004).In thisstudy,theEuclidean dis-tancewaschosenasthedistanceorsimilaritymeasurebetweensamplingsites,incombinationwith Ward’smethod(Ward,1963)asthelinkagerule,whichmergesclusterswithaminimum informa-tionlosscriteriabasedonsumsofsquares(Templetal.,2008).Güleretal.(2002)havesuggested thatusingEuclideandistanceasthesimilaritymeasure,togetherwithWard’smethodasthelinkage rule,producesthemostdistinctivegroups.AnumberofotherstudieshavealsousedWard’smethod asthelinkagerule(Lambrakisetal.,2004;Cloutieretal.,2008;Templetal.,2008).Thelevelsof similarityatwhichobservationsarejoinedareusedtoconstructatreediagram,oradendrogram (Davis,1986).Avisualobservationofthedendrogramallowsthegroupingofsamplesintoclusters. Thecharacteristicsofeachclustercanbedeterminedusingdescriptivestatisticsandgraphical meth-ods.Therelationsbetweentheclusterscanbeinterpretedincorrelationwiththehydrogeologicaland geologicalcontexts.
TheHCAwascarriedoutusingtheclusteranalysismoduleintheMultivariateExploratory Tech-niquesoftheStatisticasoftwareversion12.0.Theinputfilecontainstherawdataconsistingof105rows (samples)by9columns(chemicalparameters).Theclusteringofcases(rows)wasselectedtocluster thesamples,whiletheclusteringofvariables(columns)wasusedtoclusterchemicalparameters. Joining(treeclustering)wasselectedastheclusteringmethod.
4.5. R-modefactoranalysis(RFA)
TheR-modefactoranalysis(RFA)isamultivariatestatisticaltechniqueusedfordatareduction andfordecipheringpatternswithinlargesetsofdata(Farnhametal.,2003).Oncethepatternof the datasetis determined,it maybe compressedby reducing thenumber of dimensions, with-out losing significant information. With RFA, the data matrix is reduced to factor scores and loadings. Acorrelationmatrix isgenerally usedsothateach variableis normalizedtounit vari-ance and therefore contributes equally tothefactor analysis(Farnham etal., 2003; Chenet al., 2007).
Theextractionoffactorswasconductedonasymmetricalcorrelationmatrixcomputedforthe ninevariables.ThisistheR-modetechnique,usedtoinferrelationshipsbetweenvariables(Davis, 1986).Factorsare thuscalculated sothat theytakeinto accountthecorrelations present inthe originaldata,butareuncorrelated tooneanother.Thefirstfactorexplainsthelargestportionof thevarianceoftheoriginaldata,andeachsubsequentfactorexplainsprogressivelyless(Farnham etal.,2003).Thedatacanbereducedtotwoorthreefactorsexplainingthemajorityofthe vari-ancewithintheoriginaldataset(Farnhametal.,2003;Chenetal.,2007),andarotationfactorcan beappliedtomaximizethevarianceoftheretainedfactors.Inthisstudy,thenumberoffactorsto bekeptwasbasedontheKaisercriterion,whichselectsonlythefactorswitheigenvaluesgreater than1(Cloutieretal.,2008).ThemethodusedwastheVarimaxnormalizedrotation,asinthe anal-ysesconductedbyMelloulandCollin(1992),Cloutieretal.(2008)andMontcoudioletal.(2014). Theloadingswerethenevaluatedtoidentifytheelementsthatareresponsibleforthese correla-tions.Elementswiththegreatestpositiveandnegativeloadingsmakethelargestcontribution.The loadingscanthereforebeexaminedtoprovidefurtherinsightintotheprocessesthatare respon-sibleforthevariation ingroundwatergeochemistry(Farnhametal.,2003).Thefactor scoresfor eachgroundwatersamplecanalsobeplotted andtheplotsinspectedforsimilarities(Chenetal., 2007).
TheRFAwascarriedoutusingtheFactorAnalysismoduleintheMultivariateExploratory Tech-niquesof Statisticaversion12.0. TheinputfiledatasetisthesameasfortheHCA.Theprincipal componentsareselectedbased ontheextractionmethodandtheminimumeigenvalueis setto 1, according to the Kaiser criterion. Varimax normalized is finally selected as the rotation fac-tor.
Fig.4.DendrogramandStiffdiagramsresultingfromtheHCAforthe105groundwatersamples,showingthedistributionof
thesesamplesintofourclusters,eachhavingitsowncharacteristicwatertype.Foreachclusterarealsoshownatthe“Elevated
conc.”linethoseminorandtraceconstituentsforwhichtherewasthehighestmeasuredconcentration.Stiffdiagramsare
constructedbasedonthemedianvaluescalculatedforeachcluster.
5. Results
5.1. Hierarchicalclusteranalysis(HCA)
Theclassificationofthesamplesintoclustersisbasedonavisualinspectionofthedendrogram (Fig.4).Bymovingthepositionofthephenon-lineupordownonthedendrogram,onecandefinea greateroralessernumberofclusters(Güleretal.,2002).Inthisstudy,thephenon-linewasdrawn acrossthedendrogramatalinkagedistanceof15.Sampleswithalinkagedistancelowerthan15 arethusgroupedintothesamecluster.Thisallowsadivisionofthedendrogramintofourclustersof groundwatersamples.
Table5
Geochemicalandphysicalcharacteristicsofeachcluster(medianconcentrationsinmg/L).
Parameters Cluster1 Cluster2 Cluster3 Cluster4
N N=22 N=38 N=24 N=21
ChemicalparametersusedintheHCA
Ca2+ 4.90 15.50 19.00 29.00 Mg2+ 1.05 1.75 3.15 6.80 Na+ 2.20 4.85 4.95 56.00 K+ 0.60 0.60 1.35 3.20 HCO3− 21.35 54.90 73.81 146.40 Cl− 0.90 2.55 2.35 52.00 SO42− 1.65 5.00 7.00 10.00 Si4+ 6.15 5.25 7.15 6.50 Sr2+ 0.03 0.09 0.16 0.24
Otherchemicalparameters
Ba2+ 0.00 0.00 0.00 0.02 B3+ 0.01 0.01 0.01 0.05 Cu2+ 0.00 0.00 0.00 0.00 Mn2+ 0.00 0.00 0.00 0.02 Mo2+ 0.00 0.00 0.00 0.00 Pb2+ 0.00 0.00 0.00 0.00 Zn2+ 0.01 0.00 0.01 0.01 Totalalkalinity 17.50 45.00 60.50 120.00 N-NH3 0.01 0.02 0.03 0.06 F− 0.06 0.20 0.10 0.40 Stableisotopes ␦2H(VSMOW) −84.17 −87.24 −90.13 −86.29 ␦18O(VSMOW) −12.01 −12.35 −12.77 −12.25 Physicalparameters Temperature(◦C) 8.94 7.68 7.35 7.63 pH 6.19 7.63 7.26 7.61 DissolvedO2 8.31 3.65 0.63 0.00 TDS 24.50 61.00 71.50 215.00 Welldepth(m) 2.75 65.00 45.50 54.00
N,numberofsamples;boldvalues:highestvalues;underlinedvalues:lowestvalues.
Thedendrograminspectionprovidessomeindicationofthelevelofsimilaritybetweenthefour clusters(Fig.4).ThelinkagedistancebetweenCluster4andthethreeotherclustersiselevated(61), whichindicatesthatgroundwatersamplesinCluster4areclearlyandgeochemicallydistinctfrom thegroundwatersamplesofthethreeotherclusters.Amongthesethreeclusters,Cluster1istheleast similarwithahighlinkagedistance(43)toCluster2andCluster3.Cluster2andCluster3havethe lowestlinkagedistance(16)ofthefourclustersandhavethegreatestsimilarityamongallclusters.It canthereforebeexpectedthatthegeochemistryofthegroundwatersamplesofCluster2andCluster 3wouldpresentsomesimilarity.
Toevaluatethecharacteristicsofeachclusterofgroundwatersamples,Table5presentsthemedian valuesofgeochemicalandphysicaldata,includingthe9chemicalparametersusedintheHCA,aswell as10minorandtraceconstituents,stableisotopes␦2Hand␦18O,temperature,pH,dissolvedoxygen, TDSandwelldepth.Only10ofthe30otherminorandtraceconstituentsanalyzedinthelaboratoryare includedinthistablebecausethemedianconcentrationsoftheremainingconstituentsareidentical foreachclusterofsamplesand,therefore,appearirrelevanttoourstudy.Minorandtraceconstituents withelevatedmedianconcentrationsareindicatedinFig.4.Stiffdiagramsforeachclusterbasedon themedianvaluescalculatedforeachclusterarealsopresentedinFig.4.StiffdiagramsforCluster1, Cluster2andCluster3haveasimilarshapewithCa2+andHCO
3−asthedominantions,whereasthe StiffdiagramforCluster4showsadistinctiveshape,withNa+,HCO
3−andCl−asthedominantions. Table6presentsthenumberofCa-HCO3,Na-HCO3,Ca-ClandNa-Clwatertypesamplesfrombedrock aquifersandfromgranularaquifersforeachcluster,basedonthepreviousinspectionoftheDurov diagram.
Table6
NumberofgroundwatersamplesineachclusterofCa-HCO3,Na-HCO3,Ca-Cl,andNa-Clwatertypes,frombedrockaquifersand
fromgranularaquifers.
Cluster1 Cluster2 Cluster3 Cluster4
R G R G R G R G Ca-HCO3 1 16 22 8 16 7 9 1 Na-HCO3 0 3 3 2 0 1 2 2 Ca-Cl 0 0 1 0 0 0 0 0 Na-Cl 0 2 0 2 0 0 5 2 Total 1 21 26 12 16 8 16 5
R,bedrockaquifer;G,granularaquifer. Table7
FactorloadingsandexplainedvarianceforthethreefactorswithVarimaxnormalizedrotation.
Parameters Factor1 Factor2 Factor3
Ca2+ 0.90 0.06 0.15 Mg2+ 0.67 0.45 0.42 K+ 0.17 0.85 0.14 Si4+ 0.10 0.04 0.96 Sr2+ 0.86 0.23 0.09 Na+ 0.29 0.90 -0.03 HCO3− 0.76 0.39 0.08 Cl− 0.28 0.88 0.02 SO42− 0.68 0.39 -0.20 Explainedvariance 3.23 2.86 1.20 Explainedvariance(%) 0.36 0.32 0.13 Cumulative%ofvariance 0.36 0.68 0.81
Boldvalues:loadings>0.67.
TheCluster1samples(n=22)aremainlyoftheCa-HCO3 watertypeandarecharacterizedby elevatedconcentrationsofPb2+,Zn2+anddissolvedoxygen.TheCluster1samplesalsohavethelowest pHandthelowestTDSvaluesofallclusters.TheCluster2samples(n=38)aremainlyofthe (Ca-Na)-HCO3 watertypeandarecharacterizedbyelevatedconcentrationsofCu2+,andbythelowest concentrationsofSi4+ofallclusters.TheCluster3samples(n=24)areoftheCa-HCO
3watertypeand arecharacterizedbythehighestconcentrationsofSi4+ofalltheclusters.TheCluster2andCluster3 samplesshowanumberofsimilarities,includingtheTDSmedianvalue,buttheCluster3sampleshave higherconcentrationsofMg2+,K+,HCO
32−,andSr2−thanCluster2samples.TheCluster4samples (n=21)areoftheNa-(HCO3-Cl)watertypeandarecharacterizedbyelevatedconcentrationsofBa2+, B3+,Mn2+,Mo2+,N-NH
3andF−,aswellasthelowestconcentrationsofCu2+anddissolvedoxygenof allclusters,andthehighestTDSvaluesofallclusters.Ninety-fivepercentofCluster1groundwater samplesarefromshallowgranularaquifers,whereas76%ofCluster4groundwatersamplesarefrom deeperbedrockaquifers.TheCluster2andCluster3samplescontaingroundwaterfrombothshallow anddeep,granularandbedrockaquifers.
5.2. R-modefactoranalysis(RFA)
TheRFAallowedtheextractionofninefactors.Onlythefirstthreefactorshaveeigenvaluesgreater than1;aVarimaxnormalizedfactorrotationwasappliedinordertomaximizethevariance.The firstthreefactorsaccountfor81%ofthetotalvarianceinthedataset.Thefactorloadingsforthefirst threefactorsandtheirrespectiveexplainedvariancearepresentedinTable7.Thefirsttwofactors, respectively,explain35.9%and31.8%ofthevariance,andthereforeexplainmostofthevariancein thedataset,whilefactor3explains13.3%ofthevarianceinthedataset.
Fig.5showsthepositionoftheloadingsofchemicalparametersinaplanedefinedbytheaxesof Factors1and2(a),andinaplanedefinedbytheaxesofFactors1and3(b).Theseplotshelptoidentify whichchemicalparametersareassociatedwitheachfactor.Factor1explainsthegreatestamountof
Fig.5. PlotoftheloadingsforFactor1andFactor2(a)andforFactor1andFactor3(b)withVarimaxnormalizedrotation.
PlotofthefactorscoresforFactor1andFactor2(c)andforFactor1andFactor3(d)withthegroundwatersampleslabelled
accordingtotheirrespectiveclusters.
thevariance,andischaracterizedbyhighlypositiveloadingsinCa2+,Sr2+andHCO
3−.Theloadingis alsohighforSO42−andMg2+(Fig.5a).BecauseoftheassociationofCa2+andMg2+,Factor1isdefined asthe«hardness»factor(Cloutieretal.,2008).Factor2ischaracterizedbyhighlypositiveloadingsin Na+,Cl−andK+(Fig.5a).Factor2isthusdefinedasthe«salinity»factor.Factor3ischaracterizedbya veryhighlypositiveloadinginSi4+(Fig.5b).
RFAresultsareconsistentwiththeHCAresults,asillustratedinFig.5.Thefactorscoresrepresent theinfluenceofthefactoronthegroundwatersamples(Cloutieretal.,2008).Thedistinctionbetween clustersofsamplesisclearwhenplottingscoresforFactor1versusFactor2(Fig.5c).Cluster1samples arelocatedonthemiddle-leftsideoftheplot,whereasCluster4samplesarelocatedontheupperright side.Cluster2andCluster3samplesarelocatedinthemiddleoftheplotandcannotbedifferentiated accordingtothesefactors.ThedistinctionofCluster2andCluster3samplesishoweverpossible whenplottingscoresforFactor1versusFactor3(Fig.5d).Cluster1samplesarecharacterizedby mediumtohighnegativescoresforFactor1,lownegativescoresforFactor2,andmediumnegativeto highpositivescoresforFactor3.MostCluster2samplesarecharacterizedbylowpositivescoresfor
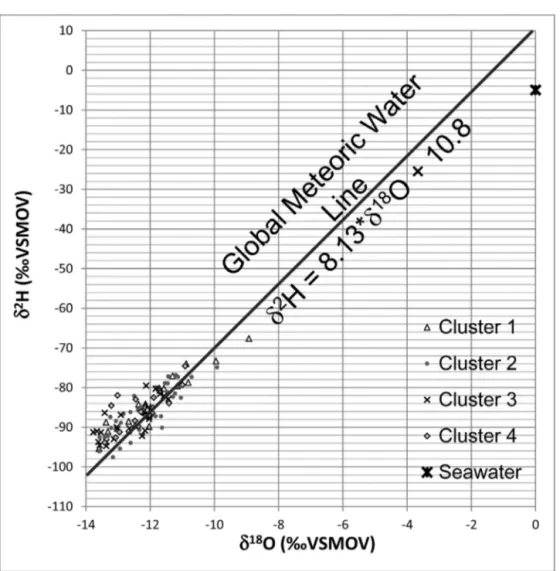
Fig.6. Plotof␦18OVSMOWversus␦2HVSMOW,withthegroundwatersampleslabelledaccordingtotheirrespectivecluster.
TheGlobalMeteoricWaterLineandtheisotopiccompositionofseawaterareindicated.
Factor1,mediumnegativetolowpositivescoresforFactor2andnegativescoresforFactor3.Some end-membersofCluster2havehighnegativescoresforFactor1incontrasttohighpositivescores forFactor2.Cluster3sampleshavepositivescoresforFactor1andlownegativescoresforFactor2 andlownegativetohighpositivescoresforFactor3.MostofCluster4sampleshavemediumtohigh positivescoresforFactor1andFactor2,andmediumnegativetohighpositivescoresforFactor3.
5.3. Stableisotopesı2Handı18O
ThedistributionofthesamplesinFig.6followstheGlobalMeteoricWaterLine,ascalculated byCraig (1961),towardsseawaterisotopiccomposition (␦2H=−5‰and ␦18O=0‰).Thisreflects mixingbetweenseawaterandmeteoricwater(Walter,2010),andindicatesthatgroundwaterwas notaffectedbyevaporationprocesses.Nodistinctionofisotopiccompositioncanbeobservedbased ontheclusterizationofthesamples.Becauseofthisalignment,wecanstatethatallgroundwater sampledforthisstudyhasacommonorigin,i.e.,itisrechargewatercommonlyfoundintemperate
tocoldclimates.Thecalculationofthemedianvaluesforstableisotopes(Table5),however,allowsa distinctionsincetheCluster3samplesareslightlyenrichedin␦2H.
6. Interpretationanddiscussion
HCAallowsgroupingthe105groundwatersamplesintofourclusters.TheTDSvaluesincreasefrom Cluster1toCluster4(Table5)andtheoppositeisobservedregardingtheconcentrationindissolved oxygen.TheCluster1groundwatersampleshaveamoreacidicpHthanthegroundwatersamples ofthethreeotherclusters,andtheirtemperatureisthehighest.Table6indicatesthattheCluster1 samplesaremainlyCa-HCO3watertypeandcomefromshallowgranularaquifers(95%).TheCluster2 samplesaremainly(Ca-Na)-HCO3watertypeandcomefrombothshallowanddeep,granular(31.6%) andbedrockaquifers(68.4%).TheCluster3samplesareCa-HCO3watertypeandalsocomefromboth shallowanddeep,granular(33.3%)andbedrockaquifers(66.7%).TheCluster4samplesareNa-(HCO3 -Cl)watertypeandcomefromdeeperbedrockaquifers(76.2%).Theseobservationsindicatethatthe fourclustersaregeochemicallydistinctgroupsofgroundwatersamples,whichwerecollectedfrom differenthydrogeologicalcontexts,suggestingarelationshipbetweengroundwaterchemistryandthe hydrogeologicalcontext.
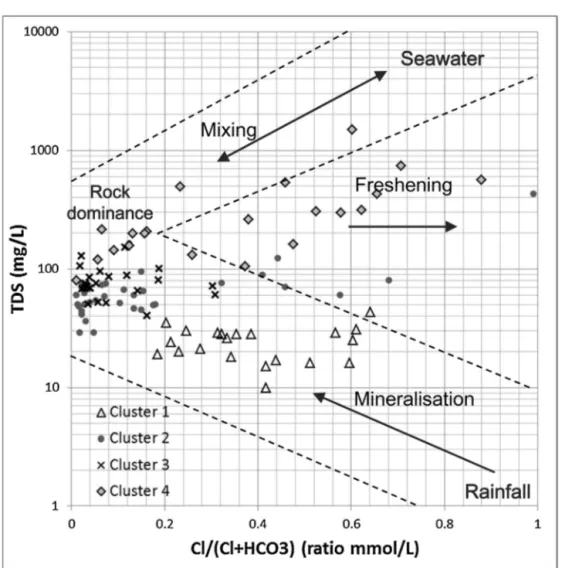
AGibbsdiagram(Gibbs,1970)ispresentedinFig.7,plottingtheTDSconcentrationasafunction oftheratiobetweenClandCl+HCO3withthesampleslabelledaccordingtotheirrespectivecluster. SincetheTDSconcentrationincreasesfromCluster1toCluster4,thefourclustersareeasily dis-tinguishable.Allthegroundwatersamplesmainlyfallinthedomaininfluencedbythegeology.The Cluster1samplesfallclosertorainwaterthanthesamplesintheotherclusters,whichisconsistent withthepreviousobservations(Table5).ThegroundwatersamplesofCluster1couldthus corre-spondtolow-salinityandrecentlyinfiltratedwatersinrechargeareas(Frapeetal.,1984;Gascoyne andKamineni,1994).ElevatedconcentrationsinPb2+andZn2+forCluster1samplescomparedtothe threeotherclustersareunexplained.TheCluster2andCluster3samplesaremoreinfluencedbythe water–rockinteractionsandfresheninghasaffectedsomeoftheCluster2samples.Thesesamples couldcorrespondtomixedorintermediatewatertypesfromgranularandbedrockaquifers(Frape etal.,1984;RajmohanandElango,2004;Subramanietal.,2010).Thislastobservationhighlightsthe possibilityofhydraulicconnectionsbetweentheCanadianShieldbedrockandthegranulardeposits asrecentlydemonstratedbyChesnauxetal.(2012)andRichardetal.(2014).TheCluster4samples wouldthereforecorrespondtomoresalineandprobablymorematurewaterfrombedrockaquifers (Frapeetal.,1984;GascoyneandKamineni,1994).Thesesamplescanbedividedintotwosubgroups: onesubgroupofsamplesinfluencedbythewater–rockinteractionsandonesubgroupofsamples correspondingtomixturesbetweenseawaterandwaterundergoingsomefreshening(Fig.7).These lastsamplesmainlycorrespondtoNa-Clgroundwatertype,whichcouldbetheresultofthe natu-ralevolutionofgroundwateralongitsflowpathandcorrespondingtoancientgroundwater(Frape etal.,1984;GascoyneandKamineni,1994).Thisgroundwatertypecouldalsoresultfromnumerous groundwatersalinizationprocessessuchassolutediffusionfromamarineclayaquitardorsaltwater intrusion(Cloutieretal.,2008;Beaudry,2013;Montcoudioletal.,2014).
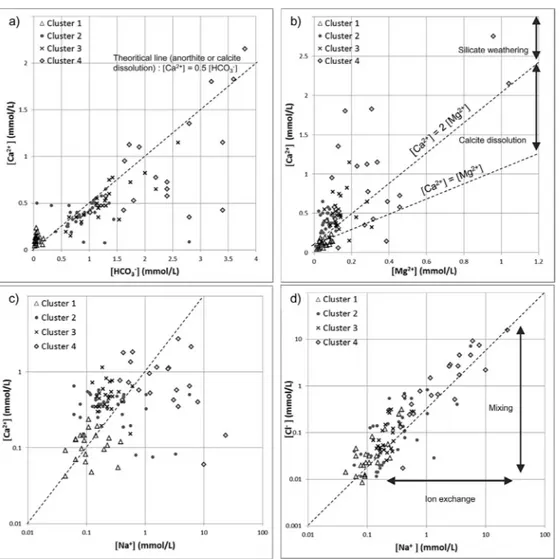
Fig.8ashowsHCO3−andCa2+enrichmentfromCluster1toCluster4byplottingHCO3− concentra-tionversusCa2+concentrationwiththegroundwatersampleslabelledaccordingtotheirrespective clusters.Cluster1samplesarecharacterizedbythelowestHCO3−andCa2+concentrations.Cluster2, Cluster3andCluster4samplesarecharacterizedbyenrichmentinCa2+andHCO
3−.Thedistribution oftheCluster2andCluster3samplesfollowsthetheoreticallineofcalciteandanorthitedissolution (Montcoudioletal.,2014).Ca-richmineraldissolutioncanthusbeproposedastheprimaryprocess ofCa2+andHCO
32− enrichmentforCluster2andCluster3samples(RajmohanandElango,2004; Subramanietal.,2010;Montcoudioletal.,2014).TheweatheringofCa-richsilicatesandthe cal-citedissolution(Eqs.(2)and(3);AppeloandPostma,2005)arepresentedasaconsistentprocessof Ca2+andHCO
3−enrichmentofthegroundwater,sincethebasementofthestudyareaismadeupof charnockiticgneiss,graniteandanorthosite,butalsolimestoneintheareasurroundingthemeteor crater(Lemieuxetal.,2003).
Fig.7. GibbsdiagramplottingtheTDSconcentrationasafunctionoftheratiobetweenClandCl+HCO3withthesamples
labelledaccordingtotheirrespectiveclusters.Themainprocessesaffectingeachclusterofgroundwatersamplesaredetermined
accordingtotheClandHCO3ratio.
CO2+H2O+CaCO3(calcite) =Ca2++2HCO3− (3)
Thesechemicalreactions(Eqs.(2)and(3))areconsistentwiththeRFAresultswhichshowahigh loadingforsilicaonthethirdfactor,furthersuggestingtheimportanceofsilicateweathering.Thisis alsoconsistentwiththeCluster2andCluster3samplesinfluencedbythewater–rockinteractions basedontheGibbsdiagrams.Inthisstudy,thedissolutionofanorthiteispresentedastheprimary processofCa2+andHCO
3−enrichmentbecausethissilicatemineraliseasilydissolved(Montcoudiol etal.,2014).InFig.8b,mostofthegroundwatersamplesplotabovethe[Ca2+]=2[Mg2+]line,indicating thatsilicateweatheringdominatesovercarbonatedissolution(RajmohanandElango,2004).However, someoftheCluster3andCluster4samplesplotbelowthisline,indicatingthatthedissolutionofcalcite couldalsobeaprocessofCa2+andHCO
3−enrichmentforsomeoftheseclustersamples(Rajmohan andElango,2004;Subramanietal.,2010;Montcoudioletal.,2014).
InFig.8c,thesamplesfromCluster1toCluster4mainlyshowanenrichmentinCa2+andNa+ concentrationswhichcouldbeexplainedbysilicateweathering(notonlyCa-richminerals)andcalcite dissolution(Montcoudioletal.,2014).SomeoftheCluster2andCluster4samplesshowhighNa+
Fig.8.PlotofHCO3−concentrationversusCa2+concentration(a),Mg2+concentrationversusCa2+concentration(b),Na+
con-centrationversusCa2+concentration(c)andNa+concentrationversusCl−concentration(d),withthegroundwatersamples
labelledaccordingtotheirrespectiveclusters.ThelinearrelationshipbetweenCa2+andHCO
3−(a)andthecomparisonbetween
Ca2+andMg2+(b)areevidenceofCa-silicateweatheringandcalcitedissolution.IndicationsofCa2+/Na+ionexchangeare
pro-videdbyadecreaseinCa2+concentration(c)ortoconstantCl−concentrationsandenrichmentinNa+(d)mainlyfortheCluster
2andCluster4samplescomparedtotheothersamples.EnrichmentinCl−andconstantNa+concentrationssuggestamixing
process(d).
concentrationsassociatedwithalowerCa2+concentrationthantheothersamples.Thesesamples appeartobemixturesinfluencedbyionexchange(Fig.8d).Theprocessofionexchangeisknown toexplainthedeficitofcalciumversussodiumingroundwater(AppeloandPostma,2005).Based ontheRFAresults(Fig.5),thesesamplesarecharacterizedbynegativescoresforhardness(Factor 1)incontrasttopositivescoresforsalinity(Factor2)whichisconsistentwiththeoccurrenceofion exchange.TheCluster1,Cluster3andCluster4samplesmainlyfollowtheseawaterdilutionline buttheCluster2samplesaremorerandomlydistributed, reflectingsignificantion exchangeand mixing(Fig.8d).TheshapeoftheStiffdiagramforCluster4samplesischaracterizedbyhigherNa concentrations(Fig.4).ThiscouldbeexplainedbygroundwaterNa-enrichment(Cloutieretal.,2008;
Fig.9.Regionaldistributionofthe105groundwatersampleswiththesampleslabelledaccordingtotheirrespectiveclusters
andthegeologicalcontext.C1:Cluster1;C2:Cluster2;C3:Cluster3andC4:Cluster4.
Walter,2010;Montcoudioletal.,2014)relatedtocationexchangeofNa+byCa2+accordingtoEq.(4) (GascoyneandKamineni,1994):
Ca2++2Na-X(s) =2Na++Ca-X(s) (4)
TheCluster2samplesarethusinfluencedbyCa-richsilicateweathering,ionexchangeandmixing whiletheCluster3samplesappeartobemoreaffectedbyCa-richsilicateweatheringandcalcite dissolution.
ThegeographicallocationoftheclustersispresentedinFig.9.TheCluster2samplescollectedfrom granularaquifersarelocatedintheHaute-Côte-Nord,andontheislandIsle-aux-Coudres,whereasthe samplesfrombedrockaquifersaremainlylocatedintheCharlevoixsubregion,intheareasurrounding
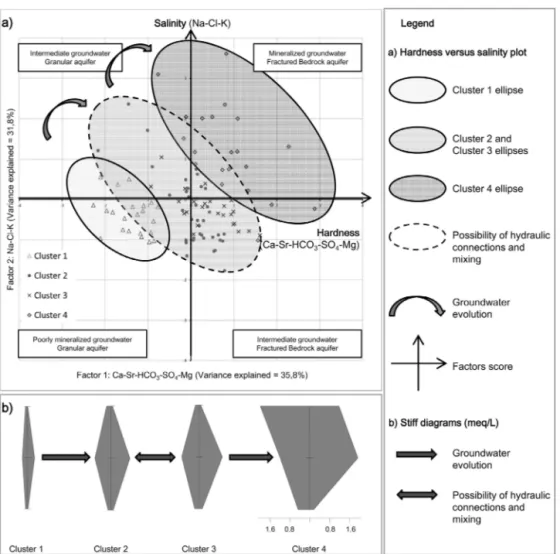
Fig.10.Evolutionofgroundwaterhydrogeochemistry.PlotofthefactorscoresforFactor1andFactor2withthesamples
labelledaccordingtotheirrespectiveclusters(a),andStiffdiagramsshowingtherelationshipbetweentheclustersandthe
groundwatergroups’evolution(b).GroundwaterofCluster1correspondstorechargegroundwaterandevolvesalongitsflow
pathintoCluster2andCluster3affectedbypossiblehydraulicconnections.Cluster2andCluster3groundwatersthenevolve
intoCluster4groundwaterpresentindischargeareas.
themeteorcrater.AsimilarobservationcanbemaderegardingtheCluster3samples:thesamples fromgranularaquifersarelocatedintheHaute-Côte-Nordandthesamplesfrombedrockaquifers aremainlylocatedintheCharlevoixsubregion.SincetheCluster4samplesarelocatedalongthe St.LawrenceRiverandtheSaguenaycoastwhereglaciomarinesilty-sandsandclaysweredeposited duringtheGoldthwaitSeaepisode14,000BP(Cousineauetal.,2014),solutediffusionfrommarine clayorsaltwaterintrusioncanalsobeproposedasprocessesofgroundwatersalinization(Cloutier etal.,2008;Beaudry,2013;Montcoudioletal.,2014).AfirstCluster4subgroupisthuscomposedof groundwaterinfluencedbyCa-richsilicateweatheringandcalcitedissolutionwhileasecondCluster 4subgroupiscomposedofamixturebetweenseawaterandwaterundergoingsomefreshening influ-encedbyionexchange.HigherconcentrationsofSr2+,Ba2+,B3+,Mn2+,Mo2+,andF−intheCluster4 samplessuggestamoreintensivealterationofthebedrockminerals.
Finally,Fig.10presentsaplotofthescoresforthefirsttwofactors,hardnessandsalinity,with thesampleslabelledaccordingtotheirrespectivecluster.Thisplotallowsagoodvisualizationof
thevariousgroundwatertypesfoundintheregionofCharlevoixandHaute-Côte-Nord,aswellas insightintothegeochemicalprocessesresponsibleforthesevariations.Thefourclusterscanbe clas-sifiedintoplausiblelevelsofgroundwaterevolutionintheCharlevoixandHaute-Côte-Nordregion. Cluster1representslow-salinityCa-HCO3groundwaterthatcorrespondstorecentlyinfiltratedwater fromsurfacegranularaquifersinrechargeareas.Cluster4Na-(HCO3-Cl)groundwaterismoresaline andcorrespondstomoreevolvedgroundwater.Thisgroundwaterplausiblyoriginatesfromconfined bedrockaquifers,sincetheCluster 4samplesaredistributedalongtheSt.LawrenceRiver,where glaciomarineandmarinesedimentsweredeposited,forminganaquitard.Hardness(Factor1)and salinity(Factor2)haveastrongpositiveinfluenceonmoresalinegroundwatersamplesfrom frac-turedrockaquifersofCluster4.Onthecontrary,thesetwofactorshaveanegativeinfluenceonpoorly mineralizedwatersfromgranularaquifersofCluster1.Asmentionedpreviously,hardness(Factor1) couldbeassociatedwiththeweatheringofanorthiteorwiththedissolutionofcalciteofthesilicate bedrock,butalsowiththegroundwaterrechargeprocess.Salinity(Factor2)couldbeassociatedwith Na+enrichmentprocessessuchasCa2+/Na+ionexchangeandwithnumerousprocessesof ground-watersalinizationsuchassolutediffusionfrommarineclayaquitardsorsaltwaterintrusion(Cloutier etal.,2008;Beaudry,2013;Montcoudioletal.,2014).TheCluster2andCluster3intermediateor mixedgroundwatersamplesarelessstronglyinfluencedbythetwofirstfactorsthantheother clus-tersamples.TheCluster2andCluster3(Ca-Na)-HCO3groundwaterscouldcorrespondtomixedor intermediategroundwaterbetweenCluster1andCluster4frompossiblyinterconnectedgranularand bedrockaquifers(Chesnauxetal.,2012;Richardetal.,2014).TheCluster3samplesaremore influ-encedbyFactor3(Si4+).Thisthirdfactorcouldalsobeassociatedwithsilicateweathering,sincethe studyareaisunderlainbysilicaterocks,asmentionedpreviously.ThisisconsistentwiththeCluster3 sampleshavingthehighestconcentrationsinSi4+ofallclusters.Thefactthatthehydrogeochemical evolutionofgroundwatercanberepresentedintheplaneofFactors1and2confirmstheimportance ofthesetwofactorsdefinedasthe«hardness»andthe«salinity»inthehydrogeochemistryofthe Charlevoix/Haute-Côte-Nordaquifersystem.
7. Conclusion
ThegroundwaterchemistryoftheCharlevoix/Haute-Côte-Nordregionwasstudiedaspartofa regionalhydrogeologicalcharacterizationproject.Groundwatersampleswerecollectedat113sites distributedoverthewholestudyarea,eitherinthebedrock(60sites)orinthesurficialdeposits(53 sites).Anion-balancecalculationledtotheselectionof105samplesfortheanalysis.
Theanalysisofthestableisotopes␦2Hand␦18Osuggeststhatsampledgroundwaterhasacommon origin:rechargewatersinatemperatetocoldclimate.Thisshowsthatthereismixingbetween seawa-terandmeteoricwater.Thehierarchicalclusteranalysisallowedthesortingofthe105samplesinto fourclustersandtodefineaspatialgeochemicalzonationoftheaquifersystem.Thefourclustersare geochemicallydistinctgroupsofgroundwatersamples,andthereappearstobearelationshipbetween thegroundwaterclustersandthehydrogeologicalcontext.TheR-modefactoranalysisallowedthe extractionofninefactors.Thethreefirstfactorsaccountfor81%ofthetotalvarianceinthedataset. Factor1explains35.9%ofthevarianceandischaracterizedbyhighlypositiveloadingsinCa2+,Sr2+, HCO3−,SO42−,andMg2+.Factor2explains31.8%ofthevarianceandischaracterizedbyhighly pos-itiveloadingsinNa+,Cl−andK+.Factors1and2weredefinedas“hardness”and“salinity”factors, respectively.Hardness(Factor1)couldbeassociatedwiththeweatheringofCa-richsilicatesorthe dissolutionofcalcitecontainedinthesilicatebedrock.Salinity(Factor2)couldbeassociatedwith Ca2+/Na+ionexchangeandwithnumerousprocessesofgroundwatersalinizationsuchassolute dif-fusionfrommarineclayaquitardsorsaltwaterintrusion.Factor3explains13.3%ofthevarianceand ischaracterizedbyaveryhighlypositiveloadinginSi4+andcouldalsobeassociatedwiththeCa-rich silicateweathering.
TheintegrationofHCA,RFAandgraphicalanalysisresultsallowedtheclassificationofthefour clustersintoplausiblelevelsofgroundwaterevolutionintheCharlevoixandHaute-Côte-Nordregion. Cluster1low-salinityCa-HCO3groundwatercorrespondstorecentlyinfiltratedwaterfromsurface granularaquifersin rechargeareas.Cluster4 Na-(HCO3-Cl)groundwaterismore salineand cor-respondstomoreevolvedgroundwater.Thisgroundwaterplausiblycomesfromconfinedbedrock
aquifers.Cluster2andCluster3(Ca-Na)-HCO3groundwatercouldcorrespondtomixedor intermedi-ategroundwaterbetweenCluster1andCluster4,frompossiblyinterconnectedgranularandbedrock aquifers.
Thisstudyidentifiedthemainprocessesaffectingthehydrogeochemicalevolutionofgroundwater intheCHCNregionasthefollowing:groundwaterrecharge,water–rockinteractions,ionexchange, solutediffusionfrommarineclayaquitardsorsaltwaterintrusion,butalsohydraulicconnections betweentheCanadianShieldandthegranulardeposits.
TheseresultsareconsistentwithotherstudiescarriedoutinotherregionsoftheCanadianShield, where geological and hydrogeologicalcharacteristics and geologicalhistory, including the latest glaciationandseawaterinvasion,werefoundtobetheprimaryfactorsinfluencingtheevolution ofgroundwatergeochemistry(Cloutieretal.,2008;Beaudry,2013;Montcoudioletal.,2014). How-ever,abetterknowledgeofthehydrogeologicalconditionswouldallowabettercharacterizationof groundwaterchemistryinrelationtothehydrogeologicalcontextandabetteridentificationofthe geochemicalprocessesinfluencingtheevolutionofgroundwaterchemistry.Furtherinvestigations, includingmoredetailedstudiesofthelithologyofthestratigraphicunitsoftheCHCNaquifer sys-temandtheinterpretationofpumpingtestsinordertoidentifyhydraulicconnections,couldsupport therelationshipsbetweengroundwaterchemistryandthehydrogeologicalcontextdiscussedinthis study.Alocalinvestigationandagreateramountofgeochemicalandhydrogeologicaldatacouldallow amappingofgroundwaterrechargeareas.
Conflictofinterest
Theauthorsdeclarethatthereisnoconflictofinterest.
Acknowledgements
ThisprojectwasfundedbytheProgrammed’acquisitiondeconnaissancessurleseaux souter-rainesofQuebec(PACES),withcontributionfromtheQuebecMinistèreduDéveloppementdurable, del’Environnement,delaFauneetdesParcs(MDDEFP),andthethreeregionalmunicipalitiesofthe CHCNregion.Theauthorswouldliketoacknowledgethecontributionstothisreportfromteam mem-bersofthePACES-CHCNproject.Theworkofallstudentsinvolvedintheprojectasfieldassistants, andthecollaborationofthepopulationoftheCHCNregionwerealsogreatlyappreciated.
AppendixA. Supplementarydata
Supplementary data associated with this article can be found, in the online version, at doi:10.1016/j.ejrh.2015.06.004.
References
Appelo,C.A.J.,Postma,D.,2005.Geochemistry,groundwaterandpollution,2nded.Balkema,Leiden,TheNetherlands,pp.668.
Beaudry,C.,(Masterdissertation)2013.Hydrogéochimiedel’aquifèrerocheuxrégionalenMontérégie-est,Québec.INRS,pp.
193.
CERM-PACES,2013.Résultatsduprogrammed’acquisitiondeconnaissancesurleseauxsouterrainesduSaguenay–LacSaint
Jean.Centred’étudessurlesressourcesminérales,UniversitéduQuébecàChicoutimi,pp.332.
Chen,K.,Jiao,J.J.,Huang,J.,Huang,R.,2007.Multivariatestatisticalevaluationoftraceelementsingroundwaterinacoastal
areainShenzhen,China.Environ.Pollut.147(3),771–780.
Chesnaux,R.,Lambert,M.,Walter,J.,Fillastre,U.,Hay,M.,Rouleau,A.,Daigneault,R.,Moisan,A.,Germaneau,D.,2011.
Build-ingageodatabaseformappinghydrogeologicalfeaturesand3Dmodelingofgroundwatersystems:applicationtothe Saguenay–Lac-St.-Jeanregion,Canada.Comput.Geosci.37(11),1870–1882.
Chesnaux,R.,Rafini,S.,Elliott,A.P.,2012.Anumericalinvestigationtoillustratetheconsequencesofhydraulicconnections
betweengranularandfractured-rockaquifers.Hydrogeol.J.20(8),1669–1680.
Cloutier,V.,Lefebvre,R.,Therrien,R.,Savard,M.M.,2008.Multivariatestatisticalanalysisofgeochemicaldataasindicativeof
thehydrogeochemicalevolutionofgroundwaterinasedimentaryrockaquifersystem.J.Hydrol.353(3–4),294–313.
Cousineau,P.A.,Poirier,B.,Brouard,E.,ElAmrani,M.,Roy,D.W.,Walter,J.,Lambert,M.,Lajeunesse,P.,2014.RapportFinalsur
lestravauxdecartographiedesformationssuperficiellesréalisésdanslesterritoiresmunicipalisésdelaHaute-Côte-Nord etdeCharlevoix(Québec)entre2012et2014.ReporttotheMinistèredesRessourcesNaturelles,April2014.,pp.103.
Davis,J.C.,1986.StatisticsandDataanalysisinGeology.JohnWileyandSonsInc.,NewYork,pp.646.
Durov,S.A.,1948.Kiassifikatsiaprirodnykhvodigraficheskoeizobrazhenieikhsostava.Dokl.Akad.NaukSSSR59(1),87–90.
Farnham,I.M.,Johannesson,K.H.,Singh,A.K.,Hodge,V.F.,Stetzenbach,K.J.,2003.Factoranalyticalapproachesforevaluating
groundwatertraceelementchemistrydata.Anal.Chim.Acta490(1–2),123–138.
Frape,S.K.,Fritz,P.,McNutt,R.H.,1984.Water–rockinteractionandchemistryofgroundwatersfromtheCanadianShield.
Geochim.Cosmochim.Acta48,1617–1627.
Gascoyne,M.,Kamineni,D.C.,1994.ThehydrochemistryoffracturedplutonicrocksintheCanadianShield.Appl.Hydrogeol.2,
43–49.
Gibbs,R.J.,1970.Mechanismscontrollingworldwaterchemistry.Science170(3962),1088–1090.
Gouvernement du Québec, 2015a. Programme d’acquisition des connaissances sur les eaux souterraines, Ministère
du Développementdurable, de l’Environnementet dela Lutte contre leschangements climatiques, Available at:
http://www.mddelcc.gouv.qc.ca/eau/souterraines/programmes/fiches/Fiches-PACEScharlevoix.pdf
Gouvernement du Québec, 2015b. Portail Québec, Géographie et Climat. Consulté le 9avril 2015, Available online:
http://www.gouv.qc.ca/fr/LeQuebec/Pages/G%C3%A9ographie.aspx#geologie
Güler,C.,Thyne,G.,2004.HydrologicandgeologicfactorscontrollingsurfaceandgroundwaterchemistryinIndianWells-Owens
Valleyarea,southeasternCalifornia,USA.J.Hydrol.285(1–4),177–198.
Güler,C.,Thyne,G.,McCray,J.,Turner,K.,2002.Evaluationofgraphicalandmultivariatestatisticalmethodsforclassification
ofwaterchemistrydata.Hydrogeol.J.10(4),455–474.
Lambrakis,N.,Antonakos,A.,Panagopoulos,G.,2004.Theuseofmulticomponentstatisticalanalysisinhydrogeological
envi-ronmentalresearch.WaterResour.38(7),1862–1872.
Lemieux,Y.,Tremblay,A.,Lavoie,D.,2000.StratigraphyandstructureoftheSt.LawrenceLowlandintheCharlevoixarea,
Quebec:relationshipstotheimpactcratering.GeologicalSurveyofCanadaReport,CurrentResearch2000-D2,pp.9.
Lemieux,Y.,Tremblay,A.,Lavoie,D.,2003.StructuralanalysisofsupracrustalfaultsintheCharlevoixarea,Quebec:relationto
impactcrateringandtheSt-Laurentfaultsystem.Can.J.EarthSci.40(2),221–235.
Melloul,A.,Collin,M.,1992.The‘principalcomponents’statisticalmethodasacomplementaryapproachtogeochemical
methodsinwaterqualityfactoridentification;applicationtotheCoastalPlainaquiferofIsrael.J.Hydrol.140,49–73.
Montcoudiol,N.,Molson,J.,Lemieux,J.M.,2014.GroundwatergeochemistryoftheOutaouaisRegion(Québec,Canada):a
regional-scalestudy.Hydrogeol.J.,http://dx.doi.org/10.1007/s10040-014-1190-5.
Rajmohan,N.,Elango,L.,2004.Identificationandevolutionofhydrogeochemicalprocessesinthegroundwaterenvironmentin
anareaofthePalarandCheyyarRiverBasins,SouthernIndia.Environ.Geol.46,47–51.
Richard,S.K.,Chesnaux,R.,Rouleau,A.,Morin,R.,Walter,J.,Rafini,S.,2014.Fieldevidenceofhydraulicconnectionsbetween
bedrockaquifersandoverlyinggranularaquifers:examplesfromtheGrenvilleProvinceoftheCanadianShield.Hydrogeol. J.22(8),1889–1904.
Rondot,J.,1968.Nouvelimpactmétéoritiquefossile?Lastructuresemi-circulairedeCharlevoix.Can.J.EarthSci.5,1305–1317.
Rondot,J.,1998.Lesbrèchesd’impactmétéoritiquedeCharlevoix.GouvernementduQuébec.MinistèredesRessources
naturellesreport.,pp.30.
Sanford,R.F.,Pierson,C.T.,Crovelli,R.A.,1993.Anobjectivereplacementmethodforcensoredgeochemicaldata.Math.Geol.25
(1),59–80.
Silva-Filho,E.V.,SobralBarcellos,R.G.,Emblanch,C.,Blavoux,B.,Sella,S.M.,Daniel,M.,Simler,R.,Wasserman,J.C.,2009.
GroundwaterchemicalcharacterizationofaRiodeJaneirocoastalaquifer,SE–Brazil.J.SouthAm.EarthSci.27(1),100–108.
Statsoft,Inc.,2013.STATISTICA(DataAnalysissoftwareSystem),Version12.
StiffJr.,H.A.,1951.Theinterpretationofchemicalwateranalysisbymeansofpatterns.J.Petrol.Technol.3,15–17.
Subramani,T.,Rajmohan,N.,Elango,L.,2010.Groundwatergeochemistryandidentificationofhydrogeochemicalprocessesin
ahardrockregion,SouthernIndia.Environ.Monit.Assess.162(1–4),123–137.
Templ,M.,Filzmoser,P.,Reimann,C.,2008.Clusteranalysisappliedtoregionalgeochemicaldata:problemsandpossibilities.
Appl.Geochem.23(8),2198–2213.
Walter,J.,(Masterdissertation)2010.LeseauxsouterrainesàsalinitéélevéeduSaguenay-LacSaint-Jean,Originesetincidences.
UQAC,pp.177.
Ward,J.H.,1963.Hierarchicalgroupingtooptimizeanobjectivefunction.J.Am.Stat.Assoc.69,236–244.
WaterlooHydrogeologic,Inc.,2005.AQUACHEM(ManagementSoftwareforWaterQualityandGroundwaterSamplingData),
Version5.0.
Yidana,S.M.,2010.Groundwaterclassificationusingmultivariatestatisticalmethods:southernGhana.J.Afr.EarthSci.57(5),