LE CHOIX D'ACTIONS CORRECTIVES EN SUIVI DE
PROJET: UN MODÈLE MULTICRITÈRE D'AIDE À
LA
DÉCISION
mémoire présenté
dans le cadre du programme de maîtrise en Gestion de Projet en vue de l'obtention du grade de maître ès science
PAR © WeiGU
UNIVERSITÉ DU QUÉBEC À RIMOUSKI Service de la bibliothèque
Avertissement
La diffusion de ce mémoire ou de cette thèse se fait dans le respect des droits de son auteur, qui a signé le formulaire « Autorisation de reproduire et de diffuser un rapport, un mémoire ou une thèse ». En signant ce formulaire, l’auteur concède à l’Université du Québec à Rimouski une licence non exclusive d’utilisation et de publication de la totalité ou d’une partie importante de son travail de recherche pour des fins pédagogiques et non commerciales. Plus précisément, l’auteur autorise l’Université du Québec à Rimouski à reproduire, diffuser, prêter, distribuer ou vendre des copies de son travail de recherche à des fins non commerciales sur quelque support que ce soit, y compris l’Internet. Cette licence et cette autorisation n’entraînent pas une renonciation de la part de l’auteur à ses droits moraux ni à ses droits de propriété intellectuelle. Sauf entente contraire, l’auteur conserve la liberté de diffuser et de commercialiser ou non ce travail dont il possède un exemplaire.
Composition du jury:
Farid Ben Hassel, président du jury, UQAR Didier Urli, membre du jury
Bruno Urli, directeur de recherche, UQAR
Malik Touré, examinateur externe, IAE de Lille, Université Lille 1, France
UNIVERSITÉ DU QUÉBEC À RIMOUSKI Service de la bibliothèque
Avertissement
La diffusion de ce mémoire ou de cette thèse se fait dans le respect des droits de son auteur, qui a signé le formulaire « Autorisation de reproduire et de diffuser un rapport, un mémoire ou une thèse ». En signant ce formulaire, l'auteur concède à l'Université du Québec à Rimouski une licence non exclusive d'utilisation et de publication de la totalité ou d'une partie importante de son travail de recherche pour des fins pédagogiques et non commerciales. Plus précisément, l'auteur autorise l'Université du Québec à Rimouski à reproduire, diffuser, prêter, distribuer ou vendre des copies de son travail de recherche à des fins non commerciales sur quelque support que ce soit, y compris l'Internet. Cette licence et cette autorisation n'entraînent pas une renonciation de la part de l'auteur à ses droits moraux ni à ses droits de propriété intellectuelle. Sauf entente contraire, l'auteur conserve la liberté de diffuser et de commercialiser ou non ce travail dont il possède un exemplaire.
A mes parents, A mon épouse, Je dédie ce mémoire.
ACKNOWLEDGEMENT
This mas ter thesis was performed with the help of many people during my life. Before everybody else l acknowledge my professor and friend Bruno Urli for his assistance throughout the working process. Without his help and support, l cannot finish this research. l must say that which l leamed from him is not only the academic knowledge but also the spirit that is called diligence and persistence, which stands for the correct attitudes of our lives.
l must acknowledge my parents and my wife, without your unconditional help and encourage, l cannot get my master degree. Without your loves and patience, l could not go through those perplexing periods.
My thanks, too, to professor Didier Urli, professor Farid Ben Hassel, professor Malik Touré and all the people who gave and are giving supports to me.
Finally, my thanks and my love to my parents, my wife and professor Bruno Urli. Without you, nothing.
RÉSUMÉ
La gestion des risques, la gestion de qualité, la gestion de l'échéancier du projet comme la gestion des coûts sont généralement traitées comme des processus indépendants. Ces dernières années, quelques rares papiers se sont intéresses à l'intégration de ces approches afin de créer une synergie sur la performance des projets. Ces différents travaux se concentrent sur l'intégration de méthodes permettant d'évaluer la performance du projet tant dans la phase de planification que durant le suivi du projet lors de la phase d'exécution. Cependant, faire une bonne évaluation de la performance du projet n'est que la première étape vers un meilleur contrôle du projet. La seconde étape est celle visant à définir et mettre en œuvre, si nécessaire, un ensemble d'actions correctives. Cette dernière étape est énoncée dans le processus de suivi et contrôle de projet mais n'est pas supportée par une modélisation comme si cette gestion des actions correctives était trop contextuelle. De fait, on se base exclusivement sur la valeur des indicateurs de performance du projet (généralement le Schedule Performance Index et le Co st Performance Index) pour décider de prendre des actions correctives et l'évaluation de l'ampleur de ces actions relève du gestionnaire de projet. A notre connaissance, le seul travail qui propose une modélisation de ce processus de gestion des actions correctives est celui de Lipke (2003) qui suggère une approche basée sur un diagramme logique. Notre recherche, de nature instrumentale, va s'inscrire dans cette ligne de pensée et nous nous proposons de développer un modèle d'aide à la gestion des actions correctives. Pour y parvenir, une revue de littérature sur les indicateurs de perfonnance des projets comme sur la gestion des actions correctives sera menée dans un premier temps. Une modélisation originale, permettant de faire un lien entre une analyse multidimensionnelle de la performance du projet et le type de stratégie d'actions correctives est alors proposé et discutée à partir d'un exemple didactique.
Mots clés : choix des actions correctives, méthode multicritère, temps, coût, qualité, suivi de projet, perfonnance du projet.
ABSTRACT
Currently, risk management, quality management and time/cost management are managed as independent processes but recently, sorne exceptional papers focus on the integration of these approaches in order to create synergy on proj ect performance. These works focus on the integration of methods to assess project performance in both planning phase and controlling phase or implementation phase. However, to make a proper assessment of project performance is only the first step towards a better control of the project. The second step is to define and implement, if necessary, a set of corrective actions. The last step is still adopted during the process of project monitor and control, but it is not supported by the model since the corrective actions of the project are depending on the whole project context. In fact, the choice of a corrective action is based on the classical project performance index values (schedule performance index, cost performance index) and the magnitude of the action is generally evaluated by the project manager. Other considerations should be taken into account and to our knowledge, the only work is the model mentioned by Lipke (2003) where he suggested an approach based on the logic diagram. While, this approach cannot provide the 'best' choice among a set of possible corrective actions, in our research, we propose a model to help the project manager in the choice of the corrective actions. To achieve this, a literature review on project performance indicators for the management of corrective actions will be conducted initially. An original model that makes a link between a multidimensional analysis of project performance and type of corrective action strategy will be proposed and discussed by a didactic example.
Key words: corrective actions choice, multicriteria method, time, cost, quality, proj ect monitoring, proj ect performance.
TABLE DES MATIÈRES
ACKNOWLEDGEMENT ... IX
RÉSUMÉ ... XI
ABSTRACT ... XIII
TABLE DES MATIÈRES ............. XV
LISTE DES TABLEAUX ....... XVII
LISTE DES FIGURES ............ XIX
INTRODUCTION GÉNÉRALE ... 1
INTRODUCTION ....... 3
CHAPITRE 1 : PROJECT PERFORMANCE INDICATORS ....... 5
1. INTRODUCTION ... 5
2. EARNED Y ALUE MANAGEMENT ... 6
2.1. INTRODUCTION OF EVM ... 6
2.2. PROJECT TRACKlNG WITHOUT EVM ... 7
2.3. PROJECT TRACKlNG WITH EVM ... 8
2.4. BASIC EARNED Y ALUE TERMINOLOGY ... 10
2.5. EARNED VALUE MANAGEMENT INDICATORS ... 11
2.6. LIMITATIONS OF EYM ... 16
3. EARNED SCHEDULE MANAGEMENT ... 19
3.1. EARNED SCHEDULE CONCEPT ... 19
3.2. EARNED SCHEDULE INDEX ... 21
3.3. EARNED SCHEDULE BENEFITS ... 23
4.1. INTRODUCTION ... 25
4.2. EXPLANATION OF EQM ... 29
4.3. THE MODIFIED EQM (Xu, 2009) ... 31
5. PROJECT CONTROL AND DECISION MAKlNG ... 32
5.1. PROJECTCONTROL ... 32
5.2. PROJECT PERFORMANCE ANALYSIS AND DECISION MAKlNG ... 34
CHAPITRE 2 : THE PROPOSED METHODOLOGY FOR CORRECTIVE ACTIONS MANAGEMENT ... 37
1. THE PROPOSED METHODOLOGY ... 37
2. DIDACTICAL EXAMPLE ... 40
CONCLUSION ....... 59
CONCLUSION GÉNÉRALE ....... 61
ANNEX ... 63
Annex 1: The Principle ofEamed Value ... 63
Annex 2: The Principle ofEamed Schedule ... 64
Annex 3 : Quality f the possible strategies ... 66
Annex 4: Performance indicators of the recovery strategies ... 68
Annex 5: the PROMETHEE method ... 69
LISTE DES TABLEAUX
TABLE 1. QUALITY OF WORK AND QUANTITY OF WORK ... 28
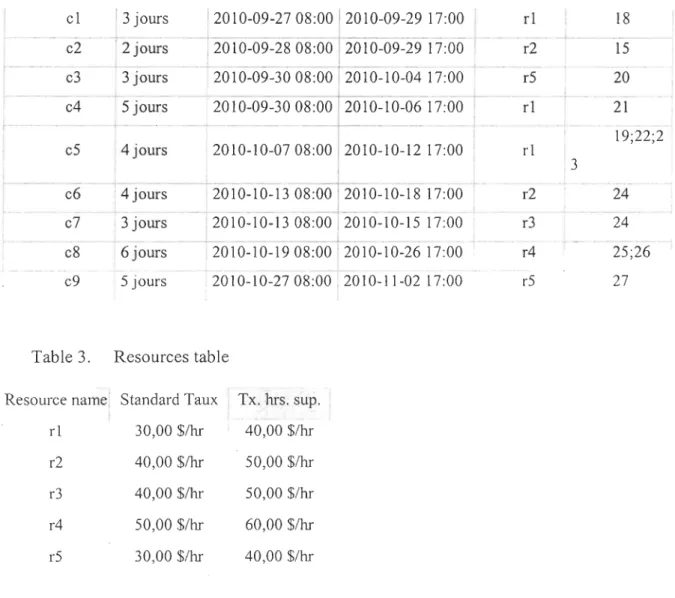
TABLE 2. PROJECT DESCRIPTION ... 40
TABLE 3. RESOURCES TABLE ... 41
TABLE 4. CONTRIBUTIONS OF THE ACTIVITIES TO THE QUALITY CRITERIA ... .41
TABLE 5. PROJECT STATISTICS ... 42
TABLE 6. THE POSSIBLE STRATEGIES ... 48
TABLE 7. EVMIES REPORT OF THE POSSIBLE STRATEGIES ... 48
TABLE 8. QUALlTY fNDICATOR OF THE POSSIBLE STRATEGIES ... .48
TABLE 9. PERFORMANCE fNDICATORS OF THE RECOVERY STRATEGIES ... 49
TABLE 10. MULTICRITERIA EVALUATION MATRIX ... 50
TABLE 11. STABILlTY INTERVALS FOR THE AGGREGATED INDICATORS ... 54
LISTE DES FIGURES
FIGURE 1. PROJECT TRACKlNG WITHOUT EARNED VALUE ... 7
FIGURE 2. PROJECT TRACKING WITH EARNED VALUE ... 9
FIGURE 3. COST AND SCHEDULE VARIANCE (SOURCE: LIKPE, 2005) ... 18
FIGURE 4. COST AND SCHEDULE PERFORMANCE INDEXES (SOURCE: LIKPE, 2005) ... 18
FIGURE 5.EARNED SCHEDULE CHART ... 20
FIGURE 6. VALUE FUNCTIONS (SOURCE: PAQUIN ET AL. 1996) ... 26
FIGURE 7. THE WBS-QBS MODEL (SOURCE: P AQUIN ET AL. 1996) ... 28
FIGURE 8.DECISION LOGIC ... 36
FIGURE 9. THE PROPOSED DECISION AID METHODOLOGY FOR CORRECTIVE ACTIONS MANAGEMENT ... 39
FIGURE 10. S CURVE AT THE DIFFERENT TRACKING PERIODS ... .43
FIGURE Il. CPI AT THE DIFFERENT TRACKING PERIODS ... 44
FIGURE 12. EAC AT THE DIFFERENT TRACKING PERIODS ... .44
FIGURE 13. ES CURVE AT 22-10-2010 ... 45
FIGURE 14. SPI AND SPI(T) AT THE DIFFERENT TRACKING PERIODS ... 45
FIGURE 15. EAC(T) AT THE DIFFERENT TRACKING PERIODS ... 46
FIGURE 16. QPI EVOLUTION ... 46
FIGURE 17 . PARTIAL RANKlNG WITH PROMETHEE I ... 51
FIGURE 18. COMPLETE RANKING WITH PROMETHEE II ... 51
FIGURE 19. W ALKING WEIGHTS FOR THE BASIC INDICA TORS ... 52
FIGURE 20. WALKING WEIGHTS FOR THE AGGREGATED INDICATORS ... 53
FIGURE 21. SENSIBILITY TO THE TIME AGGREGA TED INDICA TORS ... 54
FIGURE 22. CHANGE IN THE WEIGHT OF THE SPI(T) INDICATOR ... 56
FIGURE 24. RANKING FOR WEIGHT OF SPI(T) INmCA TOR = 31 % ... 57 FIGURE 25. LINEAR INTERPOLATION BETWEEN TOW KNOW POINTS ... 64 FIGURE 26. INTERPOLATION CALCULATION ... 65
INTRODUCTION GÉNÉRALE
Les organisations vivent une pression croissante pour améliorer la qualité, la valeur de leurs prises de décision à tous les niveaux et, en particulier, au niveau de leurs projets. En gestion de projet, une des principales approches développées pour répondre à cette préoccupation est la gestion des risques (Risk Management or RM). Une autre approche importante, utilisée dans l'analyse intégrée, a priori, du temps et du coût du projet, est celle de l'Analyse de la Valeur Acquise ou EVM (Eamed Value Management). Plus récemment, et afin de contrôler la qualité tout au long du cycle de vie du projet, Paquin, Couillard et
Ferrand (2000) ont proposé la méthode de la qualité acquise ou EQM (Eamed Quality Method). Ces approches contribuent ensemble à la performance des projets et, en retour, à
la performance des programmes, des portefeuilles de projets et finalement à l'organisation.
Généralement, la gestion des risques, la gestion de qualité, la gestion de l'échéancier du projet comme la gestion des coûts sont traitées en tant que processus indépendants mais récemment, quelques rares papiers (Hillson, 2000; Paquin, Couillard et Ferrand, 2000) se sont intéressés à l'intégration de ces approches afin de créer une synergie sur la performance des projets. Binbin (2007) a, quant à lui, proposé un cadre général qui peut être mis en application pour combiner EVM, EQM et RM de manière à maximiser
l'atteinte des objectifs (temps/coût/qualité) durant la phase de planification des projets. Une
recherche instrumentale menée par Xu (2009) a permis de développer un outil convivial d'aide à la planification et au suivi de projet, avec pour intention de développer une
interface logicielle permettant au gestionnaire de projet d'avoir une vue, durant le suivi du projet, de la performance de son projet en terme de délai, de coût comme de qualité. Ces
différents travaux se concentrent sur l'intégration de méthodes permettant d'évaluer la performance du projet tant dans la phase de planification que durant le suivi du projet lors
n'est que la première étape vers un meilleur contrôle du projet. La seconde étape est celle
visant à définir et à mettre en œuvre, si nécessaire, un ensemble d'actions correctives. Cette
dernière étape est énoncée dans le processus de suivi et contrôle de projet mais n'est pas
supportée par une modélisation comme si cette gestion des actions correctives était trop
contextuelle. De fait, on se base exclusivement sur la valeur des indicateurs de performance
du projet (le Schedule Performance Index et le Cost Performance Index) pour décider de prendre des actions correctives et l'évaluation de l'ampleur de ces actions relève du
gestionnaire de proj et. D'autres considérations devraient être prises en compte et à notre connaissance, le seul travail qui propose une modélisation de ce processus de gestion des
actions correctives est celui précédemment cité de Lipke (2003) et qui suggère une
approche basée sur un diagramme logique. Cependant, ce travail ne permet pas de choisir,
panni un ensemble d'actions correctives potentielles, celle qui apparait comme la
'meilleure'. Notre recherche, de nature instrumentale, va s'inscrire dans cette ligne de pensée et nous nous proposons de développer un modèle d'aide à la gestion des actions
correctives. Pour y parvenir, une revue de littérature sur les indicateurs de performance des projets comme sur la gestion des actions correctives sera menée dans un premier temps.
Une modélisation originale, permettant de faire un lien entre une analyse
multidimensionnelle de la performance du projet comme d'autres considérations
(possibilité d'avoir une stratégie de réaction, .. ) et le type de stratégie d'actions correctives sera alors proposé. Finalement, cette modélisation sera illustrée et discutée à partir d'un
INTRODUCTION
Currently, risk management, quality management and time/cost management are
managed as independent processes but recently, some exceptional papers (Hillson, 2000; Paquin, Couillard and Ferrand, 2000) focus on the integration of these approaches in order to create synergy on project performance. Binbin (2007) proposed a general framework to combine EVM, EQM and RM to achieve the maximum objectives (time/costlquality) during the phase of project planning. Another research was introduced by Xu (2009). He
developed a tool which has the assistance in planning and monitoring project. This tool provides a vivid vision for project managers in temlS of project performance like schedule delay, cost and quality monitoring during the process of project. These works focus on the integration ofmethods to assess project performance in both planning phase and controlling phase or implementation phase. However, to make a proper assessment of project performance is only the first step towards a better control of the project. The second step is to define and implement, if necessary, a set of corrective actions. The last step is still adopted during the process of project monitor and control, but it is not supported by the model since the corrective actions of the project are depending on the whole project
context. In fact, to decide to take corrective actions and to assess the magnitude of the actions are based on the project perfonnance index value (schedule performance index, cost
performance index). Other considerations should be taken into account and to our
knowledge, the only work is the model mentioned by Lipke (2003) and he suggested an approach, which is based on the logic diagram. While, this approach cannot provide which
looks like the best choice among the set of corrective corrections, in our research, we continue this kind of train of thought and propose to develop a model to help manage the
corrective actions. To achieve this, a literature review on project performance indicators for
the management of corrective actions will be conducted initially. An original model that
corrective action strategy will be proposed. Finally, this model will be illustrated and discussed by a didactic example.
CHAPITRE 1 : Project performance indicators
1. INTRODUCTION
Currently, risk management, quality management and time/cost management are managed as independent processes but recently, sorne exceptional papers (Hill son, 2000; Paquin, Couillard and Ferrand, 2000) focus on the integration of these approaches in order
to create synergy on project performance. Binbin (2007) proposed a general framework to
combine EVM, EQM and RM to achieve the maximum objectives (time/cost/quality) during the phase of project planning. Another research was introduced by Xu (2009). He developed a tool which has the assistance in planning and monitoring project. This tool
provides a vivid vision for project managers in terms of project performance like schedule
delay, cost and quality monitoring during the process of project. These works focus on the integration ofmethods to assess project performance in both planning phase and controlling
phase or implementation phase. However, to make a proper assessment of project
perfom1ance is only the first step towards a better control of the project. The second step is to define and implement, if necessary, a set of corrective actions. The last step is still adopted during the process of project monitor and control, but it is not supported by the
model since the corrective actions of the project are depending on the whole project
context. In fact, to decide to take corrective actions and to assess the magnitude of the
actions are based on the project performance index value (schedule performance index, cost performance index). Other considerations should be taken into account and to our
knowledge, the only work is the model mentioned by Lipke (2003) and he suggested an approach, which is based on the logic diagram. While, this approach cannot provide which
looks like the best choice among the set of corrective corrections, in our research, we continue this kind of train of thought and propose to develop a model to help manage the
the management of corrective actions will be conducted initially. An original model that
makes a link between a multidimensional analysis of project performance and type of corrective action strategy will be proposed. Finally, this model will be illustrated and
discussed by a didactic example.
Eamed Value (ES) systems have been set up to deal with the complex task of
controlling and adjusting the baseline project schedule during execution, taking into
account project scope, timed delivery, total project budget and more recently, quality.
Although EV systems have been proven to provide reliable estimates for the follow-up of cost performance within our project assumptions, the y often fail to predict the total duration of the project. Eamed Value management (EVM) measures schedule performance not in
units of time but rather in units of cost. Moreover, at the completion of a project, which is
behind or ahead schedule, the schedule performance index (SPI) is equal to 1 which corresponds to a perfect schedule performance. To tackle these problems, Lipke (2003) proposed the concept of Eamed Schedule (ES). In this approach, schedule performance is measured in units oftime and the associated indicators are appropriate measures throughout the entire period of project performance. In this section, EVM, EQM and ES are discussed
and the associated performance indices are presented.
2. EARNEO VALUE MANAGEMENT
2.1. INTRODUCTION OF EVM
Eamed value has been used since the 1960's by the Department of Defence as a core part of the C/SCSC (CostiSchedule Control System Criteria). Later the Department of
Defence revised the criteria and result in that eamed value management system was evolved from that criteria. Now, EVM is being used in various govemment contracts
7
EVM, shortened fonu of Eamed Value Management is an integrated management
control system which combines schedule performance, scope and cost performance. This system integrates technical, cost, time, ev en risk management, which allows project manager's objective evaluation and quantification of CUITent project performance to help
project managers to predict and portray future performance based on trends. EVM is a systematic project management process used variance during the project process based on
the co st and schedule control. Eamed value management can pro vide objective, timely and quantitative data for effective decision making.
2.2. PROJECT TRACKING WITHOUT EVM
We list an example here to illustrate the EVM function c1early. We compare the project
tracking with eamed value and trac king without eamed value. It is easy to find the
difference between these two sceneries.
$160 000,00 $140 000,00 ...
-
--
-,"
$120 000,00,
$100 000,00 $ $80 000,00 $60 000,00 $40 000,00 $20 000,00 $0,00./
~'
."t.
!o"'"/
~,
,
/~"
,
~' - AC actual cost - - - PV planned value 1 2 3 4 5 6 7 8 9 la 11 time (week)Figure 1. Project tracking without eamed value
In figure 1, the solid line means the total of all expenditure on the project up to the
reporting date, we called actual cost (AC) here; the dashed line means the sum of all the planned co st in the project up to the reporting date, we called the planned value (PV) here. We can find the following points obviously:
First, actual cost is higher than planned value before week 5, which means this project is over budget before week 5.
Second, actual cost is lower than planned value since week 5 until week 8, which means this project is under budget since week 5 until week 8.
However, what is still missing from figure l is how much work has been actually accomplished during the whole project. If the project is finished at week 8, the project would actually be under budget and ahead of schedule. But it also confused for decision making, if the project has actually been achieved around 5% of the whole project, which means the project is significantly over the budget and behind the schedule. Obviously, project tracking in this situation cannot explain anything and will be useless for decision making. Is this situation, we need a third variance to measure the project perfonnance objectively, timely and quantitatively and convey the right project perfonnance infonnation for decision making. We will explain the principles of function of eamed value management function in the next section.
2.3.PROJECT TRACKING WITH EVM
A third variance which we called eamed value is the cost of ail the progress achieved on the project up to repoliing date. It is expressed in tenns of the planned value from start
to CUITent. Eamed value repents what has been eamed, not simply what has been spent. It
9
current
EV
=
IPV(completed)start
We bring the eamed value into the figure 1; figure 2 shows ail three curves together, which is a typical eamed value management line chart. The arrow line represents the eamed value, which compare with the planned value and actual cost up to a given point in time.
$160 000,00 $140 000,00
1---- ---
.-
,.--""
,.
$120 000,00.,'
~~...-
~ $100 000,00l'
/.
-
AC ac ual co t $ $80 000,00.A""""
~~
" ,---
PVpl nned \ alue $60 000,00~
",.,--
,
,
...--.
r;Vea ned v, Ilue$40 000,00 AI
,"
Y
,,"
,
$20 000,00 1-" ...,
... $0,00 1 2 3 4 Stime fweek)7 8 9 la 11Figure 2. Project tracking with eamed value
(source: http://en.wikipedia.org/wikilEamed value management)
When we compare the eamed value line with the planned value line, the difference was
called schedule variance, marked as SV. While the result of comparison of eamed value line and actual cost line was called cost variance, marked as CV. It can be seen from the
illustration of figure 2 that a timely cost performance and schedule perfonnance can be reflected the objective situation during the project control process up to a reporting time point.
2.4.BASIC EARNED VALUE TERMINOLOGY
In this section, we will introduce a series of terms which are involved in eamed
value management. These terms are standard terms and wildly used, which are described
below:
Planned value (PV or BCWS), planned value is also called the budget cost for the
worked schedule. This is the sum of aIl the planned costs in the project, or any given part of
the project, up to the reporting date.l Generally speaking, planned value is the budget cost
for the work schedule which is completed or fini shed on a certain activity or at the WBS level until a reporting time point.
Earned value (EV or BCWP), this is the cost of aIl the progress achieved on the
project, or part ofthe project, up to the reporting date and expressed in terms of the planned
value originally set out in the initial estimate; it is also 'Eamed Value' as it represents what has been eamed, not simply what has been spent.2
Actual cost (AC or ACWP), this is the total of ail expenditure on the project, or pali of the project , up to the reporting date; it is the sum of what has actually been spent
irrespective of what has been planned or achieved.3
Cost variance (CV), CV is the numerical difference between the eamed value and the actual cost at the reporting point. CV=BCWP-ACWP=EV-AC4
1 Kim, Y.& Ballard, G., 2002, Earned Value Method and Customer Earned Value, Journal of Construction Research, Vol. 3, Issue 1, pp. 55-56
2 Anbari, F.T., 2003, Risi-Adjusted Valuation of R&D Projects, Research Technology Mangement, industrial Research Institute, Inc., September-October 2003
3 Fleming, Q.W. & Koppelman, J.M., 2002, Earned Value Management, Mitigating
11
Schedule variance (SV), SY is the numerical difference between the eamed value
and the planned value expenditure at the reporting point. SY=BCWP-BCWS=EY-Py5
Work breakdown structure (WBS), according to PMBOK, WBS is defined the as
"a deliverable-oriented grouping of project elements that organizes and defines the total work scope of the project. Each descending that organizes and defines the total work scope
of the project. Each descending level represents an increasingly detailed definition of the
project work".
2.5.EARNED VALUE MANAGEMENT INDICATORS
The two fundamental types of indexes which have the meaning for the eamed value management are cost efficiency indicator and schedule efficiency index respectively. Those
are basic co st performance and schedule performance index.
Cost performance index, CPI (cost efficiency), the ratio of the value to the amount spent at
a point in time in project.
CPf = BCWP
=
EVACWP AC
If the CPI> 1, means the cost of completing the work is less than the planned, which stands
for good normally.
If the CPI=l, means the cost of completing the work is equal the planned, which stands for
good also.
4 DODI 7000.2
5 Branch, S.P., 2004, The Basic of Earned Value Management, Transactions of
If the CIP<I, means the cost of completing the work is higher than the planned, which
stands for bad.
Schedule performance index, SPI (schedule efficiency), the ratio of the eamed value
created to the amount of value planned to be created at a point time in the project.
SPI
=
BCWP=
EVBCWS PV
If the SPI> 1, means the time elapsing of completing work is less than planned up to a report point, which stands for ahead of schedule.
If the SPI=I, means the time elapsing of completing work is equals to the planned up to a report point.
If the SPI<I, means the time elapsing of competing work is higher than planned up to a report time, which stands for behind of schedule.
There are another three significant forecasting indexes in the eamed value
management. The first is the estimated cost at completion; the second is the estimated time
at completion; the third one to complete schedule performance indicator.
Estimated Cost AT Completion (EAC).
The estimated end co st when the project is completed. Through the previous literature
review, we find that there are three situations to calculate EAC as below:
The first situation is occurred when the variance is occurred at the current stage and is
not expected to happen during the rest stages of whole project lifecycle. The formula will
be:
13
The second status is happened wh en the past estimation assumptions are not valid and the new estimations are to be applied to the rest stage of project lifecycle. The formula will be:
EAC=AC+ETC (estimate to complete)
The last situation is happened that the assumptions are valid for the CUITent variance and are to be continued to the rest proj ect lifecycle. The formula will be:
EAC
=
ACWP+
BAC - BCWP=
AC+
BAC - EVCPI CPI '
where BAC is the budgeted cost at completion.
Webb (2003) pointed that the formula of the estimated cost at completion is made up of two parts, namely the cost, which is already spent, and the estimated of the future cost, under the assumption that nothing in the project is changed and it follows the existing trends.6 Actually, these numbers are often calculated on a regular basis during the lifespan of the project, since the calculation for the EAC is full of many literatures. The most of important reason is the calculation of EAC depends on performance and trend as weIl as future assumptions.
Estimated Time to Completioll (ETTC), the estimated duration of the project is completed. The fonnula is as follow:
ETTC
=
ATE+
GD - ATE x SPISPI '
Where ATE is the actual time expended, and GD is the original duration.
6 Webb, A., 2003, Using Eamed Value: A Project Manager's Guide, Abingdong,
From the above elaboration, we can develop the further the above equation as follow,
EAC
=
ACWP+
BAC - BCWP=
AC+
BAC - EVCPI CPI '
BCWP EV .
where CPI
=
=
- ,
so we can substltute as follow: ACWP ACEAC
=
ACxEV +BACx AC-EVxAC=
BACx ACEV EV '
. C EV b . h 'AC BAC
smce PI = - , we can 0 tam t at: E =
-AC
cn
F or t he lormu a e 1 ETT C
=
A TE+
GD - ATE x SPI,
lt .. IS conslste . d b y two parts, t h e SPIactual time spent and the estimated future time needed to finish the project. We bring the common denominator to simplify the above formula as follow;
ETTC
=
ATExSPI+
OD-ATExSPI=
ATE x SPI +OD-ATExSPT = ODSPI SPI SPI SPI'
We obtainETTC = OD . In short, we can get the two important derived formulas as follow:
SPI
BAC OD .
EAC
=
- -
andETTC= --
.
To analysls the above two formulas, we can find that itCPI SPI
has the limitation, since the EAC is the budgeted cost divided by the cost performance, errors could be happen when estimate the cost planned, or another situation is if there are
any potential changes during the process of project, in that case it will no longer valid. Here for ETTC, it contains the same potential errors,
Therefore, Fleming and Koppleman (2000) disc10se one additional method to monitor projects eamed value performance, which is called To Complete Performance Index
15
(TCPI_EVM). This index is a comparative EVM index to determine if the independent
estimated co st at completion is reasonable. To sorne extent, this index is a modification of
the EAC index. The formula is as follow:
TCP!
=
BAC - BCWP=
BAC - EVBAC-ACWP BAC-AC'
If TCPI=1.0, which means that the remaining project will be on the tract and can be
executed at the same cost performance level.
If TCPI> 1.0, which means the remaining project work must be executed at a better cost
performance level to bring the project on the original track.
If TCPI<I.0, which means the remaining project work can be executed at a lower cost
performance level than the project completed work.
We can illustrate a simple example here to understand this index;
Project data as follow:
BAC=$125,000;
EV=60,000;
AC=$75,000
So, the TCPI= ($125,000-60,000)/ ($125,000-$75,000) =1.3, that means if the project
manger wants to bring the project on the cost tract, the project must be executed with a 1.3
cost performance level than before.
For the nature of the above formula, TCPI index computes the future required cost
efficiency needed to achieve a target EAC. This index is computed by dividing the budget
remaining into the budget co st ofwork remaining.
To Complete Schedule Performance Indicator (TSPI_EVM), TSPI is an index which
Generally speaking, this index is a comparative index of EVM system. The formula is as follow:
TSP!
=
BAC - BCWP=
BAC - EV BAC-BCWS BAC-PVIf TSPI=1.0, which means the remaining project will be on the tract if followed by the prevlOus.
If TSPI> 1.0, which means the remaining project work must be executed at a better time level performance to bring the rest project to the planned track.
If TSPI<I.0, which means the remaining project work can be executed at a lower time performance level than the project completed work.
2.6. L1MTT ATIONS OF EVM
Eamed value management is an excellent management method which integrates cost,
schedule and requirements. This method facilitates scientific approach to project
management. It also fosters project planning from historical performance to provide project
status described by numerical evidence and predict project future trends. However, the
EVM method has three major deficiencies which were pointed by Walt Lipke (2005)7 as
below:
7 Lipke, W. (2005). Connecting Earned Value to the Schedule. CrossTalk-The
Journal of Defense Software Engineering. Retrieved September 20,2005, http://www.stsc.hill.af.mil/crosstalk/2005/06/0506Lipke.html
17
1) The performance indicators are not directly connected to project output. For example, milestone completion or delivery of products may not me et the customer' s expectation,
yet EVM indicator values are acceptable.
2) The schedule indicators are flawed. For projects completing late, the indicator always show perfect schedule performance.
3) The performance indicators are not explicitly connected to appropriate management
action. Even with EVM data, the project manager remains reliant upon his intuition as
to any action needed.
Generally speaking, traditional schedule EVM metrics are good at beginning ofproject, it shows schedule performance trends. However, the metrics don not reflect real schedule performance at the end of project. Eventually, traditional schedule metrics lose their predictive ability over the last third of project. EVM metrics exist to the following questions;
First, the EVM schedule indicators are reflected in units of cost rather than time. Due
to this flaw, it becomes difficult to make a comparison with time based network schedule indicators. In that case, it is hard for project managers to understand the schedule performance in terms of budget, since it is expressed by units of cost, not time.
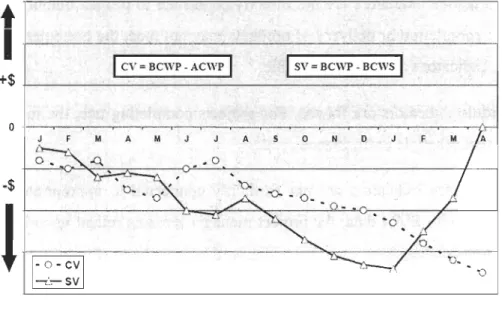
Second, for the early finish projects the EVM index SV and SPI perform correctly for the whole process of project; while for the late finish project the EVM index SV and SPI behave erratically for projects behind schedule, they lose the predictive ability over the last third of the project, since SV improves and concludes at $0 variance and SPI improves and equals at 1.00 at the end of project, which are shown in Figure 3 and Figure 4.
+1
1
1
CV = BCWP -ACWPI l
SV = BCWP - BCWS1
+$
~~~
-=========~--
~======~
--~~
0 -$1
2.0 UJ 1.5 :J ..J <t: > X UJ ~ 1.0 0.5 0.0 J F M A M A S 0 N 0 ~ O . . 0 , -çr-. M lA . 1-~
-cv 1 -n- SVFigure 3. Co st and schedule variance (Source: Likpe, 2005)
-
-
-
-
- -
- -_ ...--
.... __ ...-
- .-
.-
-
. .. -CPI= BCWP SPI = BC"'P AC"'P BC"'S '"' ;-;.
.
.
, 0- -.0 ••.
,.
. D·-o.
.
0 -"
..Q.
~
,
0 --0 • -0---0 •~
LS ~ -r.:; L I ""U~
'
-o--
o
01--
1-
021
-
~0
-CP'I
SPI M A M A S O N 0 F M AFigure 4. Cost and schedule performance indexes (source: Likpe, 2005)
The end point of the PV is the planned cost for the project at planned completion, budget at completion (BAC), which means PV=BAC, meanwhile at actual completion, the
EV converges to the BAC, means EV=BAC, as far as aU know, SV=EV-PV, wh en actual
completion surpass the planned completion, SV=EV-PV=BAC-BAC=O, in this situation,
19
behaviour of the schedule indexes which are shown in Figure 3 and Figure 4. It is not hard to understand that at sorne point during the process of project SV and SPI indicators will lose their management value. Project managers cannot rely on the schedule indexes in the EVM system.
3. EARNED SCHEDULE MANAGEMENT
3.1. EARNED SCHEDULE CONCEPT
Earned schedule (ES) is an extension to earned value management, which overcomes the flaw of earned value and was introduced by Walt Lipke in a seminal article "Schedule is Different" in 2003. It is a technique for calculating time-based estimated at completion using existing EV data. Since it was introduced by Walt Lipke, Kym Henderson extended its use to forecasting function. So far, earned schedule technique is better than using existing EV techniques to full potential. Both real and simulated data has shown the ES technique to be more accurate when compared to other predictive statistics.8
As described by Lipke in the seminal paper (2003)9, the idea of Eamed Schedule is analogous to Earned Value. However, instead of using cost for measuring schedule performance, we would use time. Eamed Schedule is detem1ined by comparing the cumulative BCWP earned to the performance baseline, BCWS. The time associated with BCWP, i.e. Earned Schedule, is found from the BCWS S-curve.
8 Vanhoucke & Vandevoorde, A Simulation and Evaluation of Earned Value Metries
to Foreeast Projeet Duration, Journal of Operations Research Society, October 2007, Vol 58: 1361-1374
The Figure 5 showed the basic Eamed Schedule model, like Lipke (2003) described, more explicitly, the cumulative value of ES is found by using BCWP (EV) to identify in
which time increment of BCWS (PV) the cost value occurs. The value of ES th en is equal
to the cumulative time to the beginning of that increment plus a fraction of it. The fractional
amount is equal to the portion of BCWP (EV) extending into the incomplete time
increment divide by the total BCWS (PV) planned for that same time period.10
$ F
.'
M 1 SV(S)=BCWP-BCWS A 1 SV(t)=ES-AT 1 .'#
Projection of BCWP / onto BCWS ~--..., • 0 o o ••• i{BCWP 1: ." 1 1 1 1 1 1 .. " 1 1 M J Time AES = Ali of MJy +Portion of June
ES = 5 + BCWP($)· BCWS(Moy) BCWS(June)· BCWS(Moy)
s o N
Figure 5. Eamed Schedule Chmi
According to Henderson and LipkelO, the Eamed schedule is expressed algebraically,
ES cum is the number of completed PV time increments EV exceeds PV plus the fraction of
the incomplete PV increment in the unit of time being utilised. Therefore, in more
mathematical terms,
ES cum=C+I
10 Henderson, K.,Eamed Scheduie:A Breakthrough Extension to Earned Value
Theory? A Retrospective Analysis of Real Project Data, The Measurable News, Summer, 2003, pp.l-lO
21
Where: C=number oftime increment where EV PV, and I=(EV-PVc)/(PVc+I-PVc)
3.2.EARNED SCHEDULE INDEX
Using ES, the indicators can be described as follow:
Schedule Variance: SV(cum)
=
ES(cum) - AT(cum) , where AT(cum) is cumulative actual time. If the SV(cum) >0, which means ES (cum) exceeds AT(cul11) , it stands for ahead of schedule; If the SV(cum) <0, which means ES (Clll11) is less than AT(cum) , it stands for behind of schedule. Schedule performance index: SPI(culll)=
ES(cum/ AT(cul11)If the SPI(cum) is greater than 1.00, wh en ES (cum) exceeds AT(cum) , which means ahead of schedule.
If the SPI(culll) is less than 1.00, whenES(cul11) is less thanAT(cul11) , which means behind of
schedule.
Henderson (2003) II suggested techniques which can be used to independently calculate
estimates ofproject duration and the project completion date.
The first technique calculates an Independent Estimate at Completion (time), lE AC (t) by using:
IEAC({)
=
PD / SPI({)II Henderson, Kym, Earned Schedule: A Breakthrough Extension to Earned Value
, where PD is the Planned Duration. Actually it is the short form of calculation of IEAC (t).
There is another long form of calculation of IEAC (/), which is shown as follow:
PD-ES IEAC
=
AT+
(cum)(1) PF
,where PF is a Performance Factor which is expressed as P = LEV} /LPV} , where PV}
is the planned value for tasks associated with ES, and EV} is the eamed value at AT (actual
time) corresponding to and limited by the planned task, PV}. Actually the above formula is
the extension of short form. Henderson (2004)12 pointed that this formula provides for the
possibility of schedule performance factors other than SPI (/) to be developed and utilised.
The second technique calculates an Independent Estimate of Completion Date
(IECD) for the project according to Henderson (2004)9, the formula as follow:
IECD = Pr ojectStartDate
+
IEAC(I)In sum, the above two indicators are the predictive uses of eamed schedule. There is
another indicator as to future work, which is called Planned Duration for Work
Remaining (PDWR), the formula is as follow:
PDWR=PD-ES (cum), where PD is planned duration.
There is another index which is corresponding to TCPI in the EVM, is called To
Complete Schedule Performance Index (TSPI_ES). It was introduced by Walt Lipke
(2009),13 the formula is as follow:
12 Henderson, Kym, Further Development zn Earned Schedule, The Measurable
News, 2004
13 Walt Lipke, The TCPIIndicator Transforming Project Performance, Projects &
23
TSPI
=
(PD-ES)
/
(TD-AT)
, where PD is the planned duration ES is the Eamed Schedule
TD is the total duration desired, we can understand it as estimated duration.
Generally: PD, the negotiated duration (ND), or estimated duration (ED), AT is the
actual time or duration at the time of computation. Walt Lipke pointed that all of the
preceding description for applications 0 TCPI can be made analogously for TSPI. That is,
the use of TSPI is available for schedule management and control in a parallel manner to
cost and TCPI. Both indexes are needed to have complete capability for the cost-schedule
performance trade-off necessary for project recovery.
3.3. EARNED SCHEDULE BENEFITS
There are a number of benefits which are derived from Eamed Schedule, the main
benefits are;
First, Eamed schedule was created as a simple solution to resolve the problem of
schedule performance indicators failing for expressing in amount of money instead of time.
Eamed Schedule performance indexes can give a vivid vision to the project managers;
Second, Eamed Schedule solves the problem of the EVM schedule indicator failing for
late finishing projects. ES provides better schedule prediction using EVM data, and this
kind ofmethod is still valid from beginning to the end of the project.
Third, for the prediction of the project duration, using ES is also much easier to
calculate. It provides an estimate of duration and completion dates, especially for late
Except the above main benefits, Alex Davis and Mick Higgins (2010) 14 listed the
following benefits of Eamed Schedule:
• It pro vides an estimate of duration and milestone completion dates- especially for
late-running activities.
• The method provides forecast indicators mu ch in the same way as EVM.
• Project and Programme Managers have another schedule analysis tool that potentially improves the confidence in statistically forecasting delivery dates -especially for projects and programmes that are behind schedule.
• As with standard EVM, ES facilitates drill-down to the areas of the schedule that need management attention.
• ES also provides early waming out of sequence activities by the use of the "P"
factor.
• ES makes a contribution to trend analysis; it can be used to highlight trends in
milestone slippage and be superimposed with contract delivery deadlines, risk
confidence limits and benefit realisation data to provide a more comprehensive picture ofproject/programme performance.
• Last, and by no means least, you do not need any additional data to perform
Eamed Schedule ca1culation. The existing Eamed Value date is all you need; you are just using it in a different dimension.
14 Alex Davis & Mick Higgins, Eamed Schedule An emerging Eamed Value
technique, the AMP Eamed Value mangement SIG Working Group, January, 2010
25
4. EARNED QUALITY MANAGEMENT
4.1. INTRODUCTION
According to the international standardization organization (ISO) has defined quality
as the set of properties and characteristics of a product or a service required to me et the
explicit and implicit needs of a client. Quality includes all the properties and characteristics
that give a product or a service the capacity to satisfy fully the explicit and implicit client's
needs. It is a complex task to measure the quality of a project, since it is involved multiple
conflicting objectives as well as imprecise and qualitative attributes.
In the project management, lots of the quality control methods, like quality function
deployment (QFD) and value analysis (V A), aim at achieving quality through improved
product and process design. According to Jean Paul Paquin, 2000, these methods do not
specifically address the fundamental issues relating to the periodic assessment and control
of the quality of a project and product throughout its life cycle. 15
The earned quality method (EQM) is a general method to help the project managers in
evaluating and controlling the quality of the project through the whole project's life cycle.
It was introduced by J.P Paquiln, 1996. The original intention is propose a multi attribute
utility theory approach that enables project managers to me as ure and estimate the monetary
value of a project's accumulated quality attributes. Earned quality is a tool for assessing
and controlling quality through a project life cycle. The earned quality method is based on
two fundamental assumptions:
a) The quality is a measurable concept
15 Jean Paul Paquin, Jean Couillard, and Dominique J. Ferrand, Assessing and
Controlling the Quality of a Projeet End Produet : The Earned Quality Method, IEEE
b) The quality is accrued progressively throughout the project's life cycle16
The eamed quality method can allow project managers to assess and control the quality of
the end products periodically through comparing eamed quality and planned quality to
detect quality deviations and initiate early corrective actions. EQM needs sorne steps as
follow;
First, it must elucidate the client's needs, which means decomposing the overall quality
objective into lower level objectives of more detail. Second, assessing and aggregating the
client' s preferences. Third, estimate the eamed quality.
One point must be addressed, the project managers and the clients must select from a set of
value functions, as shown in Figure 6 as follow;
---~ (1 a) (id) 1 , 1 1 Figure 6. ---~ , , , ,
-
1 ~ , ,,
,
<Il/Xj) 1 --- ----X J (If) x.,Value functions (Source: Paquin et al. 1996)
x
)The project manager must obtain with regard to all J criteria estimates of the result Xj
\vhich 'vvill most lilcel:r' be achieved upon project completion triloügh the cntirc projcct's life
16 lP.Paquin, J.Couillard, R.Paquin, D.Godcharles, Earned Quality : Improving
27
cyc1e.17 The overall quality Q of the project end product is equal to the weighted sum of the utility value of the results Xj achieved over aIl J criteria. MathematicaIly, we can express as:
J
Q=
IWj<D/x)
j=1
Which, Q is the overaU quality of the project end product
W j is the relative contribution of criterion to the overaU quality objectiv, and
J is the number of the criterions.
x j is the result of the J criterion.
ct> } (x} .) is the result of x} . achieved over aU J criteria.
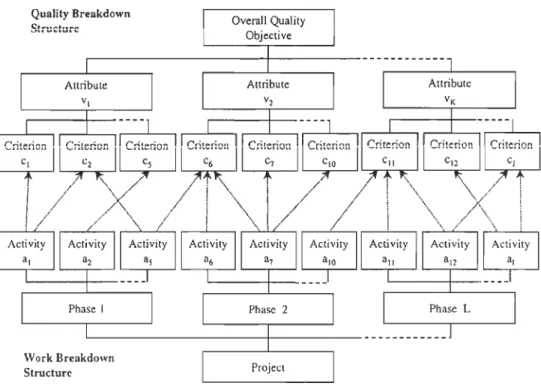
The EQM link the work breakdown structure (WBS) and quality breakdown
structure (QBS), which have a relationship between WBS and QBS. See the Figure 7
as foUow;
17 J.P.Paquin, J.CouiIlard, R.Paquin, D.Godcharles, Eamed Quality: Improving
Quality 8reakdown
Structure
Figure 7. The WBS-QBS model (Source: Paquin et al. 1996)
The eamed quality method link the activities to quality attributes, which enable the project manager to connect the WBS work element to the quality control through the entire the project life cycle. EQM uses the relationship between the WBS and QBS, which was shown in Table l, Table 1. uantity of Work Quality of Work Planned Quality Eamed Quality
Quality ofwork and quantity ofwork
Work Scheduled
Planned Quality of Work Scheduled (PQWS)
(Source: Paquin et al. 1996)
Work Performed
Planned Quality of Work Performed (PQWP) Earned Quality of Work
29
Work scheduled stands for the planned rate of completion of the activities at the report time t, while work performed deal with the actual rate of completion of the activities
at the reporting time point t.
Planned quality means the anticipated quality that should have accrued at the reporting time
point t, while eamed quality regards to the actual quality that accrued at the reporting time
point t.
4.2. EXPLANATION OF EQM
According to the Paquin et al. (2000), the planned quality of work schedule PQWS
measures the planned contribution to the overall quality objective attributable to the work
scheduled for aIl activities. It is defined as follows until the reporting time point,
1 J
PQWS(
=
I I
w)<D ) (x;)r; (t);;1 );[
Where
r;(t) , the planned contribution to the expected result x~ as measured by criterion
C
j
attribute to the work scheduled for activity aj at time t, 00:'5:r
;
(t) :'5:"'
J
The planned quality of work performed PQWP measures the planned contribution to the
overall quality objective attributable to the work performed on aIl activities at reporting
time point t, which is defined as following;
1 J
PQ~
=
IIw)<D)(x~)rij(t);;1 );1 Where
'il (t) , the planned contribution to the expected result
x;
as measured by criterion Cjattributable to the work performed on activity aj at time t,
°
~ ri} (t) ~ ri}The earned quality of work performed EQWP measures the overa11 client satisfaction
with the results achieved or the eamed quality, attributable to the work performed on a11 activities at reporting time point. It can be expressed as fo11ows;
1 J
EQWP
=
~ ~~ ~ w.<D .(x .)r .. (t)} } } Ij
;-1 }=I
Where,
X; (t) the actual result achieved with regard to criterion Cj of the work performed at
time t
ri} (t) the estimated contribution to the actual result x; (t) as measured by criterion Cj
attributable to the work performed on activity aj at time t
By comparing the eamed quality ofwork performed EQWP with the planned quality of work perfonned PQWP, the quality variance QV will be the following equation ;
QV=EQWP-PQWP
If QV<O, means the quality objective was underachieved. If QV>O, means the quality obj ecti ve is over achievement.
A quality perfonnance index (QPI) is calculated as follow;
EQWP
QPI
=
*100%31
This index standard may be initiated whenever pres et threshold have been exceeded.
4.3.THE MODIFIED EQM (Xv, 2009)
The EQM model is very original and interspersing. However, it has the limitations related to necessary information needed to get going. Specially, we state the limitations as follow:
• The choice of function that reflects the quality on a given criterion is subjective.
This is not necessary, but it is a limit to the method because it requires managers to
set up the functions first.
• By considering the relative contribution of a task to a given quality criterion is not
only the liner relationship with time. However, in practice, it makes project managers to have a subjective information and hard to estimate the difference. And
it would not be more convenient for using a linear relationship to consider the achieved percentage of the activity.
• The model considers a discrete approach based on benchmarks to evaluate the achieved percentage of the activity. But it wou Id not be interesting to work with a continuous measure of the percentage of completion.
In response to these criticisms regarding to the applicability of EQM method in practice,
Xu (2009) proposed a modification formulas that inc1ude the EQM calculations as follow:
1 j PQWP
=
LLw
j
r
ij
%i 1 j EQWP=
LLw
j
<1>
j
r
ij
%i EQWP QPI=
PQWP5. PROJECT CONTROL AND DECISION MAKING
5.1. PROJECT CONTROL
Project management is the discipline of planning, controlling and managing resources
to bring the success of completion of specifie project goal or aim. One of the fundamental
responsibilities of a project manager is to make sure that aIl kinds of administration
behaviours are done as they are supposed to be done. In that case, it can bring the success
of completion of specific project goal. In other words, this kind of responsibilities was
called control. Control is the act of reducing the difference between plan and reality. It is also the last element in the implementation cycle of planning-monitoring- controlling. In
essence, control is the act of reducing the difference between plan and reality. 18 In the
world of project management, the term "control" is much more analogous to drive a coach to take a trip. The driver must keep making course adjustments with the original destination
as promised in the beginning of the voyage. The driver must make sure bring the customers
to the correct destination safely on time as promised in the beginning of the voyage. And the successful project voyage must include carefully charting a course to destination,
driving to destination on time, distinguishing location on the map, paying attention to
weather, and keeping a watchful eye on speed and so forth.
Project control, of course, is one of the most important areas in project management.
First, it involves bringing actual performance into the congruence with the original plan. Project control is one of the fundamental components in the world of project management.
In every project, project control that is defined as the behavior of reducing the difference
between plan and reality is the necessary pro cess which involves monitoring progress of the
plan, analyzing the variances including cost, time and so forth, taking necessary corrective actions, ev en stop the project when it is necessary to accomplish the project according to
33
given target. This kind of behavior is the fundament guarantee that can push the whole project forward to given destination.
Furthermore, project control can be used as an effective project method to make project move on the right track. Specifically speaking, good project control can significantly improve project performance and reflect the project situation precisely. It can provide more information for the administration level. Specifically speaking, it can make
the project on the original routine and keep costs competitive and maintain schedule integrity. For example, effective project control not only can reduce the fixed costs, but also deal with the variable cost highly competently. While, in today's modem project management, except traditional cost and schedule control, scope control, risk control, quality control, and customer satisfaction control emerges. They are becoming the new focus for project managers. Generally speaking, good project control usually can be used as a strategic tool to enhanced competitive forces in the market.
Project control is not the only factor that can guarantee project success, but it is one of the most important factors. Generally, the regulation of results through the alteration of activities and the stewardship of organizational assets are two fundamental pUl"poses of control. The final objective of project control is to reduce the difference between plan and reality. While, controlling the destiny of certain project is not simple for project managers. Maintaining control in terms of minimizing the distance between plan and reality is always the subject of controlling. That means project managers should keep an eye on the future,
the y must know clearly aIl kinds of variances and deal with these variances under a reasonable range.
In short, project control will address the following questions: • When a manager should act,
These two questions are age-oid questions, but there is a relationship between the project performance and management actions. Traditional management tools just give the behaviour ofproject performance and generai actions, but the y do give the detaiis ofhow to measure this kind of relationship? In another words, how to decide wh en to take the appropriate actions is faced by the project managers.
5.2. PROJECT PERFORMANCE ANALYSIS AND DECISION MAKlNG
Project performance is the behaviour of project control. And project performance is also called project efficiency which is measured by the Eamed Value Management (EVM) indicators, cost and schedule performance indexes, CPI and SPI, respectively. 19
Furthermore, it is also measure by Eamed Schedule Indexes, like SPI (cum) and so on. Actually, project performance is measured by a set of indexes, like CPI, SPI, TCPI, and TSPI and so forth, which provide infom1ation conceming project progress. For a simple example, if the SPI is less than 1.0, which means the project is performing less than the planned performance as to the reporting time, project managers will put more labour resources on it to catch the schedule.
EVM is still the best effective project management tool to monitor the health of project for project managers so far. Even project managers hold this tool, but this kind of tool does not provide the corrective action tips. Furthermore, whatever project managers who do something wrong or right will buy time. If they do the corrective actions, and will get the project back on course, otherwise, project performance will go worse. All these situations are due to lack of relationship between the project performance and corrective
35
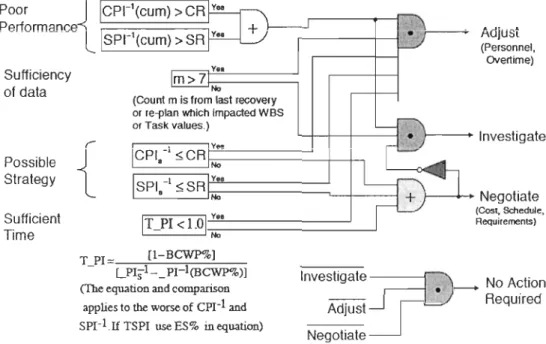
actions. We cite part of the model that Walt Lipke developed in 2003.20 Lipke indicated
that expect the project performance, there are other considerations needed to make the management decision, which are sufficiency of data, possible strategy and sufficient time.
He also pointed that there are four basic actions inside this model, the y are as follows:
•
No Action Required•
Investigate•
AdjustlRealign•
Negotiate 20Lipke also gave the explanation of these four actions, obviously, it is easy to
understand the first two items, when the project is performing weIl, and the project
managers would be wise to not make any changes. While, if the project has poor
performance, but has insufficient data, the project managers would investigate for potential
causes and data definitely.
The AdjustiRealign and Negotiate actions are not so simply connected to the analysis
results. The project manager should negotiate additional co st and/or schedule, ore reduction
of requirements, only when a recovery strategy is not possible, or there is insufficient time
for the recovery to be effective. 14
The figure 8 shows the relationship between project performance and actions as
follow;
20 Walt Lipke, Deciding to Act, Cross Talk, The Journal of Defense Software