Femtosecond laser writing of nanogratings on the
surface of fused silica
Thèse présentée
à la Faculté des études supérieures et postdoctorales de l’Université Laval dans le cadre du programme de doctorat en Physique
pour l’obtention du grade de Philosophiae doctor (Ph.D)
DÉPARTEMENT DE PHYSIQUE, DE GÉNIE PHYSIQUE ET D’OPTIQUE FACULTÉ DES SCIENCES ET DE GÉNIE
UNIVERSITÉ LAVAL QUÉBEC
2012
c
Résumé
Lorsqu’un faisceau laser femtoseconde est fortement focalisé sur des matériaux transpar-ents, une ionisation en cascade peut se produire suite à l’intense ionisation du champ induit par celui-ci. Une fraction de l’énergie laser est absorbée et transférée dans le support produisant un échauffement local. La température à l’intérieur de la zone d’irradiation s’élèvera au point de fusion ou d’ébullition, selon la fluence de l’impulsion incidente et les propriétés du matériau. En conséquence, une légère modification du matériau, la formation de nano-réseaux ou des dommages complexes peuvent se pro-duire. L’explosion de Coulomb peut participer au processus d’enlèvement de matière lorsque le faisceau laser est fortement focalisé sur la surface. Dans cette thèse, nous al-lons nous concentrer sur la formation de nano-réseaux sur la surface de la silice fondue. Nous mesurons la fluence de l’impulsion nécessaire pour induire des nano-réseaux de surface pour différents espacements entre des impulsions consécutives, pour découvrir et quantifier l’effet d’incubation dans le processus de formation de nano-réseaux. Nous proposons également une équation d’incubation modifiée (seuil d’ablation en fonction de l’espacement entre les impulsions). À l’aide d’un SEM, nous examinons le change-ment structurel de la morphologie sur la surface induite par la combinaison de différents paramètres d’écriture tels que : l’énergie par impulsion/fluence, l’espacement entre les impulsions et la profondeur de la lumière focalisée sous la surface. Nous montrons ainsi l’évolution des nano-fentes dans le cas statique et pour une petite gamme de fluence d’impulsion et démontrons que des nano-réseaux uniformes peuvent être obtenus lorsque la fluence de l’impulsion est légèrement au-dessus du seuil d’ablation et que la largeur et l’espacement des nano-réseaux dépendent de l’espacement entre les impulsions et de leur fluence. Nous proposons également un nouveau modèle qui inclut les effets de réparti-tion de l’intensité locale et d’incubaréparti-tion. L’évoluréparti-tion progressive de maxima locaux et la formation de nouvelle paires de nanogrooves (cas statique) ou de son autoréplication (cas de numérisation) sur des emplacements spécifiques est en fait la physique der-rière le processus de formation qui est fidèlement reproduit dans l’expérience. Jusqu’à maintenant, aucun modèle n’a réussi à bien représenter les phénomènes observés. Fi-nalement, nous présentons les applications potentielles de l’écriture directe d’un certain nombre contrôlable de nanocanaux et nano-réseaux à grande surface.
Abstract
When a femtosecond laser beam is tightly focused onto transparent materials, strong field ionization followed by avalanche ionization may occur, and a fraction of laser energy is absorbed and transferred into the lattice resulting in local heating. The temperature within the irradiation zone will rise up to the melting or boiling point depending on the incident pulse fluence and material properties. As a result, either smooth modifica-tion, or well-shaped nanogratings or complex damage may occur. Coulomb explosion may also participate in the material removal process. In this thesis, we focus on the nanograting inscription on the surface of fused silica. We measure the pulse fluence which is required to induce surface nanogratings for different pulse-to-pulse spacing, uncover and quantify the incubation effect in the nanograting inscription process, and propose a modified incubation equation (ablation threshold as a function of pulse-to-pulse spacing). Using a scanning electron microscope, we examine the structural change on the surface induced by the combination of different writing parameters such as the pulse energy/fluence, pulse-to-pulse spacing and the depth of the focused light below the surface. We show the shot-to-shot evolution of nanogrooves in the static case for a small range of pulse fluence, and demonstrate that well-shaped nanogratings can be obtained with pulse fluence slightly above the reduced ablation threshold, and that the width and spacing of the nanogratings depend on the pulse-to-pulse spacing and pulse fluence. In particular, we propose a new model which consists of local intensity distri-bution and incubation effect. The progressive evolution of new local maxima and in turn the formation of new nanogrooves in pairs (static case) or in a self-replicating way (scanning case) at specific locations is in fact the physical focus behind the nanograt-ing inscription, as is faithfully reproduced by the experiment. No previously reported model has ever been successful in that respect. Finally, we discuss and demonstrate the potential applications in direct writing of a controllable number of nanochannels and large-area nanogratings.
Acknowledgement
First and foremost, I would like to thank my advisors, Prof. See Leang Chin and Prof. Réal Vallée for providing me with the great opportunity to join their groups and an ideal environment to begin my research. I am very grateful for their patience, support and guidance, and the opportunity they allowed me to direct the course of my research. The work presented in this thesis cannot be so successful without their contribution. In particular, their emphasis on clear presentation of ideas which I am sure will stick with me for the rest of my life.
Moreover, I would like to thank my colleague Dr. Quan Sun who helped me a lot during my first two years of study. We were working together on many experiments and I have learned many things from him. I also want to thank my student colleague Mr. Daniel Gingras for his patience and spectacular skill of taking the wonderful SEM images for most of my samples. I also would like to express my deep gratitude to Mrs. Mario Martin and Stéphane Gagnon for their kindness and prompt technical assistances that helped me perform my experiments efficiently. I express my sincere gratitude to all the staff in the Physics Department and COPL. I would also like to acknowledge those other people whom I have been fortunate to know and work with in the laboratory.
Finally, I acknowledge the Natural Sciences and Engineering Research Council of Canada, Canada Foundation for Innovation, the Canadian Institute for Photonic Inno-vations as well as Prof. Chin and Prof. Vallée for the financial support.
Résumé ii
Abstract iii
Acknowledgement iv
Table of contents vii
List of tables viii
List of figures xii
1 Introduction 1
1.1 Historical background . . . 1
1.2 Main achievements and organization of this thesis . . . 5
2 Mechanisms of laser-matter interaction 7 2.1 Absorption of laser energy . . . 8
2.1.1 Nonlinear ionization . . . 8
2.1.2 Avalanche ionization . . . 11
2.1.3 Evolution of plasma density . . . 12
2.2 Energy deposition . . . 14
2.3 Different interaction mechanisms for “long” and “short” pulses . . . 15
2.4 Material removal mechanisms . . . 17
2.4.1 Coulomb explosion . . . 17
2.4.2 Phase explosion . . . 17
2.5 Heat accumulation . . . 18
2.6 Incubation . . . 20
3 Experimental setup for nanograting inscription 22 3.1 Brief introduction to third harmonic generation . . . 23
3.1.1 Third harmonic generation using focused Gaussian beams . . . 23
3.2 Multiple refocusing characterization and critical power measurement
us-ing third harmonic generation at interface . . . 28
3.2.1 Experimental setup . . . 28
3.2.2 Results and discussion . . . 29
3.2.3 Conclusion . . . 33
3.3 Experimental setup for nanograting inscription and its alignment technique 33 4 Role of the incubation process on surface nanograting inscription 36 4.1 Experiment . . . 36
4.2 Measurement of nanograting formation threshold . . . 37
4.3 Incubation effect in nanograting formation . . . 40
4.4 Conclusion . . . 41
5 Modeling of nanograting formation 43 5.1 A brief introduction to plasma physics . . . 43
5.2 Dielectric hemisphere in a laser field . . . 44
5.3 Local intensity distribution . . . 46
5.4 Evolution of local intensity distribution in the static case . . . 49
5.4.1 Numerical modeling . . . 49
5.4.2 Evolutionary patterns . . . 50
5.5 Evolution of local intensity distribution in the scanning case . . . 51
5.5.1 E perpendicular to S case . . . . 51
5.5.2 E parallel to S case . . . . 53
5.6 Conclusion . . . 55
6 Surface structural change morphology (static case) 57 6.1 Experiment . . . 58
6.2 Surface structural change as a function of pulse energy and pulse number 58 6.2.1 Below single shot ablation threshold . . . 58
6.2.2 Near single shot ablation threshold . . . 60
6.2.3 Above single shot ablation threshold . . . 63
6.3 Discussion . . . 64
6.4 Conclusion . . . 66
7 Surface structural change morphology (scanning case) 68 7.1 Transition from smooth modification to nanograting . . . 68
7.1.1 Experimental results: transition on the surface and inside the bulk of fused silica . . . 69
7.1.2 Discussion . . . 71
7.1.3 Conclusion . . . 75
7.2.2 Discussion . . . 79
7.2.3 Conclusion . . . 82
7.3 Role of pulse energy/fluence . . . 82
7.3.1 Experimental results . . . 82
7.3.2 Discussion . . . 88
7.3.3 Conclusion . . . 88
8 Inscription of nanochannels and large-area nanogratings 90 8.1 Writing of a controllable number of nanochannels . . . 90
8.1.1 Role of pulse fluence . . . 91
8.1.2 Role of pulse-to-pulse spacing . . . 91
8.1.3 Role of the depth of the focal spot . . . 93
8.1.4 Discussion . . . 94
8.1.5 Conclusion . . . 94
8.2 Inscription of large-area nanogratings . . . 95
8.2.1 Experimental results . . . 95
8.2.2 Discussion . . . 103
8.2.3 Conclusion . . . 106
9 Conclusions and future work 107 9.1 Summary and discussion . . . 107
9.2 Future work . . . 108
9.2.1 Development and optimization of components based on single nanochannel and large-area nanogratings . . . 108
9.2.2 Writing and characterizing nanogratings in optical fibers . . . . 109
9.2.3 Completing the modeling for nanograting inscription . . . 110
9.2.4 Characterization and interpretation of nanograting formation in-side the transparent materials . . . 110
Bibliographie 112
A Alignment technique 124
B Dielectric sphere in a uniform electric field 130
2.1 Summary of parameters used in the calculation . . . 13
4.1 Measured beam radii, threshold energies and the computed threshold fluence for different pulse-to-pulse spacing. . . 39
2.1 Schematic drawings showing photoionization in different regimes. . . . 9
2.2 Keldysh parameter and photoionization rate as a function of laser intensity. 10
2.3 Avalanche ionization rate according to the flux doubling model. . . 12
2.4 The intensity dependence of plasma density. . . 13
2.5 The plasma evolution with and without avalanche ionization. . . 14
2.6 Timescale of the physical processes involved during the interaction of femtosecond laser pulses and transparent materials [65]. . . 15
2.7 Temperature evolution at r = 3 µm as a function of the number of pulses
N for repetition rates 200 kHz, 500 kHz, and 1 M Hz, respectively. . . 19
2.8 Evolution of temperature at r = 0, 1, 2 µm as a function of pulse number
N for repetition rate 200 kHz. . . . 20
3.1 Beam radius and Gouy phase shift along the propagation direction for a Gaussian beam in air. . . 24
3.2 Normalized TH signal generated by a tightly focused Gaussian beam as a function of the normalized confocal parameter b△k (b = 2zR). . . 25 3.3 Calculated THG z-response curve. . . 27
3.4 Schematic drawings showing the principle of the symmetry of the z-response curve. . . 28
3.5 Experimental setup for THG. . . 29
3.6 TH energy as a function of the geometrical focal position. . . 30
3.7 CCD images of the filaments induced at the pulse energy of 700 nJ . . . 32
3.8 TH energy (integration of the far left peak) induced by geometrical fo-cusing or the first filament crossing rear surface versus pulse energy in log-log scale. . . 33
3.9 Experimental setup for nanograting inscription. . . 35
4.1 (a) Schematic drawing showing the threshold effect of nanograting for-mation. (b) SEM pictures for nanograting formation at different pulse energies. . . 38
4.2 The overall extent of the nanogratings as a function of incident pulse energy for three different pulse-to-pulse spacing. . . 39
5.1 The resultant field of an ablation zone induced by an intense laser is the sum of the laser field plus a dipole field. . . 46
5.2 A dielectric hemisphere in a laser field El. . . . 47
5.3 (a) Local intensity distribution of the first shot. (b) and (c) Local inten-sity distribution along y-axis and x-axis. . . 48
5.4 (a) The locations of the first pair of side maxima as a function of plasma density ρ with the half width of the ablation zone R0 = 69.4 nm; (b) The locations of the first pair of side maxima as a function of R0 with
ρ = 2.5× 10²¹ /cm3. . . . 48 5.5 Evolution of local intensity distribution along x-axis as a function of the
number of shots. . . 49
5.6 Local intensity distribution as a function of the number of shots. . . 52
5.7 Schematic drawings showing the modification of the local intensity for the E ∥ S case. . . . 53
5.8 Simulated results of the width (a) and spacing (b) as a function of the pulse-to-pulse spacing. . . 55
5.9 Nanograting simulated with the shot-to-shot ablation threshold and plasma density fixed. . . 56
5.10 The simulation conditions are the same as the ones for Fig. 5.9 except that the width of nanogrooves is fixed to an experimental value. . . 56
6.1 Evolution of the nanogrooves at 80 nJ . . . . 59
6.2 Evolution of the nanogrooves at 80 nJ for a large number of shots. . . 60
6.3 Evolution of the nanogrooves at 90 nJ . . . . 61
6.4 Evolution of the nanogrooves at 90 nJ for a large number of shots. . . 62
6.5 The cross-sections for nanograting formation at 6 and 16 shots at 90 nJ . 62
6.6 Evolutionary patterns for nanograting formation at 100 nJ . . . . 63
6.7 The evolutionary patterns for nanograting formation at 120 nJ . . . . . 64
6.8 A unit crater showing the incubation area along the equatorial direction. 67
7.1 Transition from smooth modification to nanograting on the surface. . . 70
7.2 Well-shaped nanogratings at two different locations at the same trace. . 70
7.3 Transition from smooth modification to nanograting inside the bulk ma-terial. . . 72
7.4 Nanograting inside the bulk material. . . 73
7.5 Local intensity distribution normalized to incident intensity at two loca-tions (equator and pole). . . 74
7.6 Local intensity distribution along the electric field direction . . . 74
7.7 Nanograting formation as a function of pulse-to-pulse spacing d with the electric field E either perpendicular or parallel to the scan direction S. 76
spacing d with electric field E either perpendicular (a) or parallel (b) to
the scan direction S. . . . 77
7.9 (a) Average intensity profile of a nanograting structure (top). (b) 1D FFT of the nanograting structure shown in the top of (a). . . 78
7.10 The width (a) and spacing (b) of ordered nanogrooves for the electric field E either perpendicular or parallel to the scan direction S. . . . 78
7.11 Transition from static to moving (a) or vice versa (b). . . 80
7.12 Simulation for the spacing Λ of nanogrooves as a function of pulse-to-pulse spacing d for different values of plasma density. . . . 81
7.13 Nanograting formation on the surface with the surface normal slightly tilted from the laser propagation direction . . . 83
7.14 (a) The variation of the nanograting period. (b) The corresponding fluence distribution along the scan trace. . . 84
7.15 (a) The transition near ablation threshold. (b) A well-shaped nanograting. 84 7.16 Pulse fluence dependent nanograting formation on the surface. . . 86
7.17 Pulse fluence dependent nanograting formation on the surface. . . 87
7.18 Nanograting formation on the surface with different pulse energies Ep while keeping the same pulse fluence. . . 87
7.19 Nanograting period as a function of pulse energy for different pulse-to-pulse spacings. . . 88
8.1 Pulse fluence dependent nanochannel formation. . . 92
8.2 Pulse-to-pulse spacing d dependent nanochannel formation. . . . 92
8.3 Different numbers of nanochannels formed at different positions of the same scan trace due to the tiny tilting. . . 93
8.4 Raster scanning pattern. . . 95
8.5 Nanogratings written at 110 nJ with pulse-to-pulse spacing fixed to 40 nm (a, b) and 60 nm (c, d), respectively. . . . 96
8.6 Large-area nanogratings fabricated at Ep = 110 nJ with pulse-to-pulse spacing fixed to d = 40 nm. . . . 97
8.7 Large-area nanogratings fabricated at Ep = 110 nJ with pulse-to-pulse spacing fixed to d = 60 nm. . . . 98
8.8 The coherently guided nanogrooves (a) and linked up ones (b). . . 99
8.9 Shallow nanogrooves. . . 100
8.10 Damage on the nanoplanes. . . 100
8.11 Cross-section of large-area nanogratings. . . 101
8.12 The influence of surface defects and/or the fluctuation of laser fluence on the surface. . . 102
8.13 Large-area nanogratings created at 120 nJ . The pulse-to-pulse spacing and vertical interval are 60 nm and 0.8 µm, respectively. . . . 103
8.14 Large-area nanogratings inscribed at 100 nJ with a vertical interval of 0.4 µm. . . . 104
8.15 Schematic drawings showing the seeding effect from the sites of the laser-induced defects. . . 105
A.1 Multi-axis translation stage with sample holder and 3 motorized attenu-ators. . . 125
A.2 Microscope object platform. . . 126
A.3 Schematic drawing showing the procedures for the alignment of the x’-axis motorized attenuator. . . 127
A.4 (a)-(c) TH z-response curve during alignment. (d) THG at the vicinity of the surface. . . 129
Introduction
1.1
Historical background
Laser-matter interaction has been attracting a lot of attention from scientists and engi-neers in academia and industry ever since the invention of the laser. Great efforts have been made to understand the fundamental mechanisms of interaction between intense lasers and matter. This is one of the most interesting aspects to laser scientists because laser-induced breakdown or ablation occurring within laser optical components is one of the main limitations for the development of high-power laser systems. Meanwhile engineers have been concentrating on the applications of the technology of laser-matter interaction in material processing, machining, and medical domains. Advances in the laser technology combined with better understanding of laser-matter interaction make the laser a unique tool for manufacturing otherwise inconceivable devices. Particularly, the emergence of femtosecond laser systems enables material processing, micro- and nano-machining of most materials as well as photonic devices fabrication with high precision. In this thesis, we will focus on the nanograting inscription on the surface of fused silica induced by a tightly focused femtosecond beam.
The very first laser-induced periodic surface structures (LIPSSs), also known as ripples, were observed in 1965 by Birnbaum on the surface of various semiconductors (Ge, Si, GaSa, GaSb, InSb and InAs) with a ruby laser [1]. Since then, exhaustive studies on LIPSSs with lasers of different wavelengths (from UV to IR) and different pulse durations (from nanosecond to femtosecond) have been reported on the surface of diverse materials such as metals [2–7], semiconductors [3,8–14], polymers [15–17], and dielectrics [18–27]. In the early days, LIPSSs which were written with long pulses at normal incidence, had spacing close to the wavelength of the writing laser, and were
subsequently referred to as low-spatial-frequency LIPSSs (LSFLs). Their formation was interpreted in terms of interference between the incident laser light and scattered wave from dust, scratch or other particles on the surface [8]. Accordingly, a simple equation describing the spacing d = λ/(1± sin θ) was proposed, where λ is the wavelength of the writing laser, θ is the incident angle. This explanation seems straightforward and works very well in terms of ripple period in most cases [11,12,28] but fails in explaining the ripple orientation dependence on the writing laser polarization, and the formation of ripples with multiple-period [10,12]. Soon after the publication of this interpretation, several other interpretations were proposed such as: (1) localized plasma oscillations driven by a complicated E-field distribution resulting from the combination of the inci-dent, reflected, and diffracted waves [2]; (2) ripple regrowth over large distances due to laser annealing via the scattering from the formed ripple which results from the melt-ing and resolidification [9]; (3) the generation of standing acoustic waves related to a nonlinear interaction between simultaneously oscillating multi axial modes of the ruby laser [10]; (4) the polarization charge model (the polarization charge induces a sinu-soidally varying perturbation to the applied laser field in the vicinity of the defects) [18]; (5) the surface polariton interference model [24,29]; and (6) the interaction between the incident field and radiation remnant field just below the surface [3,30,31]. Most laser-induced ripples are perpendicular to the linear laser polarization [2,8–10,18], but there are some exceptions. For example, the ripples produced by p-polarized beams grow both perpendicular and parallel to the linear laser polarization for a range of incident angles [3,28,29]; and the ripples parallel to the laser polarization has a pe-riod of λ/ cos θ. In some specific cases such as that with the incident angle > 30o and s-polarized beams, two sets of cross-hatched ripples are formed simultaneously, and nei-ther of them is perpendicular nor parallel to the laser polarization [3]. In the scanning case where the successive spots are partially overlapped, the ripples can be extended if the orientation is along the scan direction, but for the ripples orientated perpendicular to the scan direction, the ripples in one spot seem to have no relationship with the ripples in an adjoining spot [12].
However, it has recently been shown that LIPSSs written with femtosecond pulses have spacing substantially smaller than the wavelength of the writing laser. This kind of structures is then termed as high-spatial-frequency LIPSSs (HSFLs). Some groups call them nanogratings when the HSFLs are induced with tightly focused femtosecond laser beams which is our field of interest. The previously reported classical interference model and all other models are not valid in this “femtosecond regime” as pointed out by Costache et al. in their experiments [19,32,33]. They loosely focused a femtosecond laser beam (800 nm, 120 fs, 1 kHz) (f = 300 mm) onto the surfaces of various single crystalline targets (Al2O3, BaF2 and CaF2). The results turned out to be in contra-diction with those surface ripples induced by long pulses in two aspects: the periods of
laser; and the patterns are insensitive to the variation of both wavelength and incident angle. In addition, the laser-induced ripples were found to occur only in a small range of laser intensities and be independent of the crystallographic structure and orienta-tion. Bifurcation, which is a typical signature of self-organization, was also found in the laser-induced patterns. Therefore, self-organization of the highly mobile surface atoms left behind by the massive emission of ions via Coulomb explosion of the surface was proposed to be responsible for the formation of these HSFLs [32].
Most recently, Kazansky et al. and Qiu et al. reported anomalous anisotropic light scattering that peaked in the plane of laser polarization when femtosecond laser pulses were tightly focused in some doped glasses [34,35]. This was interpreted in terms of photoelectrons moving along the laser polarization direction inducing index inhomogenities. Uniaxial birefringence imprinted in fused silica by femtosecond laser pulses was also observed [36,37]. The refractive index was found to change for light polarized along the polarization direction of the writing laser. Later on, Mills et al. observed strong reflection from the modified region occurring only along the polarization direction of the writing laser and concluded that self-organized submicron grating-like nanostructures were inscribed into the bulk of fused silica by femtosecond laser pulses [38], and these nanostructure were suggested to be responsible for all these unexpected effects which depend on the polarization of the writing laser.
In 2003, this kind of self-organized grating-like nanostructures was finally confirmed by Shimotsuma et al. [39] in their experiment in which a femtosecond laser beam was tightly focused into a fused silica block (∼100 µm below the surface). After laser irra-diation, the sample was polished to the depth of the modification regions and examined under a scanning electron microscope (SEM). The observed grating-like nanostructures was interpreted as a result of the periodic modulation of electron plasma concentration due to interference between the incident light field and electric field of the bulk electron plasma wave.
However, this interference model was questioned in terms of the calculated plasma temperature (∼ 107 K) by Bhardwaj et al.. They pointed out that such a high plasma
temperature could not be reached within a modification region of 30 µm3 induced by tightly focused femtosecond laser pulses with energy as low as 200 nJ [40]. Accordingly, they proposed another model based on nanoplasmonics which well explained the orien-tation of nanogrooves in terms of local field enhancement. This model also suggested that the scaling of the nanograting spacing with laser wavelength (λ/(2n)) was due to the mode selection as for the case of a planar metal waveguide, and the ordering of the nanogratings was thus maintained by these sustainable modes [40]. Buividas
et al. adapted this model for the fine ripple formation on the surface of transparent
materials [26], and proposed that the imprinted standing wave seeded by the mirror-like plasma along the electric field direction was responsible for the ripples formed in the static case which had a period equal to λ/(2n). Meanwhile, Jia et al. reported nanograting formation on the surface of ZnSe crystal by irradiation of two orthogonal femtosecond laser beams (800 nm and 400 nm) [20]. The nanograting orientation was found to change with the combined energy set for the two-color beams and the period was also about λ/(2n). This was interpreted as a result of the interference between the surface scattered wave of 800 nm laser pulses and 400 nm light. Sun et al. reported the increase of the surface nanograting period with pulse-to-pulse spacing and pointed out that the overlap of pulses plays an important role during nanograting formation [22]. Similar phenomenon was observed in the bulk where the nanograting period decreases with the increase in the number of pulses [39,41]. In addition, Huang et al. suggested that surface plasmons were responsible for the formation of ordered nanogratings and their polarization dependence, while the material removal resulting in the formation of the nanogrooves was due to Coulomb explosion [23].
Despite the fact that a great number of experiments related to nanograting formation were carried out both on the surface and inside the bulk of various materials [20–27,42–
47], and several models were proposed [24,26,32,39,40], the origin of laser-induced high-spatial-frequency surface ripples or nanogratings is still under debate. None of these models have addressed the evolution of nanograting on a shot-to-shot basis, and none of them can satisfactorily explain the dependence of the width and spacing of nanogrooves as a function of the number of overlapped shots in the static case and pulse-to-pulse spacing in the scanning case. A clear picture capable of revealing the physics behind the nanograting inscription is still missing. Many questions still need to be answered such as: why nanogratings cannot be induced by single shot? Why nanogratings only occur in a small range of laser intensities? Why the width and spacing of nanogrooves depend on the number of overlapped shots? And how the ordered structures are maintained on the shot-to-shot basis?
It was with such background that we started our investigations of nanograting in-scription on the surface of fused silica with tightly focused femtosecond laser pulses. Our research focused on the influence of incubation effect on the nanograting inscription pro-cess, the evolution of nanogrooves/nanogratings as a function of pulse energy/fluence, pulse-to-pulse spacing, and the depth of the focused beam, and the formation of a controllable number of nanochannels and large-area nanogratings. Our goal is to in-vestigate and understand the mechanism of nanograting formation on the surface of transparent materials.
1.2
Main achievements and organization of this
the-sis
In this thesis, we propose a new nanograting formation model based on nanoplasmonics, which consists of local intensity modification and incubation effect. It will be shown that the progressive creation of the local intensity maxima along the laser polarization direction combined with the reduction of the ablation threshold due to the incubation effect are responsible for the formation of ordered nanogrooves. This model is easy to understand and gives insight into how the nanogratings are formed on a shot-to-shot basis for both static and scanning cases. Experimentally, we have been successful in writing and characterization of well-shaped nanogratings, controllable numbers of nanochannels, and large-area nanogratings in terms of different writing parameters. In order to make the experimental chapters “stand” alone and easily understood, we present the new nanograting formation model in detail in chapter 5 before the exper-imental results of nanograting inscription. Experexper-imental chapters can then be well interpreted and may be read independently.
Chapter 2 provides a brief introduction to the basics of laser-matter interaction. The strong field ionization, energy absorption and deposition in transparent materials, and material removal mechanisms are discussed. The so-called incubation effect resulting from laser-induced defects is also briefly introduced.
Chapter 3 presents a detailed theoretical and experimental study of the third har-monic generation at an interface. The z-response curve is used as a criterion for the alignment of the experimental setup for nanograting inscription.
In chapter 4, experimental results pertaining to incubation effect in the nanograting formation on the surface of fused silica are presented. The ability of measuring and quantifying the incubation effect has led us to unveil the positive feedback mechanism as well as the role of pulse-to-pulse spacing during the nanograting inscription process. This incubation effect contributing to the creation and extension of the plasma zone is measured by the extrapolation method. Accordingly, a modified incubation equation is proposed.
Chapter 5 focuses on the new nanograting formation model. The slightly overdense plasma resulting from strong field ionization is the prerequisite of ordered nanograting formation. Numerical simulations are performed for the progressive evolution of the local intensity in both static and scanning cases with the reduction of the ablation threshold taken into account. The theoretical evolution patterns are given on the
shot-to-shot basis for both cases, which are faithfully reproduced experimentally.
Chapter 6 investigates the shot-to-shot evolution of the nanogroove formation in the static case. The differences in evolution for different pulse fluence regimes (slightly be-low, near, and slightly above single shot ablation threshold) are observed and discussed. The formation of nanogrooves in pairs at specific locations and the very existence of the inner pair of nanogrooves, especially the formation process following a sequence that is precisely predicted by our model, provide strong evidences for its validity.
Chapter 7 presents a systematic study of nanograting inscription in the scanning case by altering the pulse energy/fluence, pulse-to-pulse spacing, and the depth of the focused beam. The width and spacing of the nanogrooves are found to increase with the increase of the pulse-to-pulse spacing, which is consistent with the theoretical predictions discussed in chapter 5.
Chapter 8 demonstrates the possibility of writing of a controllable number of nanochan-nels and large-area nanogratings. The former is controlled by either changing the pulse fluence on the surface, or varying the pulse-to-pulse spacing, or changing the depth of the focused beam. The latter is inscribed based on the self-seeding effect (or guiding effect) originating from laser-induced defects left by the previous scan.
Chapter 9 reviews the contribution of this thesis and proposes some ideas for further experiments.
Mechanisms of laser-matter
interaction
When a low-intensity laser beam irradiates a transparent material, only linear optical effects such as reflection, diffraction, transmission and absorption may be observed. However, when the laser intensity is intense enough, nonlinear optical effects occur and reversible and non-reversible material modifications become possible. The nature of these laser-induced phenomena is usually characterized by the combination of the laser parameters (pulse duration, fluence, wavelength, and repetition rate) and the optical, mechanical, and thermal properties of the target materials. During laser-induced break-down or laser ablation, the first stage is the transfer of laser energy to electrons through multiphoton absorption followed by inverse bremsstrahlung heating, and then the trans-fer of energy into lattice through electron-phonon interaction. Eventually, the electrons and lattice reach thermal equilibrium on a time scale of a few picoseconds [48,49]. This time scale (thermal relaxation time) sets the boundary for thermal and/or non-thermal interactions, i.e., material modification with pulses longer or shorter than this timescale which is also termed as “long pulse” or “short pulse” [50] result in significantly different interaction mechanisms.
This chapter aims to look at the mechanisms of laser ablation (or laser-induced breakdown) driven by femtosecond laser pulses. We first address the issue of nonlinear absorption of laser energy, which includes strong field ionization, inverse bremsstrahlung heating and avalanche ionization. Then we discuss energy deposition that leads to mate-rial removal. We compare the different interaction mechanisms between long pulse and short pulse when interacting with transparent materials. Finally, we briefly introduce the incubation effect.
2.1
Absorption of laser energy
The absorption of light in transparent materials must be nonlinear because a single photon in the visible or near IR regime does not have enough energy to promote an electron across the band gap which is normally much greater than the photon energy. However, with an intense laser beam, the bound electrons can be excited through strong field ionization, e.g., multiphoton ionization (MPI) and/or tunnel ionization (TI). In addition, electrons in the conduction band can further linearly absorb energy from the incoming photons through inverse bremsstrahlung heating. Once a free electron in the conduction band has sufficiently high energy (greater than the sum of the conduction band minimum and effective band gap), part of its energy may be transferred to a bound electron in the valence band by collision (impact ionization) resulting in two free electrons in the bottom of the conduction band. Consequently, these two free electrons will experience the same process as discussed above, and produce more electrons from the valence band. Then the density of free electrons grows exponentially through a series of collision processes which is called avalanche ionization. Depending on the laser intensity and material properties, the induced plasma can be either lower or higher than the critical value which is associated with material damage, resulting in reversible (refractive index change, defect formation) or non-reversible (nanostructure/nanocrack formation, material removal) [43,51] structural modifications.
2.1.1
Nonlinear ionization
In the presence of intense laser fields, both MPI and TI can occur but are efficient in different regimes of the frequency spectrum. In 1965, Keldysh proposed the adiabaticity parameter now known as the Keldysh parameter, to indicate the regime in which the processes might occur [52]:
γ = ω eE
√
mUi, (2.1)
where m = 0.635me is the reduced mass of the electron and the hole in fused silica [53], me is the electron mass, e is the charge of the electron, ω and E are the laser frequency and field amplitude, Ui is the band gap separating the valence band from the conduction band. In the case of intense laser fields and low laser frequencies (γ ≪ 1), the potential barrier is suppressed drastically. The length of the potential barrier that electrons have to pass decreases significantly as depicted in the left panel of Fig. 2.1. The electrons can thus escape from the atom or molecule easily within half an optical cycle. This corresponds to TI. However, for higher laser frequencies and less intense laser fields(γ ≫ 1) where the potential barrier is not suppressed, the electrons need to
TI
γ 1
TI+MPI
γ 1
~
MPI
γ 1
bound electron
free electron
laser pulse
Figure 2.1: Schematic drawings showing photoionization in different regimes. simultaneously absorb several photons in order to escape from the atom or molecule. This is the so-called multiphoton absorption as shown in the right panel of Fig. 2.1. In the intermediate regime (γ ∼ 1), both TI and MPI coexist as shown in the middle panel of Fig.2.1. The potential barrier is distorted to a certain extent but the length of the barrier is still not short enough for the electrons to escape. However, by absorbing several photons (less than the MPI case), the electrons can thus acquire enough kinetic energy to pass the barrier through TI. Recent investigations have suggested that for TI to occur one requires γ < 0.5 [54].
In the presence of a strong laser field, the photoinization rate which strongly depends on the laser field, band gap, laser frequency and the effective electron mass [52] can be written as (both MPI and TI are taken into account):
WP I = 2ω 9π ( mω ~γ1 )3/2 Q(r, x) exp ( − π⟨x + 1⟩K(γ1)− E(γ1) E(γ2) ) , (2.2) where γ1 = √ γ2/(1 + γ2), γ 2 = √ 1− γ2 1, x = πω2Ui~ √ 1+γ2
γ E(γ2), and symbol ⟨x⟩ denotes the integer part of x. The functions K(k) and E(k) are the complete elliptic integrals of the first and second kinds which can be respectively written as:
K(k) = ∫ π/2 0 dθ √ 1− k2sin2θ = ∫ 1 0 dt √ (1− t2)(1− k2t2), (2.3) E(k) = ∫ π/2 0 √ 1− k2sin2θdθ = ∫ 1 0 √ 1− k2t2 √ 1− t2 dt. (2.4)
The function Q(r, x) is:
Q(r, x) = √ π 2K(γ2) ∞ ∑ n=0 { exp(−nπK(γ1)− E(γ1) E(γ2) )Φ ( π v u u t2⟨x + 1⟩ − 2x + n 2K(γ2)E(γ2) )} , (2.5)
MPI TI PI W W W
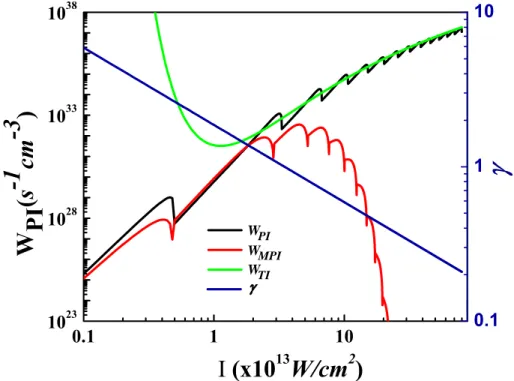
Figure 2.2: Keldysh parameter and photoionization rate as a function of laser intensity (Computed with the parameters shown in Table 2.1).
where Φ(x) =∫0xexp(y2− x2)dy is the Dawson function.
In a laser matter interaction process (e.g. interaction of 800 nm femtosecond pulses and a fused silica block), the Keldysh parameter and photoionization rate as a function of laser intensity can be calculated according to the set of equations shown above and depicted in Fig. 2.2. The Keldysh parameter of γ ≃ 1 is found to locate in a laser intensity range (1× 10¹³ ∼ 1 × 10¹⁴ W/cm2) corresponding to the ablation threshold of transparent materials for a femtosecond laser beam [55,56]. In other words, both MPI and TI are likely to coexist in a laser ablation process. Moreover, the ionization rates for MPI and TI in the asymptotic cases (γ ≫ 1 and γ ≪ 1) are also plotted in Fig.2.2. It is clear that when the intensity is above 1014 W/cm2, the MPI rate is under estimated; while at intensity less than 1013 W/cm2, the TI rate is over estimated by the approximation. The corresponding approximated ionization rates for MPI and TI
are expressed as [52]: WM P I = 2ω 9π ( mω ~ )3/2 Φ (√ 2⟨Ue ~ω + 1⟩ − 2Ue ~ω ) (2.6) exp ( 2⟨Ue ~ω + 1⟩(1 − 1 4γ2) ) ( 1 16γ2) ⟨Ue ~ω+1⟩, WT I = 2Ui 9π2~ ( mUi ~2 )3/2( e~E m1/2U3/2 i )5/2 exp ( − πUi 2~ωγ(1− 1 8γ2) ) . (2.7)
2.1.2
Avalanche ionization
Avalanche ionization (AI) is in fact a free electron amplifying process which involves free electrons acceleration by a strong electric field, and ionization of the atoms or molecules by collision (impact ionization). It starts on a small initial electron population which could come from the photoionization and/or the background electrons (defects or ther-mal noise), and the plasma density could be built up to about 1022 /cm3. In ultrapure crystals at room temperature, the background electron density in the conduction band can surpass 108 /cm3 [57] which can serve as seeds for avalanche ionization. With a decrease in the pulse duration, however, free electrons generated by multiphoton ion-ization, whose ionization rate strongly depends on the laser intensity, becomes more appreciable than background carriers for an avalanche to develop. Therefore the break-down threshold for ultrashort pulses is deterministic rather than stochastic for long pulses [58].
Within the flux doubling model [59], the avalanche ionization rate as a function of laser intensity can be described as:
β(I) = σI
U′, (2.8)
where σ = (1/nc0ϵ0)[e2τc/m(ω2τc2+1)] is the cross section of the inverse bremsstrahlung absorption for a single electron, I is the laser intensity, and U′ = (2 − m/me)(Ui +
e2E2/4mω2) is the effective band gap which takes into account the oscillation energy of the free electrons in the electric field, and the conservation of energy, and the momentum during the collision between the free and bound electrons [60,61]. Figure2.3 shows the avalanche ionization rate as a function of laser intensity according to the flux doubling model [59].
0.1 1 10 100 10 12 10 13 10 14
avalanche ionization rate
( s -1 ) I (x10 13 W/cm 2 )
Figure 2.3: Avalanche ionization rate according to the flux doubling model.
2.1.3
Evolution of plasma density
During laser interaction with transparent materials, material damage is generally as-sociated with rapid build-up of electrons in the conduction band to a critical density. This is because the plasma density at a critical value is necessary for further significant absorption of laser energy [57,59,62] which results in a significant amount of energy deposited into the material and eventually leads to damage. Within the flux doubling model [59], the evolution of the free electron density in a transparent material e.g. fused silica, can be described by the following rate equation [60]:
dρ dt = ( dρ dt ) P I + ( dρ dt ) AI − ( dρ dt ) LOSS = [WP I + β(I)ρ] ( 1− ρ ρmax ) − ρ τs , (2.9) where the first term on the RHS takes into account the ionization rates of both the MPI and TI and avalanche ionization, ρmax is the maximum available bound electron density in the valence band, ρ is the plasma density and τs is the plasma life time (ρmax = 2.2× 10²² /cm3, τs= 150 fs for fused silica [63,64]).
Figure 2.4 shows the calculated plasma density as a function of the incident laser intensity for a pulse of 80 fs. The local field enhancement effect during the presence of plasma is not taken into account. When the laser intensity is close to 1014 W/cm2, full ionization of the valence electrons occurs as shown by the plateau of the curve.
Table 2.1: Summary of parameters used in the calculation
Symbol Description Value
me Free electron mass 0.91× 10⁻³⁰ kg
ϵ0 Vacuum permittivity 8.854× 10⁻¹² F/m e Electron charge 1.6× 10⁻¹⁹ C ~ Planck constant 1.054× 10⁻³⁴ J.s λ Laser wavelength 800 nm τF W HM Pulse duration 80 fs Ui Band gap 9 eV
m Effective mass of electron 0.635me kg
n Refractive index of fused silica 1.45
τc Electron collision time 10 fs
τs Plasma life time 150 fs
0.1 1 10 10 13 10 15 10 17 10 19 10 21 10 23 ( c m -3 ) I (x10 13 W/cm 2 )
Figure 2.4: The intensity dependence of plasma density (calculated with the parameters shown in Table 2.1).
with AI without AI
Figure 2.5: The plasma evolution with and without avalanche ionization for an 80 fs laser pulse (FWHM ). The peak laser intensity is 3.48× 10¹³W/cm2. The dashed curve represents the pulse profile. Parameters used for calculation are listed in Table2.1. The calculated evolution of plasma density as a function of time for a F W HM : 80
fs pulse duration for a given intensity (3.48× 10¹³ W/cm2 at which γ = 1) is also shown in Fig.2.5. The plasma starts to build up quickly at the rising edge of the pulse, and reach the maximum density after the peak. When the pulse is almost over, the recombination process starts and thus the plasma density decreases. In fused silica, the plasma disappears in a few picoseconds. The evolution of plasma density without the avalanche ionization is also plotted. The dashed curve is the pulse profile. The parameters used in the simulation are listed in Table 2.1.
2.2
Energy deposition
Energy deposition is one of the most important issues for ultrashort laser micro and nanomachining. It involves electron-electron interaction, electron-phonon interaction, and thermal diffusion. The timescale of the physical phenomena associated with the interaction of femtosecond laser pulses with transparent materials, reported by Gattass and Mazur [65], is shown in Fig. 2.6. Once a slightly overdense plasma is induced, a large amount of laser energy can be absorbed and part of it will be coupled into the material through electron-phonon interaction within a timescale of a few picoseconds resulting in local heating followed by material removal through phase explosion. After
Figure 2.6: Timescale of the physical processes involved during the interaction of fem-tosecond laser pulses and transparent materials [65].
a few nanoseconds, a small amount of heat is diffused out of the interaction zone.
2.3
Different interaction mechanisms for “long” and
“short” pulses
As mentioned above, the separation between long and short pulses is set by the thermal relaxation time required for thermal equilibrium between the electrons and lattice. Thus, for long pulses whose duration is longer than the thermal relaxation time, thermal equilibrium can be reached while the heat source (laser pulse) is still present. This is essentially the same as heating by conventional methods. The temperature in the irradiation zone may reach the melting and boiling points, provided that sufficient energy is deposited, resulting in melting, surface vaporization or spallation. Meanwhile, a certain amount of the absorbed energy is carried out of the irradiation zone through thermal diffusion and/or material removal (hot electrons and molten material). The interaction mechanism for short pulse will be discussed later.
Earlier studies have shown that for long pulses, the avalanche ionization is responsi-ble for laser-induced breakdown or ablation [55,56,58,66,67]. The background electrons serve as seeds for avalanche ionization resulting in a stochastic nature of the breakdown threshold. This is because the number of seed electrons in the focal volume is of the or-der of unity [58]. Consequently, the breakdown threshold for long pulses is defined as the fluence at which there is 50% probability that a laser pulse with this fluence will cause
breakdown, and the breakdown threshold was found to follow the square root scaling of the pulse duration [55,56,62,68]. However, when the pulse duration is shorter than the thermal relaxation time, the breakdown threshold becomes deterministic. This is because that the peak intensity becomes great enough to provide the seed electrons for avalanche ionization through photoionization with the decrease of the pulse duration. The density of the seed electrons provided by photoionization can be quite high and thus “block” or minimize the effects from the background electrons. This results in less statistical fluctuation and thus gives a more deterministic breakdown threshold.
In addition, the breakdown threshold was found to deviate from the square root scaling law. Among these deviations, Du et al., Pronko et al. and Rajeev et al. found a rise in threshold fluence for very short pulse duration [55,69,70], while Stuart et al. and Varel et al. observed that the threshold fluence continues to decrease with the decrease of the pulse duration when smaller than 10 ps at a slower rate than τ1/2, and a rapid decrease of the threshold fluence when pulse duration is shorter than 100 fs [56,62] (500
fs in Varel et al.’s experiment [68]). A theoretical model proposed by Stuart et al., in which seed electrons provided by multiphoton ionization are further heated resulting in impact ionization followed by avalanche ionization, precisely predicts the deviation from the square root scaling law [56]. However, further study on the dissimilarity of the deviation from the square root scaling law shows that the density of the initial free electrons in the conduction band originating from impurities and defect states plays an important role in laser-matter interaction for pulse duration shorter than a few tens of picoseconds [57].
Although laser-induced breakdown or ablation has been investigated for a few decades, the respective roles of multiphoton and avalanche ionizations in free electron generation remain controversial in the femtosecond regime. Among many theoretical and exper-imental studies of femtosecond laser ablation, some researchers believe that the role of multiphoton ionization in the femtosecond laser ablation process is to provide seed electrons while avalanche ionization is still responsible for the ablation for pulse down to approximately 100 fs [55–57,59,69,71,72]. This is because on this time scale, there is still plenty of time for electrons to linearly absorb incoming photons through inverse bremsstrahlung heating, and thus with sufficient energy to collide with other electrons in the valence band by impact ionization. Moreover, there are recent experimental re-ports of avalanche ionization resulting in optical breakdown in fused silica with pulse as short as 10 fs [73]. Nevertheless, some other researchers proposed that avalanche ionization is of minor importance in generating free electrons in transparent materials, multiphoton ionization itself can generate free electrons to a critical value resulting in material removal [60,61,74]. More investigations in this field are still required.
2.4
Material removal mechanisms
When the incident laser intensity reaches a certain level, the deposition of the absorbed energy from incoming photons leads to permanent structural changes on the target. Generally, thermal processes such as melting and boiling with a large heat-affected zone apply for cw laser, long pulses and high repetition rate pulse trains, while non-thermal processes are attributed to the ultrashort pulses. In this section, we mainly focus on two major mechanisms for material removal from surface by femtosecond pulses. One is Coulomb explosion, and the other is phase explosion.
2.4.1
Coulomb explosion
When a femtosecond laser beam is tightly focused onto the surface of a transparent substrate, high-density electrons are usually generated through strong field ionization and/or avalanche ionization. The electrons at the bottom of the conduction band which is close to the vacuum level have the chance to escape from the target surface when the escape distance is less than the mean free path. The emission of free electrons may subsequently result in a local accumulation of positive charges. As a consequence, the repulsive forces between ions may exceed the binding forces of the atoms or molecules, leading to strong ion ejection. This is so-called Coulomb explosion which is inhibited in metals due to the fast motion of the free electrons. There have been many experiments demonstrating that Coulomb explosion is responsible for the “gentle” ablation [75–77] where a few nanometers in depth is removed per laser shot and a smooth surface is thus left behind. This process lasts for about 1 picosecond after the laser shot and is usually detected by time-of-flight mass spectrometry. The ejected ions of different mass have equal momenta as expected from an impulsive acceleration from a highly charged surface. After a certain number of shots or with the increase of pulse fluence, the ablation process was found to shift from Coulomb explosion to phase explosion. The kinetic energies of different ejected ions tend to be equal and the corresponding ablation rate is about an order of magnitude higher [75,76].
2.4.2
Phase explosion
Phase explosion has been observed as an additional ablation channel after a certain incubation period [75] or with relatively high incident pulse fluence [76]. Both the incubation and relatively high incident pulse fluence could lead to the deposition of a
significant amount of energy into the lattice leading to local heating. As a consequence, there is a sudden rise of the local temperature which reaches the vaporization point. The material of the interaction zone is thus in a solid-vapor state and then removed away by explosive vaporization (phase explosion). Meanwhile the surrounding material is still heated by the heat diffusion from the interaction zone over a longer time scale. Nevertheless, the size of the melting zone is quite small because of the rapid cooling which is due to the steep temperature gradient and the fact that a large amount of the absorbed laser energy is carried away by the ejected material. Because little liquid is involved, the material removal becomes highly precise, in contrast to the long pulse case.
2.5
Heat accumulation
Mass production at high speed and low unit cost is generally required in manufac-turing processes. From the application point of view, direct writing of micro- and nano-scale optical components with high repetition rate femtosecond laser is preferred. This is because not only higher writing speeds can be used but also heat accumula-tion as the consequence of high repetiaccumula-tion rate writing can minimize thermal cycling between pulses, which results in a crack-free laser manufacturing [78,79]. Nevertheless, a relatively large heat-affected zone is produced and this may not be wanted in some other cases such as precision surface and in bulk patterning. This is because a large heat-affected zone may destroy the precision of the nanostructures and even ruin the designed structures by melting and resolidification.
Eaton et al. and Zhang et al. have shown the heat accumulation effects in femtosec-ond laser-written waveguides as a function of repetition rate [78,79]. A finite-difference thermal diffusion model was applied to laser conditions typically used for waveguide writing. The heat source which is the laser irradiation can be modeled as a delta func-tion in time since the pulse length is much shorter than the thermal relaxafunc-tion time (a few picoseconds). For simplicity, the heat source is considered to be stationary. Thus, the 3D heat diffusion equation (spherical coordinate) can be described as:
∂T ∂t = 2α r ∂T ∂r + ∂2T ∂r2 + H(r), (2.10)
where α is the thermal diffusivity, H(r) is the heat source whose temperature distribu-tion follows the laser beam profile (assumed to be Gaussian):
H(r) = 1 cpρV
p
r is the spatial variable, w0 is the beam waist, and U0 is the absorbed energy per pulse. Hence, the temperature of the material is instantaneously increased by H(r) when irradiated by a pulse. The simulated temperature evolution (T ) at r = 3 µm as a function of the number of shots (N ) operated at different repetition rates is shown in Fig. 2.7. For repetition rate smaller than 200 kHz, thermal cycling from pulse to pulse is obvious, and no significant heat accumulation is observed. Hence, the size of the heat-affected zone is limited.
Figure 2.7: Temperature evolution at r = 3 µm as a function of the number of pulses
N for repetition rates 200 kHz, 500 kHz, and 1 M Hz, respectively (Simulated with
the typical parameters for nanograting formation in the bulk. Pulse energy: 200 nJ , 50% of the beam is absorbed [40]; focal spot diameter: 2.4 µm).
For the case of surface interaction, this 3D heat diffusion equation is still applicable by considering the focal zone as a hemisphere and heat dissipation in a semi-infinite medium. Considering that about 15% energy of the beam is absorbed when the beam of 90 nJ irradiates in the vicinity of sample surface [80], the simulated temperature evolution at the positions of r = 0, 1, 2 µm as a function of the number of shots (N ) for 200 kHz beam are shown in Fig. 2.8. The maximum temperature in the center of the irradiation zone is as high as 4500oC, which strongly suggests that phase explosion must occur in the central zone. Nevertheless, the temperature drops below the melting point at r = 2 µm and hence a small zone is affected by heat. Actually, the heating
of the surrounding material by heat diffusion is further significantly reduced by the fact that a large amount of the absorbed laser energy is carried away by the ejected material through Coulomb explosion and phase explosion. Experimentally, Ladieu et al. performed direct local thermal measurements for an impact crater on the surface of a quartz sample by depositing a series of microthermocouples onto the sample. The peak temperature was measured to be as least 3000 oC [81] at 1.2 times of the breakdown threshold fluence.
0
4
8
12
16
20
0
1000
2000
3000
4000
5000
0
2
1
T
(
oC
)
N
Figure 2.8: Evolution of temperature at r = 0, 1, 2 µm as a function of pulse number
N for repetition rate 200 kHz (Simulated with typical parameters for nanograting
inscription on the surface. Pulse energy: 90 nJ , 15% of the beam is absorbed [80]; focal spot diameter: 2.4 µm).
2.6
Incubation
During femtosecond laser interaction with transparent materials, strong field ionization promotes a great number of electrons from the valence band to the conduction band. Soon after the laser pulse, the free electrons disappear due to the recombination of the electron-hole pairs. However, a few of them may escape the recombination process. For example, some of them may be captured by structural defects or impurities, and some
laser-induced defects such as self-trapped excitons, Frenkel pairs, nonbridging oxygen hole centers, oxygen-deficient centers and E’ centers have been observed in various dielectric materials [82–89]. These defects with energy states inside the band gap can give an additional contribution to the plasma density for the next laser pulse, which eventually causes the plasma density to reach the critical density at relatively low laser intensity. In other words, the ablation threshold is reduced for the subsequent laser pulses. This is the so-called incubation effect, also termed as “N-on-one” accumulation effect.
This incubation effect occurring in metals and semiconductors [90,91] was expressed as:
FN = F1NS−1, (2.12)
where S is the incubation factor, F is the pulse fluence, and N is the number of overlapped pulses. This type of cumulative process was described in terms of thermal stress-strain energy storage [91]. However, the incubation effect of dielectric materials irradiated by ps and sub-ps pulses was shown to be related to the laser-induced defects. Accordingly, a different equation was proposed [83,92]:
FN = F∞+ (F1− F∞) exp[−k(N − 1)], (2.13) where F∞ is the fluence threshold at infinite number of shots and k is the incubation factor. In this case, the ablation threshold drops dramatically after the first shot and levels off with the increase in the number of shots. This is probably due to the saturation of the laser-induced defect concentration with the increase in the number of shots until finally reaching a constant level as pointed out by Ashkenasi et al. and Rosenfeld et
al. [83,92]. The new created laser-induced defects might be balanced by the elimination of the existed ones through laser annihilation.
This incubation effect plays a crucial role in femtosecond laser micro and nanoma-chining where the precision patterns strongly depend on the incident pulse fluence and ablation threshold, in particular laser ablation on the sample surface where the vacancy-interstitial pairs or just vacancies are much easier to produce unlike in the bulk where the probability for the recombination is much higher [93]. In chapter 4, we will present the first measurement and quantification for the incubation process in nanograting for-mation and show how the incubation effect influences the nanograting inscription in detail.
Experimental setup for nanograting
inscription
Nanograting formation on the surface of solids is essentially a laser ablation process. It strongly depends on the incident laser intensity. As will be shown in chapter 7, well-shaped nanostructures can only be made with laser intensity slightly above the threshold for nanograting formation. Any improper alignment of the experimental setup could lead to laser intensity variation on the target surface resulting in different structural modifications, i.e., the alignment for nanograting formation is very crucial. The inten-sity of the tightly focused beam should in principle be constant from pulse to pulse when it is being scanned on the surface. Hence, we applied the technique of third harmonic generation at an interface to align the experimental setup, to ensure that the focus is on the surface or at the same distance with respect to the surface during the scanning. The proper alignment is also the guarantee that the written nanogratings can be correctly characterized. In this chapter, we first briefly introduce the theoretical background of the third harmonic generation at the vicinity of interfaces by a focused Gaussian beam, and intuitively explain why the z-response curve is symmetrical and peaks at the posi-tion where the focal plane and interface are coincident. Then we use this technique to characterize the multiple refocusing and measure the critical power for self-focusing in fused silica. Finally, we introduce the experimental setup for nanograting inscription.
3.1
Brief introduction to third harmonic generation
Third harmonic generation (THG) is generally a weak nonlinear process because of the small third order nonlinear susceptibility and large phase mismatch between the pump and the signal. When a Gaussian beam is tightly focused into the bulk of an isotropic, normally dispersive and homogeneous medium, no THG signal can be observed due to the destructive interference of signals generated from the symmetric focal volume before and after the focus. This is the result of the combined effect of Gouy phase shift [94] and material dispersion. The TH energy generated before the focus is given back to the pump beam [95]. Detailed discussion will be presented later. However, when an ultrashort laser beam is focused near an interface which separates two dissimilar op-tical materials, measurable amount of TH signal is observed. This is because of the discontinuity in the materials at the interface. Soon after the observation of the THG at the vicinity of the interface [96,97], it was applied in ultrashort pulse characteriza-tion [98,99], THG microscopy [100,101], material properties measurement [102,103], optical data storage [104,105], and so on. In the following, we introduce the theoretical background for THG at an interface, and the z-response curve, which is of importance for the alignment of the experimental setup for nanograting formation.
3.1.1
Third harmonic generation using focused Gaussian beams
The wave equation that governs the qth order harmonic generation can be expressed in SI units as [95]: ∇2 ⊥Eq+ 2ikq ∂Eq ∂z =− ωq2 c2χ (q)Eq 1e(i△kz), (3.1) where∇2⊥ is given by 1r∂r∂ (r∂r∂) +r12 ∂2
∂ϕ2 in cylindrical coordinates,△k = qk1− kq is the phase mismatch and c is the speed of light in vacuum; the electric field of the focused Gaussian beam can be written in cylindrical coordinates as:
E(r, z) = A w0 w(z)exp ( −r2 w(z)2 ) exp ( ikr2 2R(z) ) exp(iΦ(z)) exp(ikz), (3.2) where A is the amplitude at the center of the beam at its waist, r is the radial distance from the center axis of the beam, z is the axial distance from the beam waist at which
z = 0, k is the wave number, w0 and w(z) = w0 √
1 + (z/zR)2 are the beam waist and the beam radius at the axial distance of z from the beam waist, R(z) = z + zR2/z is the
radius of curvature of the beam’s wavefront, and Φ(z) = − arctan(z/zR) is the Gouy phase shift, zR = kw02/2 is the Rayleigh range. For a Gaussian beam going through its
-100
-50
0
50
100
-2
-1
0
1
2
-100
-50
0
50
100
-20
-10
0
10
20
Φ
(r
a
d
)
w
(µ
m
)
z (µ m)
Figure 3.1: Beam radius and Gouy phase shift along the propagation direction for a Gaussian beam in air with 800 nm wavelength and 1.2 µm radius at the waist. The Rayleigh range is 5.7 µm.
focus, the Gouy phase shift is π from one far field to the far field on the other side of the focus as depicted in Fig. 3.1.
For theoretical analysis, Eq. (3.2) is often written in a more compact but less intu-itive form: Eω(r, z) = Aω 1 + iζ exp ( −r2 w2 0(1 + iζ) ) , (3.3)
where ζ = z/zR, Aω is the amplitude of the fundamental beam which is constant due to the constant-pump approximation and where the term exp(ikz) has been omitted. Assuming that the generated third harmonic wave has the similar form as the pump beam: E3ω(r, z) = A3ω(z) 1 + iζ exp ( −3r2 w2 0(1 + iζ) ) , (3.4)
where A3ω(z) is a function of z without considering the spatial variation in the plane perpendicular to the laser propagation direction. By substituting Eqs. (3.3) and (3.4) into Eq. (3.1), and integrating over a distance from z0 to z1, the amplitude of the third harmonic wave can thus be obtained as a function of the phase mismatch△k:
A3ω(z) =
i3ω
2n3ωc
χ3A3ωJ (△k, z0, z1), (3.5) in which the integral J takes the form:
J (△k, z0, z1) = ∫ z1 z0 ei△kz (1 + iz/zR)2 dz, (3.6)

![Figure 2.6: Timescale of the physical processes involved during the interaction of fem- fem-tosecond laser pulses and transparent materials [65].](https://thumb-eu.123doks.com/thumbv2/123doknet/7562289.229927/27.918.182.777.110.392/timescale-physical-processes-involved-interaction-tosecond-transparent-materials.webp)


![Risiko- & [und] Schutzfaktoren der psychischen Gesundheit humanitärer Einsatzhelfer : eine systematische Literaturübersicht](data:image/gif;base64,R0lGODlhAQABAIAAAP///wAAACH5BAEAAAAALAAAAAABAAEAAAICRAEAOw==)