HAL Id: hal-01846945
https://hal.archives-ouvertes.fr/hal-01846945
Submitted on 7 Nov 2019
HAL is a multi-disciplinary open access
archive for the deposit and dissemination of
sci-entific research documents, whether they are
pub-lished or not. The documents may come from
teaching and research institutions in France or
abroad, or from public or private research centers.
L’archive ouverte pluridisciplinaire HAL, est
destinée au dépôt et à la diffusion de documents
scientifiques de niveau recherche, publiés ou non,
émanant des établissements d’enseignement et de
recherche français ou étrangers, des laboratoires
publics ou privés.
Fluorine migration in a soil bed submitted to an electric
field : influence of electric potential on fluorine removal
Véronique Pomes, Maria Aurora Fernandez, Nathalie Costarramone, Bruno
Grano, Didier Houi
To cite this version:
Véronique Pomes, Maria Aurora Fernandez, Nathalie Costarramone, Bruno Grano, Didier Houi.
Flu-orine migration in a soil bed submitted to an electric field : influence of electric potential on fluFlu-orine
removal. Colloids and Surfaces A: Physicochemical and Engineering Aspects, Elsevier, 1999, 159
(n°2-3), p. 481-490. �10.1016/S0927-7757(99)00285-X�. �hal-01846945�
Fluorine migration in a soil bed submitted to an electric
field: influence of electric potential on fluorine removal
V. Pomes *, A. Fernandez, N. Costarramone
1, B. Grano, D. Houi
2 Centre Energe´tique et En6ironnement, Ecole des Mines d’Albi, Route de Teillet,81013Albi CT, Cedex09, FranceAbstract
Transport phenomena in soils submitted to an electric field are the basis of a soil decontamination technique called electromigration or more generally electrokinetic remediation. An experimental study was carried out in order to determine the influence of the applied electric potential on the most important variables for the treatment: the amount of pollutant removed and the current intensity produced. Physicochemical and transport aspects of the process are taken into account in order to prove the feasibility and the efficiency of the technique to treat a fluorine contaminated soil.
Keywords:Soil bed; Electric field; Electromigration; Electrokinetic remediation
1. Introduction
Contaminated soils are a threat to the environ-ment so, a treatenviron-ment or a confineenviron-ment of these sites seem to be necessary. Contaminated indus-trial sites close to cities represent important eco-nomic opportunities for development and, in these cases, confinement is not an available solu-tion. Treatment processes usually employed (bioremediation, venting, excavating/incineration) [15] are sometimes ineffective especially in the case of soils which have a very low hydraulic
perme-ability or which are contaminated by heavy metals.
Electrokinetic remediation is an in-situ process that is being used in the United-States and in the Netherlands [14] for the treatment of soils of very low permeability containing several inorganic (like heavy metals) or organic (like light hydrocar-bons) chemical species [2 – 21].
The implementation of electrokinetic remedia-tion is easy. It consists in inserting two electrodes in the soil and applying an electric field between them. The electric field produces the migration of chemical species towards the electrodes where the pollutant in the liquid phase is removed. This electrokinetic soil processing allows simultaneous the transport and the removal of one or several pollutants.
* Corresponding author.
1Present address: Laboratoire de Chimie Analytique,
Uni-versite´ de Pau et des Pays de l’Adour
2Present address: Institut de Me´canique des Fluides de
Several laboratory, pilot-scale, or in-situ studies have widely demonstrated the efficiency and the feasibility of the electrokinetic remediation tech-nique for the clean-up of contaminated soils [1,3,4]. However, physical and chemical phenom-ena are complex and few phenomenological stud-ies are reported in the literature. The removal of a pollutant by the electrokinetic technique is per-formed, trying to obtain a maximum amount of contaminant and consuming a minimum of elec-tricity, especially for industrial applications. The amount of pollutant removed and the current intensity produced during the treatment are de-pendent on the electric field imposed between the electrodes. The cost of soil electro-decontamina-tion is directly proporelectro-decontamina-tional to the current pro-duced during the treatment, which is dependent on the applied electric field. The aim of this work was to study the influence of the electric potential on the most important variables of the treatment: the amount of pollutant removed at the electrodes and the current produced. For this, three different electric potentials were applied between the elec-trodes of three similar electro-decontamination cells. Fluorine was the pollutant studied.
Firstly, transport phenomena during the elec-tromigration are reviewed. Then, the experimental set-up, the analysed variables, the characteristics and the composition of the soil used are presented and finally the results obtained are discussed.
2. Transport phenomena in a soil
During the soil treatment some transport and physicochemical phenomena could take place: electrokinetic, diffusion, thermal and hydrody-namic phenomena are coupled between them-selves and with chemical reactions [1]. Chemical reactions could appear between species in solution (homogeneous reactions such as complexation) or with the porous medium (heterogeneous reactions such as adsorption or ion exchange). The hetero-geneous reactions can induce other transport phe-nomena such as species diffusion in the boundary layer.
In general, thermal phenomena, transport phe-nomena and the pollutant reactivity with the
medium are the subjects of separate studies even when their coupling is identified.
The following transport phenomena presented are on the one hand electrokinetic phenomena and on the other hand more classical phenomena such as advection and diffusion.
2.1. Electrokinetic phenomena
The electric field imposed on a soil induces two type of phenomena: electrolysis reactions at the electrodes and two electrokinetic transport phe-nomena in the porous medium, electroosmosis and electromigration. The soil is usually assimi-lated with a porous medium formed by a fixed matrix and then the transport of soil particles, or electrophoresis, is not considered. When the parti-cle size is close to zero, like ions, their migration, or electromigration, is possible. In fact, for parti-cles so small, the retarding effects of their
chemi-cal environment disappear [6] and the
electromigration could be considered as a particu-lar case of electrophoresis. The electric field pro-duces the migration of the cations towards the cathode and the anions towards the anode.
In order to explain the transport of water molecules through the porous medium, caused by the electric field, or electroosmosis, several theo-ries have been proposed. The Helmoltz – Smolu-chowski theory [22] is based on the electric double layer and the zeta potential concepts. The electric field induces the motion of water on the double layer, parallel to the solid wall, as a function of the zeta potential. Then, this motion causes the transport of the pore fluid by momentum transfer. However, the measure of zeta potential is not easy in the case of media of low permeability and even then it is usually done by electrophoresis, for suspended particles, or by a streaming potential in permeable porous media. Nevertheless, the mean-ing of a such measurement in a porous medium of low permeability, submitted to an electric field, is not today clearly defined. In fact, ions orientate themselves in the medium, so charges can appear or disappear and the zeta potential of the soil can be modified.
From Darmois [7] the electroosmosis phe-nomenon is attributed to an ion hydration
differ-ence between anions and cations. Ballou [5] has compared, by several techniques, the ion hydra-tion numbers to the amount of water moved by electroosmosis, in homonionic clay. He establishes that the amount of water moved per ion dis-charged is very large compared with their hydra-tion numbers. Then, Darmois’s theory in clays does not appear satisfactory.
Casagrande [10] has proved that it is possible to determine the electroosmotic water flow in a porous medium, at a macroscopic scale. He has stated a simple law (1), valid for all soils with great precision. Water flow moved by electroos-mosis (qe) is related to the applied electric
poten-tial gradient (E) to the porous medium, the soil section (S), the porosity (n) and a constant called electroosmotic permeability (ke)
qe= keSnE with E = V/L (1)
V represents the electric potential and L is the
length of the porous medium.
This law is generally employed for the calcula-tion of electroosmotic flows in soils during an electro-decontamination process. The electroos-motic permeability coefficient has been measured for several soils of different physicochemical na-tures [9]. This coefficient is commonly considered to be constant for a given soil and equal to 5 × 10− 9m2 V− 1s− 1for an electric field applied
of 1 V cm− 1.
2.2. The transport phenomena
In addition to electrokinetic transport, other more classical phenomena such as advection and diffusion must be considered.
Casagrande’s law (1) for electroosmosis was derived from Darcy’s law (2) for hydrodynamic convection [12]. Both employ the concept of permeability.
qh= khSnH
L (2)
qh represents the water flow, kh is the hydraulic
permeability and H is the hydraulic head. The main difference being that the hydraulic permeability is due to the hydraulic head gradient
H/L whereas electroosmotic permeability is due
to the electric potential gradient V/L. In addition,
kh is a function of the particle size and of the porosity even when Ke is considered as constant for a soil [9,12].
In soils composed of coarse or medium parti-cles, water motion is essentially due to convective transport [9]. Then, the electroosmotic permeabil-ity is negligible when compared with hydraulic permeability and so, to decontaminate such soils washing is usually preferred. Electroosmosis be-comes the preponderant transport in soils of very low hydraulic permeability, such as clays. This can explain the significant water motions observed in clay soils, usually impermeable, under an elec-tric field.
The concentration gradients in the pore solu-tion induce a diffusive transport of chemical spe-cies which is independent of the electric field. The analysis of transport phenomena by characteristic time (Table 1) shows that the species diffusion is usually very slow when compared with electroki-netic transport.
Therefore pollutant recovery by diffusion is often neglected with respect to other transport phenomena. However, diffusion can be a limiting step for heterogeneous reactions, such as ion ex-change, and then it can control the recovery of the fraction of pollutant fixed in the soil. Diffu-sion is often considered as a negligible transport phenomenon, but its limiting effect on the species solubilisation can’t be neglected.
Table 1
Characteristic time scales based on a length scale of 0.01 m [13]
Transport process Chemical process
Dissociation of strong acid, 10−8s
Electromigration, 102s
Dissociation of weak acid, 10−6s
Electroosmosis, 104s
Diffusion, 105s Inorganic complexation, 10−6to
10−2s
Adsorption/ion exchange, 101to
104s
Dissolution/precipitation, 102to
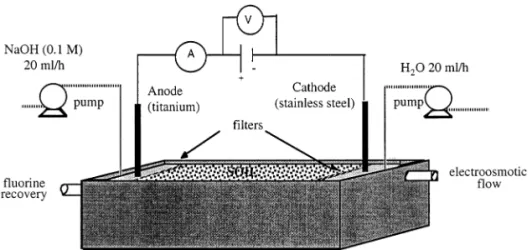
Fig. 1. Electromigration cell.
In order to study the influence of the electric potential on the most important variables for the electrokinetic treatment of a soil, three similar electro-decontamination cells were used. The cells were filled with an industrial soil polluted by fluorine [11]. Three different electric potentials were applied between the electrodes and the vari-ables measured during the experiments were the fluoride concentration at the over-flows of the cells to know the amount of pollutant removed, the current intensity to estimate the electric cur-rent consumed, and the pH of the medium to determine its chemical state. Experiments carried out and results obtained are described below.
3. Materials and methods
3.1. Experimental set-up
Fig. 1 shows the electroremediation cell used (dimensions are 4 × 4 × 50 cm3). This cell was
made of PVC and closed with a cover in order to avoid water evaporation. At each end of the cell, two compartments contained the 3.5 cm square electrodes, being the titanium anode and the stainless steel cathode. Two polyamide filters guaranteed the separation between the soil and each electrolytic compartment. These were equipped with overflows and were supplied with reagents by peristaltic pumps which delivered a flow of 20 ml h− 1. The anode was supplied with
NaOH (0.1 M) and the cathode with distilled water. Two multimeters allowed the measurement of the current intensity produced in the circuit and the electric potential between the electrodes which was provided by a constant voltage genera-tor of 0 – 150 V.
The control of the pH of the medium and the solubility of the fluorine was allowed by the addi-tion of reagents at the electrodes. Water electroly-sis reactions are also dependent on the pH of the medium: At the cathode: 2H3O++ 2e−lH 2+ 2H2O pHB7 (3) E°(H 3O+/H2)= 0 V at pH 0 2H2O + 2e−lH 2+ 2OH− pH]7 (4) E°(H2O/H 2)= − 0.42 V at pH 7 E°(H2O/H 2)= − 0.84 V at pH 14 At the anode: 3H2Ol2H3O++ 1/2O2+ 2e− pH57 (5) E°(O2/H2O)= 1.23 V at pH 0 E°(O2,H2O)= 0.81 V at pH 7 2OH−lH 2O + 1/2O2+ 2e− pH\7 (6) E°(O 2/OH−)= 0.39 V at pH 14
The fluorine electromigration is only possible if it is an ionic species in the liquid phase. For the system studied, the pH necessary for fluorine des-orption must be superior to 11 [11]. Therefore, it
is necessary to maintain this pH condition in order to allow the fluoride migration towards the electrodes. This pH will determine the electrolysis reactions: at the anode, the addition of sodium hydroxide promotes reaction (6) and prevents the formation of H3O+ ions which can migrate
to-wards the cathode and cause an acidification of the soil; at the cathode, the addition of distilled water promotes reaction (4) and impose a basic pH by the formation of OH− ions. These migrate
towards the anode and promote the evolution of the medium to a basic pH.
Water electrolysis reactions follow the quantita-tive Faraday’s law (7). It permits the calculation of the amount of water produced or consumed at the electrodes [23], necessary to verify the mass balances and to determine flows at the electrodes.
N =It
zF (7)
N denotes the number of moles of substances
consumed or produced at one electrode, I is the total courant intensity at the interface electrode/ solution, t represents the duration of the electroly-sis, z quantifies the number of electrons included in the electrochemical system and F is the Fara-day’s constant.
3.2. The soil
The characteristics and the composition of the soil chosen for the study are summarised in Table 2. This soil naturally contained fluorine mainly in the CaF2 form, and fluoride concentrated solid wastes originated by industrial activity [11]. The complete elimination of the fluorine could not be attained because of the possible destruction of the medium.
3.3. Measurements
The analysed variables were pH, flow and fluoride concentration at the over-flows, electric potential and current intensity.
Measurements of pH were performed by intro-ducing the electrode of a pH meter into the soil. Determination of volume of solution at the over-flow was made by weighing, and the fluoride removed at the over-flow was titrated with a specific electrode. Electric potential differences were measured in the soil between the anode and a movable electrode which was displaced through-out the whole cell. For this, a metal rod and a multimeter were used while a second multimeter, in the circuit, allowed the measurements of the current intensity produced during the treatment.
3.4. Method
For the experimental study, 0.9 kg of soil and 0.257 l of NaOH (0.01 M) were mixed manually and put into the central part of the cell upon which the cover was placed. This was easily re-moved to allow the measurements. The sodium hydroxide was used to saturate the soil and to induce electrolysis reactions (4) and (6) at the electrodes. In addition, the electric conductivity of the medium was increased by the Na+ and OH−
ions added to the soil.
Three electric potentials were applied between the electrodes of the three cells: 25 V for the C25 cell, 50 V for the C50 cell, 75 V for the C75 cell. Once a day, pH and electric potential measure-ments are performed in the soil at different posi-tions. During the pH measurements, the electricity generator was switched off in order not to disturb
Table 2
Composition and characteristics of the soil 65% Organic matter 5.3% Total iron 2.6% Total calcium Carbonates Negligible
Total fluorine 9×10 kg kg−1of soil
0.217 g kg−1of soil
Fluorine removed by washinga
C.E.C.b 0.033 eq kg−1of soil
(Cationic exchange capacity)
0–2 mm Particle size
Specific surface 9580 m2kg−1
Soil dry density 1670 kg m−3
0.32 Porosity 28.55% Water content Saturation degree 0.99 aAFNOR X31-210 [19]. bAFNOR X31-130 [18].
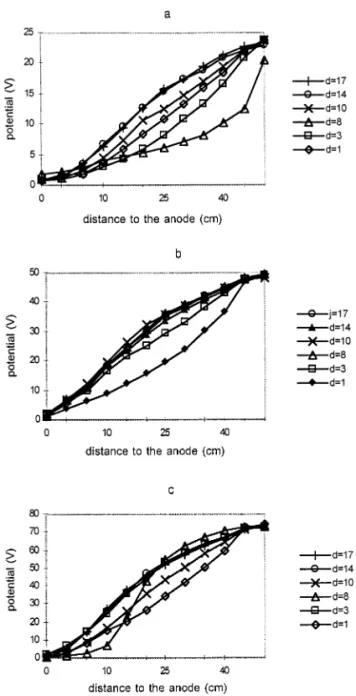
Fig. 2. Evolution of the electric potential distribution, mea-sured in the cells. (a) cell C25; (b) cell C50; (c) cell C75.
tion to be followed during the treatment in the medium.
4. Results and discussion
4.1. Electric potential distribution
Fig. 2 shows that the electric potential profiles, observed along the electromigration cells, can be assumed linear from the first day of the treatment. The electric potential gradient, in each cell, is considered constant and equal to 0.5, 1 and 1.5 V cm− 1, when electric potentials of 25, 50 and 75 V
are applied, respectively. It is interesting to note that the measured electric potential gradient is the ratio between the tension applied at the electrodes and the total length of the cell.
4.2. E6olution of soil pH
Fig. 3 shows, for the three cells, the advance with time of the pH front from the cathode to the anode whatever the electric potential applied. The soil pH becomes gradually basic even though initially it was close to 5 in every cell. Finally, the soil has a similar and homogeneous pH in all the cells, the only difference being the front advance rate which is slower for cell C25. The greater the electric potential applied between the electrodes is significant, the more rapidly the front advances towards the anode.
After 17 days, the pH in cells C50 and C75 is similar and homogeneous but not in cell C25 because of the slower front advance. In this case, all the medium is not at the basic pH necessary for fluorine solubilisation. The electromigration treatment on the C25 cell was carried on up to 39 days [11], in order to attain the similar homoge-neous pH obtained in cells C50 and C75 (Fig. 3(a)). The pH front advance is a function of the applied electric potential and so, in order to attain the complete pollutant solubilisation in a time defined and to have a chemical pseudo steady state, an threshold electric potential must be ap-plied between the electrodes.
In the electrolyte compartments the pH is al-ways basic, at the cathode due to electrolysis and the pH meter. In addition, the solution removed
at each over-flow was weighed and about 50 ml of solution was drawn out to determine electroos-motic flow and to perform the fluoride titration. For the measurement of fluoride concentration by a specific electrode, pH values must be between 4 and 8 in order to avoid fluoride complexation and interference of OH− ions. Mass balances and the
migra-at the anode due to reagent supply. The stopping of the NaOH supply between the 4th and the 8th day in cells C25 and C75 has produced an acidifi-cation of the soil near the anode. In fact, the electrolysis reaction (6) was not promoted and reaction (5) has taken place producing H3O+
ions.
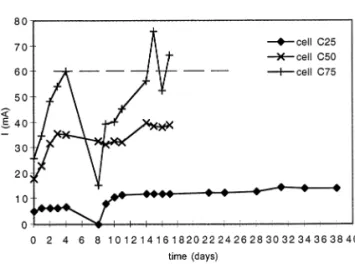
Fig. 4. Evolution with time of the current intensity produced during the treatment measured in the cells.
Fig. 3. Evolution of soil pH: (a) cell C25; (b) cell C50; (c) cell C75.
4.3. E6olution of the current intensity
Fig. 4 represents the evolution of the current intensity measured in the circuit during the treat-ment. From the 4th to the 8th day, cells C25 and C75 were not supplied with reagents producing a sudden decrease of the current intensity which is caused by the ion depletion in the medium. The broken line shown to Fig. 4 does not correspond with experimental data, but could represent the theoretical evolution of the current intensity with-out the anomaly which occurred between the 4th and the 8th day.
The evolution of the current intensity seems to depend on the chemical conditions of the medium. Figs. 3(b) and 3(c) show that the soil is at a constant pH after 14 days in cells C50 and C75 and after day 31 in cell C25 as is shown on Fig. 3(a). In these conditions a pseudo steady state is attained and the current intensity remains constant in cells C25 and C50 and it fluctuates around an average value in cell C75.
The average values of the current intensity at the pseudo steady state are close to: 14.17 mA for 0.25 V cm− 1(average from the 31st to 38th days);
38.88 mA for 1 V cm− 1(average from 14 to 17th
days); 62.71 mA for 1.5 V cm− 1(average from 14
to 17th days). The response of a substance to an electric field applied is by definition the conductiv-ity k:
k=j
E
with j the electric current density:
j =I S
So, the conductivity can be related to the electric current by:
k= I
SE
A substance obeys Ohm’s law when its conductiv-ity is independent of the value of the applied electric field [17]. So, for a substance which obeys Ohm’s law, the plot of the electric current density as a function of the electric potential must be a straight line, the slope of which is the conductivity.
Using the attained values of current intensity at the pseudo steady state, the electric current den-sity of the soil can be calculated for each electro-migration cell. Fig. 5 shows that the soil conductivity remains constant at a value of 3.266 mS cm− 1 for every potential applied. This can
demonstrates that, in the pseudo steady state, during an electro-decontamination, a soil obeys Ohm’s law.
Under these conditions, the existence of a soil conductivity independent of the electric field al-lows an estimation of the cost of the process, which is a function of the electric current pro-duced during the treatment, and that can be easily estimated from the applied electric field.
However, cell C25 did not reach the pseudo steady state at the same time as the other cells and 23 days more were needed. An threshold electric potential, applied to the electromigration cell, seems to be necessary to overcome the viscosity and the interionic forces.
4.4. Fluorine remo6ed from the soil
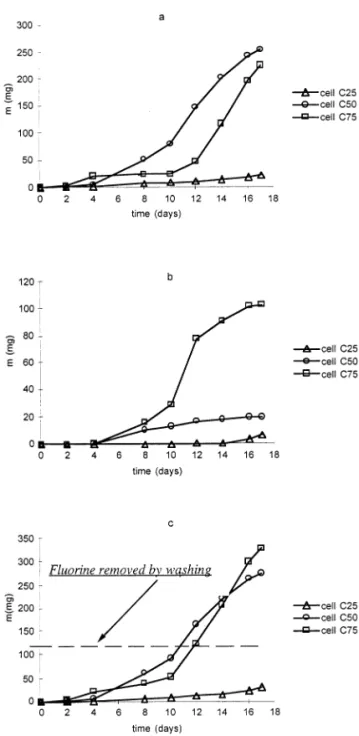
Fluoride recovered at the anode (Fig. 6(a)) involves electromigration as the transport mecha-nism while at the cathode (Fig. 6(b)). Fluorine is removed by electroosmosis as fluoride or other soluble species such as fluorine complexes. The sense of electroosmotic flow depends on the zeta potential of the medium. At a basic pH the sur-face charges of the particles are negative and the zeta potential is negative too so, under these conditions electroosmotic flow is towards the cathode.
The broken line shown in Fig. 6(c), which represents the cumulative mass of fluorine recov-ered from the soil, indicates the amount of fluorine removed by washing which is listed in Table 2. The electromigration, after 17 days of treatment, allows the recovery of 1.8 times more fluorine than by washing (normalised process [19]).
The amount of fluorine recovered at the anode during the first days of the treatment is not signifi-cant, but this increases quickly from the 12th day for cells C50 and C75. It is also from the 12th day that all soil of cells C50 and C75 reaches the pH of maximum solubilisation of the fluorine as it was shown in Figs. 3(b) and 3(c). Recovery of fluorine in cell C25 is not significant for the same duration of treatment but, as was shown in Fig. 3(a), the soil has not attained a pH equal to 11 the 17th day. The fluoride in this cell remains, for the most part, solid adsorbed on the soil particles. In addition if the soil is not supplied with chemical reagents, pH conditions are not controlled so, they will depend on the electrolysis reactions.
Fig. 5. Evolution of the electric current density with the electric potential gradient.
Fig. 6. Cumulative mass of fluorine removed in the effluents: (a) fluorine at the anode; (b) fluorine at the cathode; (c) total fluorine.
5. Conclusion
The experimental study realised has shown that pollutant and soil chemical interactions must be well controlled to obtain an efficient electro-de-contamination. In fact, species migrate only if they are in solution so, the pH solubilisation of these species needs to be controlled by the addi-tion of reagents at the electrodes. In this way, we note that it is only when all of the medium has favourable pH conditions that the amount of fluorine recovery becomes significant.
In addition, an threshold electric field is neces-sary to promote the electrokinetic remediation. But, too high an electric potential increases the cost of the electro-decontamination because of the large current intensity produced in the medium. Soil conductivity is the ratio between electric cur-rent density and the electric potential gradient, which is constant for a soil at constant chemical conditions. From this the cost of the electro-de-contamination technique is easily estimated since, at the pseudo steady state, the current intensity remains at a stable value.
However, the use of a natural soil make the knowledge of pollutant-soil interactions and the analysis of transport phenomena, difficult. Under these conditions the use of a well known soil model would allow a precise study of transport mechanisms, necessary to model the process. Ex-periments have shown that the proposed electro-migration cells can be used to study transport phenomena but some problems, such as the difficulty in controlling the porosity or the signifi-cant evaporation, must be avoided. Other types of electromigration cells are reported in the literature [3,20,22]. These cells seem better because the con-trol of the physical properties of the soil (porosity and water content) is possible.
List of symbols
E electric potential gradient (V m−1)
electrode normal potential (V)
E°
F Faraday s constant, F = 96484 C mol−1
hydraulic head (Pa)
H
H/L hydraulic head gradient (Pa m−1)
Acid or basic pH fronts could appear in the soil and the pollutant could remain accumulated by adsorption or precipitation, or its sense of migra-tion can be reversed by a change of its chemical form [16].
Results obtain for cell C25 show that too small an applied electric potential gradient does not promote the electrokinetic phenomena.
I total current intensity at the interface electrode/solution (A)
j electric current density (A m−2)
conductivity (S m−1)
k
ke coefficient of electroosmotic permeabil-ity (m2 s−1 V−1)
kh hydraulic permeability (m2 Pa−1s−1)
L length of the porous medium (m)
cumulative mass (mg)
m
n porosity
number of moles of substance
con-N
sumed or produced at one electrode (mol)
qe electroosmotic flow (m3 s−1)
water flow (m3 s−1) qh
section of porous medium (m2) S
duration of the electrolysis (s)
t
V electric potential (V)
z number of electrons included in the electrochemical system
References
[1] Y.B. Acar, J. Hamed, Electrokinetic soil processing in remediation/treatment; synthesis of available data. Energy and Environmental Issues, Bull. Transportation Research Record 1312 (1992) 153 – 161.
[2] Y.B. Acar, H. Li, R.J. Gale, Phenol Removal from Kaolinite by Electrokinetics, ASCE J. Geotech. Eng. 118 (1992) 1837.
[3] Y.B. Acar, R.J. Gale, A.N. Alshawabkeh, R.E. Marks, S. Puppala, M. Bricka, R. Parker, Electrokinetic Remedia-tion: Basics and Technology Status, J. Hazard. Mater. 40 (1995) 117 – 137.
[4] Y.B. Acar, A.N. Alshawabkeh, Electrokinetic Remedia-tion. I: Pilot-Scale Tests with Lead-Spiked Kaolinite, J. Geotech. Eng. 112 (3) (1996) 173 – 185.
[5] E.V. Ballou, Electroosmotic Flow in Homonionic Kaolin-ite, J. Colloid Sci. 10 (5) (1955) 450 – 460.
[6] S. Blanco, Me´canisme de Se´paration des prote´ines par e´lectrophore`se. Mode´lisation et Analyse de Sensibilite´. PhD Thesis, Universite´ Paul Sabatier, Toulouse, France, (1996).
[7] M. Bonnemay, J. Royon, Electroosmose. Techniques de l’Inge´nieur. D912 1-12 (1974).
[8] C.J. Bruell, B.A. Segall, M.T. Walsh, Electroosmotic Removal of Gasoline Hydrocarbons and TCE from Clay, J. Environ. Eng. 118 (1) (1992) 68 – 83.
[9] H. Cambefort, C. Caron, Electroosmose et Consolidation Electrochimique des Argiles Geotechnique. (1961). [10] L. Casagrande, Electroosmosis in soils, Geotechnique. 1
(3) (1949) 159 – 177.
[11] N. Costarramone, Mise en Oeuvre au Laboratoire et au Stade Pilote de la Decontamination Electrocinetique d’un Sol, dans le cas d’une Pollution Fluore´e. PhD Thesis, Universite´ de Pau et des Pays de l’Adour, Pau, France, 1996.
[12] E. Guyon, J.-P. Hulin, L. Petit, Hydrodynamique Physique. InterEditions/Editions du CNRS (1991). [13] R.A. Jacobs, R.F. Probstein, Two-Dimensional Modeling
of Electroremediation, AIChE J. 42 (1996) 6.
[14] R. Lageman, Electroreclamation: Applications in the Netherlands, Environ. Sci. Technol. 27 (13) (1989) 2648 – 2650.
[15] P. Lecomte, Les Sites Pollues: Traitement des sols et des eaux souterraines. Technique et Documentation, Lavoisier, Paris.
[16] S. Lesoin, Migration cationique et anionique des metaux toxiques (plomb, chrome, zinc) dans les sols sous l’effet d’un champ electrique. PhD Thesis, Ecole Nationale des Ponts et Chaussees, France, 1997.
[17] I.N Levine, Physical chemistry, McGraw Hill, Mexique, 1978.
[18] NORME AFNORX31-130 may (1993) [19] NORME AFNORX31-210 september (1988)
[20] Pamucku, S., Khan, L.J. and Fang, H.Y. Zinc, Teoxifica-tion of Soils. Bull. TransportaTeoxifica-tion Research Record, N° 1288, Soils Geology and Fundations, Geotechnical Engi-neering. 41 (1990).
[21] S. Pamucku, J.K. Wittle, Electrokinetic Removal of Se-lected Heavy Metals from Soil, Environ. Prog. 11 (1992) 3.
[22] A.P. Shapiro, P.C. Renaud, R.F. Probstein, Preliminary Studies on the Removal of Chemical Species from Satu-rated Porous Media by Eleckoosmosis, PCH Physico Chemical Hydrodynamics. 11 (5-6) (1989) 785 – 802. [23] B. Tremillon, Electrochimie Analytique et Reactions en
Solution, TOME 2, Reactions et Methodes Elec-trochimiques, Masson, 1993.