HAL Id: hal-02883683
https://hal.mines-ales.fr/hal-02883683
Submitted on 25 May 2021
HAL is a multi-disciplinary open access
archive for the deposit and dissemination of
sci-entific research documents, whether they are
pub-lished or not. The documents may come from
teaching and research institutions in France or
abroad, or from public or private research centers.
L’archive ouverte pluridisciplinaire HAL, est
destinée au dépôt et à la diffusion de documents
scientifiques de niveau recherche, publiés ou non,
émanant des établissements d’enseignement et de
recherche français ou étrangers, des laboratoires
publics ou privés.
Fire behaviour of electrical cables in cone calorimeter:
Influence of cables structure and layout
Carcillo Magalie, Caro Anne-Sophie, Sonnier Rodolphe, Laurent Ferry, Gesta
Emmanuelle, Lagrève Christian
To cite this version:
Carcillo Magalie, Caro Anne-Sophie, Sonnier Rodolphe, Laurent Ferry, Gesta Emmanuelle, et al.. Fire
behaviour of electrical cables in cone calorimeter: Influence of cables structure and layout. Fire Safety
Journal, Elsevier, 2018, 99, pp.12-21. �10.1016/j.firesaf.2018.05.001�. �hal-02883683�
Fire behaviour of electrical cables in cone calorimeter: In
fluence of cables
structure and layout
Carcillo Magalie
a,b, Caro Anne-Sophie
a, Sonnier Rodolphe
a, Ferry Laurent
a,∗, Gesta Emmanuelle
b,
Lagrève Christian
baC2MA, IMT Mines Ales, Univ. Montpellier, 6 Avenue de Clavières, 30319, Ales Cedex, France bACOME, Centre de Mortain-Romagny, B.P. 45 50140, Mortain, France
Keywords:
Wire and cableflammability Fire performances prediction Cone calorimeter Cable design
A B S T R A C T
Thefire performances of small telecom halogen-free cables were measured using cone calorimeter by changing several test conditions (heatflux, number and spacing of cables) and cable properties (sheath thickness and insulation mass). An analytical phenomenologicalfitting was proposed to predict accurately main fire perfor-mances (time-to-ignition, peaks of heat release rate and time to peak of heat release rate) from a set of 42 tests. The phenomenological model also assesses quantitatively the influence of different test conditions and cable properties. It appears that time-to-ignition is only dependent on heatflux. Moreover the influence of sheath is pointed out to delay the occurrence of the main peak of heat release rate corresponding to the decomposition of non-flame retarded insulation. The fitting allows better predicting the fire hazard in case of cables burning.
1. Introduction
In thefire statistics, electrical appliances are one of the main sources offire. In such fires, the first ignited component is the insulation around wires and cables. From 2003 to 2005, 46% of US electrical fires are caused by electronic wiring, and 350 lives each year are lost because of old unsuitable wires [1]. The same conclusions can be made for the European Union, and in order to protect installations and people, new regulations concerningfire safety were developed. In European Union, cables used in buildings are covered by the Construction Product Reg-ulation since 2013. To be ready for the CE marking cables have to pass reaction tofire tests as the scale flame test EN50399. Those large-scale tests are time-consuming and so, very expensive. Therefore, one alternative is to determinefirst the fire behaviour of these cables with laboratory-scalefire tests. If those tests are promising, large-scale fire tests are run to properly classify the cables.
Before being rated through large-scale tests, cables and more espe-cially sheath materials are often assessed using small-scale lab tests such as Limiting Oxygen Index (LOI) [2], cone calorimeter [3–11], thermal analysis [9,12,13] and more recently microscale calorimeter (MCC) [14–18]. Other less conventional small and intermediate scale tests or methods have been also developed and used [19–24]. With regard to LOI, a common statement reports that cable sheathing ex-hibiting LOI value over 30 enables cables to meet most of large scale tests [2]. However the authors highlighted that correlation between
small and large scale tests is poor because cable tests depend on other parameters than the sheath properties (i.e. inner layer, cable layout…). MCC was developed to assess theflammability of polymers using only few milligrams of material. This technique has been already used to study the burning properties of materials composing cable sheath [16–18]. Correlations between MCC data and conventional flamm-ability tests for wire and cable compounds have been investigated [14,15]. Cogen et al. studied correlation between MCC and flame spread tests performed on seven halogen-free FR compounds used for cable sheathing. Temperature at pHRR measured by some PCFC data can supply rough indication forflame spread test ranking. However correlation between absolute values remains poor because cable structure cannot be taken into account [15].
Cone calorimeter is a bench-scale equipment that was demonstrated to be relevant to estimate the full-scalefire behaviour of various pro-ducts including cables [3,4,25]. Hirschler [26] and afterwards Barnes [6,7] investigated the behaviour of a series of 21 electric cables ex-hibiting the same layout but differing only by the composition of their sheath or insulation using the cone calorimeter test (ISO 5660) and the large-scale tests (ASTM D5424, FT4 protocol). A good correlation was observed between the two tests regarding peaks of HRR data for cables passing the large-scale test. On the contrary, a wide dispersion was noted for cables that failed the large-scale test. Coaker et al. [5] found a good correlation between full scale cable tray tests and cone calori-meter, both in terms of heat and smoke release, in the case of various
∗Corresponding author.
E-mail address: laurent.ferry@mines-ales.fr(F. Laurent).
cables containing vinyl compounds. The correlation was particularly good using low external heat flux, i.e. 20 kW/m2. Afterwards further studies confirmed that cone calorimeter was a powerful test to in-vestigate the fire behaviour of cables [8,27,28]. Hence works were carried out to develop test procedures aiming at supplying good prac-tice when using this instrument for cables [29,30].
The cable structure and layout are important parameters that may influence the development of a fire and thus the fire hazard. Cone ca-lorimeter is likely to enable testing such parameters. However, only few papers can be found in the literature on this topic. Concerning cable layout, Eliott and Whiteley studied small diameter wires with different tests design inside the sample holder of the cone calorimeter [31]. Cables were randomly or symmetrically wrapped and arranged in one or several layers. Two configurations seemed to be repeatable enough, economical both in terms of amount of sample and time for prepara-tion, permitting data analysis: a single layer of parallel touching cables, and a configuration with repetitive touching units of seven twisted cables. This last design was possible because of the flexibility of the studied cable. Other research groups studied power cables, commu-nication cables, data cables and wires thicker than the previous work of Eliott and Whiteley. They mainly studied the combustion of these electric cables with a position side by side, the number of tested cables was driven by the outer diameter of the cable [3,8,27]. Meinier et al. studied the role of spacing in thefire behaviour of large halogen-free cables in cone calorimeter [11]. They found that spacing has a sig-nificant (but not linear) influence on the whole HRR curve.
With regard to cable structure, Rao et al. studied thefire behaviour of cables exhibiting various outer sheaths and constructions (number of outer layers, layer thickness) [32]. All these parameters were shown to have an effect on the cone data and HRR curve. The same research group evidenced that the sheath thickness influences the burning time and the smoke production that were shown to vary almost linearly with thickness [33]. As explained above, not only the sheath material but also the other components and the cable structure itself have a sig-nificant influence on the fire behaviour [9,30]. Meinier et al. [11] showed that thefire hazard increases significantly when the inner part (generally nonflame retarded polyethylene) starts pyrolyzing. Hence the role of the inner components should not be neglected. Gallo et al. [34] used a new test based on the cone calorimeter equipment where the cone heater was replaced by a burner and a portion of cable tray in vertical position was tested. They evidenced that the HRR curve of the entire cable can be predicted from the curve of its different components. Finally test conditions, and especially heatflux, have an important effect on cable flammability. Generally, ignition occurs earlier and heat release rate is higher when heatflux increases [10,28,33]. Nevertheless, a more specific effect was found by Meinier et al. [11]. Indeed, a heat flux threshold is needed to promote the burning of the inner insulation part of cables. Below this threshold, only the sheath is decomposing and the heat release is limited. But above this threshold, non-flame retarded insulation burns leading to much higher heat release.
In this paper, the role of cable structure and cable layout on thefire behaviour of a series of relatively thin halogen-free cables was thor-oughly investigated. The burning behaviour of cables was studied using cone calorimeter and described thanks to four representative proper-ties. An analyticalfitting was proposed to predict the main flammability properties of cables taking into account the respective influence of each parameter investigated.
2. Materials and methods 2.1. Cables
The samples used in this study were telecom cable-types provided by ACOME, cable, wire and synthetic tubes manufacturing French company.Fig. 1andFig. 2describe the global structure of the studied wires, in which different parameters can differ (the sheath thickness and the insulation mass).Table 1lists the different cables used in this
publication. These cables are halogen-free ones. The sheath material is based on EVA and PE matrix filled with high amount of aluminium trihydroxide (ATH). The insulation is pure polyethylene. It does not contain any flame retardant species. More details about the exact composition are confidential.
2.2. Cone calorimeter
The study of cablefire performances was inspired by the ISO 5660-1 standard with Cone Calorimeter provided by Fire Testing Technology Limited [35]. Different heat fluxes were used: 25, 50, 80 kW/m2. Some
additional tests at heatfluxes of 35 and 65 kW/m2were also used. Tests
were carried out in air under well ventilated conditions (airflow rate 24 L/s), with a piloted ignition and were repeated at least three times. An adapted setting was used for the cables in the sample holder as shown inFig. 3. The samples were positioned horizontally, attached to a grid with a mesh size of 2 cm × 2 cm and a wire diameter of 2 mm. Abbreviations
A, B, C, D, E names of cables (from cables of house telecom net-work)
S sheath thickness (mm)
I insulation mass presents in one cable (g) N number of cables in the sample holder d density of cables
HF heatflux of cone calorimeter tests (kW/m2) HRR heat release rate (kW/m2)
EHC Effective heat of combustion (MJ/kg) MLR Mass Loss Rate (g/s)
TTI time of ignition (s)
Δt time difference between time of ignition and time of pHRR1 (s)
pHRR0 first peak of heat release rate (kW)
pHRR1 second and biggest peak of heat release rate (kW)
X _α Y _ HF β the cable X is tested. α Number of cables are used in the test
Y is the configuration of cables in sample holder
T configuration of cables that are assembled together without any space between them
Sω configuration of cables when ω spaces separate each cable. The heatflux of the cone is equal to β kW/m2
Z* quotient for parameter Z of a test divided by the parameter Z for the reference test A_6 sp1D_HF50
The cables were disposed in the sample holder in different ways. Dif-ferent amounts of cables were tested with different spacing separating each cable.Tables 2 and 3show the different layouts tested with the cone calorimeter device.
Each test is called according to the following label: X_α Y_HF β where X is the tested cable,α the number of cables, Y is the config-uration of cables in sample holder,β the heat flux. T corresponds to a
tight layout (no spacing between cables). Sω corresponds to a loose configuration where spacing between cables is ω times the cable dia-meter. As an example,Fig. 4shows the HRR curve of the reference test of this publication, A_6S1_HF50. In this test the cable A is used in a configuration 6S1 with 6 cables separated from each other by one cable diameter. The configuration 6S1 allows to test the maximum number of cables (6) with the spacing between cables defined by the European EN50399 standard, which is one of the most important standard forfire tests on cables. The heatflux 50 kW/m2 is widely used at the cone
calorimeter as the reference heatflux to study materials, within the range of external irradiance given in the ISO 5660-1 standard.
The fire performances that were extracted from the curve and considered for analysis are the following:
◦ Time of ignition named TTI in second
◦ First peak of heat release rate named pHRR0 in kW ◦ Highest peak of heat release rate named pHRR1 in kW
◦ Time between the time to ignition and the time at pHRR1 (Δt) in second
For convenience of further analysis, it was chosen to consider the raw heat release rate expressed in kW. This type of HRR curve was also observed during the European FIPEC project [29]. According to Rao Fig. 2. Description of the reference cable (cable A).
Table 1
Main characteristics of studied cables.
Cables A B C D E
Material characteristics Cable diameter (mm) 7.4 7 7.7 7 7 Sheath thickness S (mm) 0.55 0.48 0.7 0.5 0.5 Insulation mass per cable I (g/m of cable) 7 7 7 5.8 5.5
Copper mass per cable (g/m of cable)
19.4 19.4 19.4 21.6 19.3
Mass fraction of the components of the cables (%) Sheath 38 34 44 34 36 Insulation 15 15 13 12 13 Copper 40 43 36 47 43 Aluminium foil and polyamide filament 7 8 7 7 8
Fig. 3. Samples of cables attached to a grid– aluminium folder is placed be-tween the grid and the sample holder.
Table 2
List of the cone calorimeter tests inputs.
Cable Configuration Number of cables (N) Density of cables (d) Sheath thickness (S) (mm) Mass of insulation (I) (g/m of cable) HF (kW/m²) A 6S1 6 0.5 0.55 7 25 35 50 65 80 B 0.48 25 35 50 65 80 C 0.7 25 35 50 65 80 D 0.5 5.8 25 50 80 E 5.5 25 50 80 A 3T 3 1 0.55 7 25 50 80 6T 6 25 50 80 12T 12 25 50 80 3S1 3 0.5 25 50 80 3S2 0.33 25 50 80 3S3 0.25 25 50 80 3S4 0.2 25 50 80
et al., cables show multiple peaks of HRR attributed to the sequenced combustion of the different materials used in the construction of cable. This delay occurs due to a masking effect of the aluminium layer [33]. Braun et al. explained that cables burn in stages (implying multiple pHRR) in function of the layer of the cable assembly actually burning [3]. This hypothesis will be argued in the result section.
2.3. Phenomenogicalfitting
For fitting purposes, the cone calorimeter results (TTI, pHRR0,
pHRR1andΔt) were compiled in this publication as noted in equation
(1):
= =
Yexp [TTI, pHRR0, pHRR Δt1, ] [Yexp 1, Yexp 2,Yexp 3,Yexp 4 (1)
Sincefive experimental and material parameters were varied during the experiments, they are used as variables to describe thefire perfor-mances. Parameters can be divided in three categories: (i) test condition parameters namely the heatflux HF, (ii) layout parameters namely the number of cables tested N and the density of cables d, (i.e. the per-centage of cable in the repetitive layout, as explained inFig. 5), (iii) material parameters, or cable properties namely the sheath thickness S and the insulation mass for one cable I.
In order to equally estimate the influence of each parameter, nor-malised parameters are developed following equation(2). For each test α, they represent the parameter value of the test α divided by the corresponding parameter value from the reference test A _ 6S1 _ HF50:
= ∗ Z Z Z test α test α A S HF6 1 50 (2)
Each parameter HF, N, d, S and I can influence the fire performance, but not necessarily with the same intensity. To take this observation into account, a given fire performance Ynumwas assumed to be
de-pendent of each parameter according to a power law. The coefficients
α β γ δ ε, , , , , are the exponents respectively assigned to HF, N, d, S and I. From a numerical point of view, the coefficients quantify the influence of each parameter. Since the resultant function
∗ ∗ ∗ ∗ ∗
HFα.Nβ.dγ.Sδ.I ε is dimensionless with values between 0 and 3
(experimental observation), the number‘a’ corresponds to the value of Ynumobtained for the reference test and is close to Yexp.
= ∗ ∗ ∗ ∗ ∗
Ynum( , ,a α β γ δ ε, , , ) a HFα.Nβ.dγ.S δ.Iε( , ,a α β γ δ ε εR, , , ) 6 (3) In order to identify thefittest value of the coefficients, the gap be-tween experimental (eq.(1)) and numerical results (deduced from eq.
(3)) was computed via a cost function (denoted J in equation (4)) written as the squared 2-norm for each property to be predicted (i.e. TTI, pHRR0, pHRR1andΔt): Name of the configuration Number of cables tested (N) Spacing between each cable* Picture 12T 12 0 6T 6 0 3T 3 0 6S1 6 1 3S1 3 1 3S2 3 2 3S3 3 3 3S4 3 4
Fig. 4. Heat release rate of the reference test, where the cable A was tested in a configuration of 6 cables with a spacing equal to one cable diameter between each cable at 50 kW/m2, test noted A _ 6 S1 _ HF50.
Fig. 5. Definition of the parameter density d. Table 3
Configurations of experiment.
*spacing ω means that two cables are separated by a spacing of ω cable diameters.
(4) Thus the minimization problem given by
= ⋅ = ⎡ ⎣ ⎢ +∞⎡ ⎣ ⎢× − J a α β γ δ ε i min ( , , , , , ), 1,2,3,4 Φ 0, [ 3,3] a α β γ δ ε ε i ( , , , , , ) Φ 5 (5) was solved.
Equation(5)was solved using Matlab®software with a constrained Levenberg Marquardt algorithm, which is rather classical in the lit-erature for solving identification problem. It is an algorithm destined to estimate least-squares of non-linear parameters [36]. Unless this pro-blem is highly nonlinear, solutions were reached after 10 iterations with a satisfactory coefficient of determination R2as developed in the
results and discussion section, independently of the initial parameters values.
As for the experiments, all the cone calorimeter tests inputs are listed inTable 2.
3. Results and discussion
Tables 4 and 5present the main cone calorimeter results for all the tests carried out. The reported values are the average of at least 3 tests. The phenomenological model described in part 1.3 was successfully applied to this set of experimental data. The bestfitted values of the coefficients are given inTable 6. In fact, goodfits were found between experimental and calculated values, as evidenced by satisfying R2
va-lues.
In the following, we will discuss separately each main output of the phenomenological model, namely TTI, pHRR0, pHRR1 andΔt. For in-formation, it can be considered that a parameter Z has a negligible effect on a fire performance Y if the variation of Ynumwithin the studied
range of Z* is lower than 15% which is the higher experimental stan-dard deviation observed (seeTables 4 and 5). Taking into account that Z* varies at most between 0.4 and 2 (seeTable 5), the variation of Ynum
is lower than 15% if the exponent of the power law is lower than 0.2. 3.1. Influence of test parameters on TTI
According to thefitting, the time to ignition can be predicted using equation (6). Fig. 6shows the good agreement between the experi-mental and predicted TTI values.
= ∗− ∗ ∗ ∗−
TTI 42.25 [HF 2.N0.1.d0.01.S 0.3] (6) Equation(6)points out that the main influent exponent is the one
associated to HF. The absolute values of coefficients associated to other parameters are much lower.
So it appears that only the heatflux significantly influences the time to ignition. Moreover, the TTI linearly depends on HF−2. In literature, the time of ignition was described and predicted with materialfire properties and the experimental settings for thermally thick sheets (equation(7)) [37]. = − TTI π k ρ c T T HF 4( . . ) ( ) p ig 02 2 (7)
with k the thermal conductivity of the material,ρ the density, cpthe
specific heat, Tigthe ignition temperature, T0the ambient temperature.
The heatflux has to be high enough to ignite the cable.
In conclusion, the simulation gives the same power law as in the physical model. It means that the cables are thermally thick [37–39]. Since their diameter is close to 7 mm, this result appears reasonable. Braun et al. made the same conclusion cables twice as big as our cables [3].
Other parameters have no or negligible influence on time-to-igni-tion. It means that a small change in cable structure (sheath thickness or PE insulation weight) cannot delay significantly the ignition. Important changes in sheath material or cable structure are needed for this pur-pose. Moreover a cable tray should ignite similarly under heat flux regardless of its exact configuration (loose or tight layout of the cables, number of cables). Note that in a previous work concerning large ha-logen-free cables, it was found that spacing had a moderate influence Table 4
Characteristics of the tests and cone calorimeter results for the cable structure study.
Cable Configuration Parameters Cone Results - Average value Cone Results - Standard deviation Number of câble (N*) Density (d*) Sheath thickness (S*) Insulation mass (I*) Heat Flux (HF*) TTI (s) pHRR0 (kW) pHRR1 (kW) Δt (s) TTI (s) pHRR0 (kW) pHRR1 (kW) Δt (s) A 6S1 1 1 1 1 0,5 163 0,82 1,35 127 6 0,07 0,06 7 1 1 1 1 0,7 75 0,97 1,59 108 0 0,03 0,15 18 1 1 1 1 1 35 1,12 2,03 81 2 0,01 0,11 2 1 1 1 1 1,3 28 1,33 2,60 75 1 0,05 0,24 5 1 1 1 1 1,6 17 1,53 3,10 65 4 0,06 0,20 0,7 B 1 1 0,87 1 0,5 170 0,66 1,47 88 8 0,06 0,14 4 1 1 0,87 1 0,7 72 0,81 1,76 93 11 0,02 0,04 6 1 1 0,87 1 1 35 0,97 2,52 81 2 0,006 0,04 12 1 1 0,87 1 1,3 26 1,16 3,07 72 3 0,07 0,16 15 1 1 0,87 1 1,6 17 1,28 4,17 63 2 0,03 0,70 3 C 1 1 1,27 1 0,5 148 0,81 1,15 185 6 0,006 0,04 3 1 1 1,27 1 0,7 71 0,93 1,28 174 1 0,02 0,00 6 1 1 1,27 1 1 38 1,27 1,68 88 0,6 0,05 0,12 7 1 1 1,27 1 1,3 31 1,46 2,00 77 2 0,00 0,01 1 1 1 1,27 1 1,6 17 1,75 2,63 72 2 0,07 0,10 9 D 1 1 0,91 0,83 0,5 175 0,75 1,13 115 3 0,04 0,20 2 1 1 0,91 0,83 1 47 1,15 1,71 92 5 0,02 0,04 12 1 1 0,91 0,83 1,6 21 1,49 2,71 59 3 0,11 0,01 3 E 1 1 0,91 0,79 0,5 177 0,80 1,24 120 17 0,03 0,05 16 1 1 0,91 0,79 1 51 1,10 1,81 89 6 0,08 0,01 23 1 1 0,91 0,79 1,6 18 1,45 3,40 64 1 0,05 0,55 5 J ( ,a αi , ,β γ, δ, ε) (Y= expi− Y num ( , ,a α β γ, , δ, ε))2 , i 1= ,2,3,4
on TTI but only above a threshold spacing value close to one cable diameter (around 12 mm) [11].
3.2. Influence of test parameters on pHRR0
Fig. 7shows the correlation between experimental and predicted pHRR0calculated according to equation(8).
= ∗ ∗ ∗− ∗ ∗−
pHRR0 1,07 [HF0,59.N0,42.d 0,31.S0,68.I 0,57] (8) Each parameter has an influence on this first peak of heat release (all the powers are higher than 0.2).
According toFig. 8, pHRR0increases with the sheath thickness (as
well as heatflux). As observed by Eliott and Whiteley, a thicker wall means a combustible and the related heat release increase [31]. On the contrary, polyethylene (PE) insulation mass has a reverse influence (ε = −0.57). Indeed, a high PE mass insulation decreases pHRR0. Note
that PE is not yet pyrolyzed when pHRR0occurs.Fig. 9shows the
ef-fective heat of combustion (EHC) for the reference test A_6S1_HF50. EHC is initially close to 21 kJ/g. This value is close to the EHC of the sheath (23 kJ/g). EHC continuously increases up to around 40 kJ/g (i.e. EHC of pure PE), partly due to the depletion of water released from ATH and partly because the pyrolysis front moves from sheath to in-sulation. When pHRR0occurs at 50s, EHC is still close to EHC of sheath,
evidencing that insulation did not start to degrade. Other studies
Cable Configuration Parameters Cone Results - Average value Cone Results - Standard deviation Number of câble (N*) Density (d*) Sheath thickness (S*) Insulation mass (I*) Heat Flux (HF*) TTI (s) pHRR0 (kW) pHRR1 (kW) Δt (s) TTI (s) pHRR0 (kW) pHRR1 (kW) Δt (s) A 3T 0,5 2 1 1 0,5 166 0,45 1,03 150 12 0,07 0,16 0,7 0,5 2 1 1 1 41 0,51 1,84 119 3 0,08 0,16 2 0,5 2 1 1 1,6 17 0,73 2,38 79 2 0,03 0,01 5 6T 1 2 1 1 0,5 178 0,53 1,50 267 6 0,02 0,15 1 1 2 1 1 1 38 0,82 1,99 174 4 0,07 0,10 7 1 2 1 1 1,6 16 1,12 2,25 120 2 0,07 0,12 5 12T 2 2 1 1 0,5 209 0,58 1,38 304 21 0,03 0,07 17 2 2 1 1 1 41 0,97 2,55 192 3 0,07 0,31 5 2 2 1 1 1,6 18 1,49 2,99 153 0,7 0,10 0,07 6 3S1 0,5 1 1 1 0,5 152 0,67 0,98 93 14 0,07 0,07 9 0,5 1 1 1 1 42 0,83 1,82 74 4 0,05 0,21 0,6 0,5 1 1 1 1,6 18 1,04 2,93 57 1 0,02 0,10 1 3S2 0,5 0,67 1 1 0,5 154 0,64 1,25 67 8 0,03 0,06 8 0,5 0,67 1 1 1 38 1,03 2,34 63 2 0,07 0,09 2 0,5 0,67 1 1 1,6 22 1,23 3,67 49 2 0,06 0,01 2 3S3 0,5 0,5 1 1 0,5 164 0,82 1,53 59 5 0,06 0,07 1 0,5 0,5 1 1 1 41 1,09 2,77 59 0 0,14 0,04 0 0,5 0,5 1 1 1,6 22 1,28 4,01 41 4 0,11 0,21 0,7 3S4 0,5 0,4 1 1 0,5 159 0,51 0,97 51 0 0,11 0,12 7 0,5 0,4 1 1 1 41 0,85 1,91 49 4 0,14 0,06 4 0,5 0,4 1 1 1,6 22 1,18 2,92 43 3 0,08 0,29 3 Table 6
Values of thefitting coefficients.
Cone results α (HF) β (N) γ (d) δ (S) ε (I) a R2
TTI −2 0.1 0.01 −0.3 0 42.25 0.99 pHRR0 0.59 0.42 −0.31 0.68 −0.57 1.07 0.91
pHRR1 0.81 0.14 −0.20 −1 0.94 2.19 0.88
Δt −0.59 0.39 0.8 1.06 −0.21 89.16 0.94
Fig. 6. Experimental versus calculated TTI.
Fig. 7. Experimental versus calculated pHRR0. Table 5
observed the same phenomenon [3,32,33]. Therefore the influence of
PE insulation on pHRR0 shall be explained by an indirect effect: PE
insulation absorbs a fraction of heat slowing down the heating of the sheath.
Density of cables has an influence on pHRR0(and also pHRR1, see
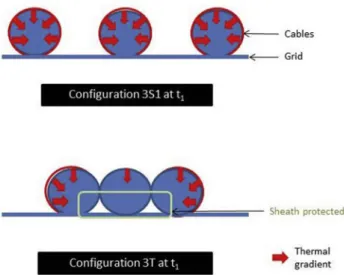
below). Higher is the density, lower are the peaks of heat release rate (Fig. 10). This is in qualitative agreement with our previous work on large halogen-free cables [11]. Indeed, in this work, when spacing in-creases (i.e. when density of cables dein-creases), the two peaks of heat release rate increase. This can be assigned to the increase of the exposed surface when cables are positioned in loose layout. In tight layout, one cable is partially protected by neighboured cables (Fig. 11). It is likely that spacing between cables may affect not only the radiative exposure but also thefluid dynamics around the sample. Hence the diffusion of heated air between cables may create turbulent convection and there-fore modify the formation of the combustible mixture at the cable surface. The fuel concentration has a direct effect on the development of theflame and thus on HRR.
Note also that when spacing is the highest (3S4 samples), pHRR0
does not increase anymore but decreases (Fig. 10). This may be as-signed to a“side effect” (Fig. 12). Indeed, cables located in extreme position in this configuration are partly protected by the edges of the sample holder. Therefore the decomposition is slowed down and pHRR0
decreases.
Another interesting point concerns the number of cables. Considering that the heat release rate of cables is additive, the pHRR0
(and in fact, the whole HRR curve) should be equal to the pHRR0for
one cable times the number of cables. It is not the case: when the
= ∗ ∗ ∗− ∗− ∗
pHRR1 2,19 [HF0,81.N1,14.d 0,2.S 1. I 0,94] (9) It appears that only the heatflux and the cable properties are in-fluent.
Concerning the PE insulation, the influence is notable because pHRR1occurs when insulation is degrading. Higher is the amount of PE
(remember that this component is notflame retarded), higher is the pHRR1. On the contrary sheath thickness has a reverse effect on pHRR1
(Fig. 15). Mineral layer accumulates from the decomposition of sheath (EVA and PE are pyrolyzed, while ATH releases water and alumina remains in the condensed phase). This layer is able to slow down heat transfer from theflame to the underlying material and to reradiate a part of the heatflux. Higher is the sheath thickness, higher is the pro-tective mineral layer thickness and more limited is the heat transfer. As developed by Braun et al., this protective jacket comes to burst, ex-posing the insulation to the heatflux [3].
Of course, heatflux has also a positive effect on pHRR1. Higher is
HF, higher is pHRR1.
3.4. Influence of test parameters on Δt
Fig. 16shows the correlation between experimental and predicted Δt calculated according to equation(10).
= ∗− ∗ ∗ ∗ ∗−
t HF N d S I
Δ 89,16 [ 0,59. 0,39. 0,8. 1,06. 0,21] (10) Four parameters are influencing Δt: heat flux, number of cables, Fig. 8. Influence of the sheath thickness and the insulation mass on pHRR0. (*)
the data points for the series S*, cables A, B and C are tested in configuration 6S1 at 50 kW/m2(where HF* = 1; N* = 1; d* = 1; I* = 1).
(**) the data points for the series I*, cables B, D and E are tested in con fig-uration 6S1 at 50 kW/m2(where HF* = 1; N* = 1; d* = 1; S* = 0,87 for B or
S* = 0,91 for D or S* = 0,91 for E)
Fig. 9. Effective heat of combustion for reference test A_6S1_HF50.
Fig. 10. Influence of the number of cables and their density on pHRR0. (*) the
data points for the series N*, cable A is tested in configurations 12T, 6T and 3T at 50 kW/m2(where HF* = 1; d* = 2; S* = 1; I* = 1).
(**) the data points for the series d*, cable A is tested in configuration 3T, 3S1, 3S2, 3S3 and 3S4 at 50 kW/m2(where HF* = 1; N* = 0.5; S* = 1; I* = 1)
number of cables increases from 3 to 12, the pHRR0 increases only by a
factor 2 (Fig. 10). There are two possible explanations. The first one is only an artefact due to test conditions. Indeed, the spark igniter shades the cables located just below. Therefore the heating of these cables is slightly slowed down. If the cables do not ignite all in the same time, their respective HRR curve and especially pHRR0 are slightly shifted.
Experimental pHRR0 is then lower than expected from a linear rule of
mixtures.
Another explanation is that cables can be protected by the neigh-boured cables, as explained in Fig. 13. The cables located at the ends of the layout are more exposed than the cables located at the center. Moreover, for 12 cables, the two cables at the ends of the layout are also protected by the edges of the sample holder. This may explain why pHRR0 is lower than expected, especially when 12 cables are burnt.
3.3. Influence of test parameters on pHRR1
Fig. 14 shows the correlation between experimental and predicted pHRR1 calculated according to equation (9). The R2 coefficient is
density of cables and sheath thickness. The two last parameters are the most influent. Higher is the sheath thickness, longer is the time needed to degrade the sheath before starting degrading the PE insulation (re-member that pHRR1corresponds to PE pyrolysis) (Fig. 17).
As already explained, when the layout of cables is loose (low d value), the exposed surface increases and then the decomposition is faster. Therefore pHRR1is reached after a shorter period andΔt
de-creases. This was also observed for larger halogen-free cables for which the spacing between cables was studied in cone calorimeter [11].
Obviously, higher is the heatflux, faster is the decomposition, and Δt decreases too. The effect of the number of cables is less obvious. It may be due to a correlation with density of cables to some extent. Indeed, when the number of cables is large, their‘density’ is also higher. In the case of 12 cables, the only configuration is tight, instead of the case of 3 cables that can be organised in loose configurations. The si-mulated importance of the number of cables may be an artefact of this experimental setting. So the decomposition is faster for 3 cables, and the pHRR1is reached sooner. But this parameter has only a moderate
influence in comparison to sheath thickness. Fig. 11. Scheme illustrating the protective effect of neighboured cables in tight
layout.
Fig. 12. Configuration 3S4D – a. Picture of cables in sample holder – b. cross-section illustrating the protection from the edges of sample holder.
Fig. 13. Scheme illustrating the heatflux according to number of cables in tight layout.
Fig. 14. Experimental versus calculated pHRR1.
Fig. 15. Influence of the sheath thickness and the insulation mass on pHRR1. (*) the data points for the series S*, cables A, B and C are tested in configuration 6S1 at 50 kW/m2(where HF* = 1; N* = 1; d* = 1; I* = 1)
(**) the data points for the series I*, cables B, D and E are tested in con fig-uration 6S1 at 50 kW/m2(where HF* = 1; N* = 1; d* = 1; S* = 0,87 for B or
S* = 0,91 for D or and S* = 0,91 for E)
3.5. Some additional remarks
Sheath thickness has a significant influence on 3 among 4 features, namely pHRR0, pHRR1andΔt. Only TTI does not appear to be
influ-enced by sheath thickness. On the contrary, PE insulation has a negli-gible influence on TTI and Δt, a moderate one on pHRR0but a strong
influence on pHRR1. This result highlights the predominant role of
sheath with respect to decomposition rate. This is an expected result since sheath is thefirst layer undergoing heat flux in case of fire. But it means that a huge improvement of flame retardancy can hardly be obtained by changing only the inner cable structure.
Note also that the whole cables are fully burning in all cases. No heatflux threshold was observed, as in the previous work of Meinier et al. [11]. Of course, this may be assigned to the low sheath thickness of the cables studied in the present work. This highlights that the sheath is unable to sufficiently slow down the heat transfer to avoid the pyr-olysis of the inner parts. This evidences that these relatively thinner cables are much more hazardous than bigger ones despite a lower fuel load per length unit.
Fig. 18summarizes the mainfindings of this work. The whole HRR curve can be described by part through the values of TTI, pHRR0,
pHRR1andΔt. These values are the main properties accounting for
decomposition rate of the cables. While the cables are fully burning, THR may be also predicted directly from the composition and the
number of cables (note that the THR is an unchanged parameter). The effective heat of combustion or the residue content are also unchanged because the burning is complete (noflame inhibition phenomenon is expected).
4. Conclusion
HRR curves of halogen-free cables tested in various conditions were described using four main features: TTI,first and main pHRR and Δt (delay between TTI and pHRR1). These features were successfully
re-lated to experimental and material parameters using power laws. Five parameters were taken into account, namely heat flux, number and density of cables, sheath thickness, and insulation weight. Thisfitting allows not only to predict thefire performance of such cables in cone calorimeter but also to highlight the respective role of each parameter investigated through the exponent of the power law.
Depending on the features, one to four parameters have to be con-sidered in the power law to correctly predict experimental data. Heat flux influences all these features and even is the only influent parameter on TTI. Therefore it appears difficult to delay the ignition by small changes in the cable structure. The number of cables and their layout (tight or loose when spacing increases) have an effect on pHRR0and the
delay between TTI and pHRR1. By increasing the number of cables, the
fuel amount is more important, so thefirst peak of heat release rate increases. Nevertheless the HRR curve is not fully proportional to the number of cables. The increase of spacing between cables enhances the exposed surface, accelerating the pyrolysis of the sheath and the in-sulation.
The results also highlight the major role of the sheath (especially, in this study, the sheath thickness) on the HRR curve in comparison to other cable structure parameters. PE insulation mass has a huge effect on pHRR1because this peak occurs when PE is degrading. But the two
pHRRs and the delay between TTI and pHRR1are strongly influenced
by the sheath thickness. Indeed, the sheath is directly exposed to heat flux and contributes to the early heat release. But gradually as the cable burns, alumina from ATH decomposition accumulates at the top of the cable and forms a protective mineral layer able to slowdown the heat transfer from theflame to the underlying material.
The equations proposed tofit experimental data are only suitable for a narrow range of cables. Further work will investigate the extension of our approach to other cables and parameters as for the copper, material of huge importance in the fire behaviour of cables. No quantitative influence of this parameter can be discussed with the set of cables tested in this article since they contain almost the same amount of copper (difference of only 11% between the cables).
We hope this approach provides a guideline for cable engineers to design the cable structure in order to improve itsfire performance in cone calorimeter. Of course, this phenomenological model is only sui-table for a narrow range of cable properties. Further investigation will attempt to extend it to a larger set of cable properties including sheath material.
Funding
This work was supported by the society ACOME (France) and the IMT Mines Ales (France)
Appendix A. Supplementary data
Supplementary data related to this article can be found athttp://dx. doi.org/10.1016/j.firesaf.2018.05.001.
References
[1] M. Kobes, K. Groenewegen, M.G. Duyvis, Consumerfire safety: European statistics and potentialfire safety measures, Vienna Austrian Fed. Minist. Labor, Soc. Aff. Fig. 17. Influence of the number of cables, the density and the sheath thickness
onΔt.
(*) the data points for the series N*, cable A is tested in configurations 12T, 6T and 3T at 50 kW/m2(where HF* = 1; d* = 2; S* = 1; I* = 1).
(**) the data points for the series d*, cable A is tested in configuration 3T, 3S1, 3S2, 3S3 and 3S4 at 50 kW/m2(where HF* = 1; N* = 0.5; S* = 1; I* = 1). (***) the data points for the series S*, cables A, B and C are tested in con fig-uration 6S1 at HF 25 kW/m2(where HF* = 0.5; N* = 1; d* = 1; I* = 1).
Consum. Prot 31 (2009).
[2] E.D. Weil, N.G. Patel, M.M. Said, M.M. Hirschler, S. Shakir, Oxygen index: corre-lations to otherfire tests, Fire Mater. 16 (1992) 159–167.
[3] E. Braun, J.R. Shields, R.H. Harris, Flammability characteristics of electrical cables Using the cone calorimeter, NIST Rep. NISTIR 88 (1989) 4003.
[4] M.M. Hirschler, Survey offire testing of electrical cables, Fire Mater. 16 (1992) 107–118.
[5] A.W. Coaker, M.M. Hirschler, C. Shoemaker, Rate of heat release testing for vinyl wire and cable materials with reducedflammability and smoke—full-scale cable tray tests and small-scale tests, Fire Saf. J. 19 (1992) 19–53.
[6] M.A. Barnes, P.J. Briggs, M.M. Hirschler, A.F. Matheson, T.J. O'Neill, A comparative study of thefire performance of halogenated and non-halogenated materials for cable applications. Part I tests on materials and insulated wires, Fire Mater. 20 (1996) 1–16.
[7] M.A. Barnes, P.J. Briggs, M.M. Hirschler, A.F. Matheson, T.J. O'Neill, A comparative study of thefire performance of halogenated and non-halogenated materials for cable applications. Part II tests on cable, Fire Mater. 20 (1996) 17–37. [8] G.D. Lougheed, C. McCartney, M. Kanabus-Kaminska, Initial investigations on
plenum cables, Build. Eng. 105 (1999) 712–723.
[9] A. Matala, S. Hostikka, Probabilistic simulation of cable performance and water based protection in cable tunnelfires, Nucl. Eng. Des. 241 (2011) 5263–5274. [10] G. Fontaine, F.-E. Ngohang, L. Gay, S. Bourbigot, Investigation of the contribution
tofire of electrical cable by a revisited mass loss cone, Fire Sci. Technol, vol. 2017, Springer Singapore, Singapore, 2015, pp. 687–693.
[11] R. Meinier, R. Sonnier, P. Zavaleta, S. Suard, L. Ferry, Fire behavior of halogen-free flame retardant electrical cables with the cone calorimeter, J. Hazard Mater. 342 (2018) 306–316.
[12] A. Witkowski, B. Girardin, M. Försth, F. Hewitt, G. Fontaine, S. Duquesne, S. Bourbigot, T.R. Hull, Development of an anaerobic pyrolysis model forfire re-tardant cable sheathing materials, Polym. Degrad. Stabil. 113 (2015) 208–217. [13] B. Girardin, G. Fontaine, S. Duquesne, M. Försth, S. Bourbigot, Measurement of
kinetics and thermodynamics of the thermal degradation forflame retarded mate-rials: application to EVA/ATH/NC, J. Anal. Appl. Pyrolysis 124 (2017) 130–148. [14] T.S. Lin, J.M. Cogen, R.E. Lyon, Correlations between microscale combustion ca-lorimetry and conventionalflammability tests for flame retardant wire and cable compounds, Proc. 56th IWCS, 2007, pp. 176–185.
[15] J.M. Cogen, T.S. Lin, R.E. Lyon, Correlations between pyrolysis combustionflow calorimetry and conventionalflammability tests with halogen-free flame retardant polyolefin compounds, Fire Mater. 33 (2009) 33–50.
[16] R. Sonnier, A. Viretto, A. Taguet, J.-M. Lopez-Cuesta, Influence of the morphology on thefire behavior of a polycarbonate/poly(butylene terephthalate) blend, J. Appl. Polym. Sci. 125 (2012) 3148–3158.
[17] Q. Xie, H. Zhang, L. Tong, Experimental study on thefire protection properties of PVC sheath for old and new cables, J. Hazard Mater. 179 (2010) 373–381. [18] H. Yang, Q. Fu, X. Cheng, R.K.K. Yue, H. Zhang, Investigation of theflammability of
different cables using pyrolysis combustion flow calorimeter, Procedia Eng 62 (2013) 778–785.
[19] R.P. Fisher, S.I. Stoliarov, M.R. Keller, A criterion for thermally-induced failure of electrical cable, Fire Saf. J. 72 (2015) 33–39.
[20] L. Hu, Y. Zhang, K. Yoshioka, H. Izumo, O. Fujita, Flame spread over electric wire with high thermal conductivity metal core at different inclinations, Proc. Combust. Inst. 35 (2015) 2607–2614.
[21] J. Mangs, S. Hostikka, Verticalflame spread on charring materials at different ambient temperatures, Fire Mater. 37 (2013) 230–245.
[22] B. Girardin, G. Fontaine, S. Duquesne, S. Bourbigot, Fire tests at reduced scale as powerful tool to fasten the development offlame-retarded material: application to cables, J. Fire Sci. 34 (2016) 240–264.
[23] C.J. Novak, S.I. Stoliarov, M.R. Keller, J.G. Quintiere, An analysis of heatflux in-duced arc formation in a residential electrical cable, Fire Saf. J. 55 (2013) 61–68. [24] M.M. Khan, R.G. Bill, R.L. Alpert, Screening of plenum cables using a small-scale
fire test protocol, Fire Mater. 30 (2006) 65–76.
[25] M.M. Hirschler, Flame retardants and heat release: review of traditional studies on products and on groups of polymers, Fire Mater. 39 (2015) 207–231.
[26] M.M. Hirschler, Comparison of large-and small-scale heat release tests with elec-trical cables, Fire Mater. 18 (1994) 61–76.
[27] K. Mc Grattan, A. Lock, N. Marsh, M. Nyden, A. Morgan, M. Galaska, K. Schenck, Cable Heat Release, Ignition, and Spread in Tray Installations during Fire (CHRISTIFIRE) vol. 1, (2010) Horizontal Trays Draft, Off. Nucl. Regul. Res. NUREG Repo.
[28] K. Mc Grattan, S. Bareham, Cable Heat release, Ignition and Spread in Tray Installations During Fire (CHRISTIFIRE) (NUREG/CR-7010), (2013) U.S. Nuclear Research Commission reporthttps://www.nrc.gov/docs/ML1334/ML13346A045. pdf.
[29] S.J. Grayson, P. Van Hees, a. M. Green, H. Breulet, U. Vercellotti, Assessing thefire performance of electric cables (FIPEC), Fire Mater. 25 (2001) 49–60.
[30] H. Breulet, T. Steenhuizen, Fire testing of cables: comparison of SBI with FIPEC/ Europacable tests, Polym. Degrad. Stabil. 88 (2005) 150–158.
[31] P.J. Elliot, R.H. Whiteley, Cone calorimeter test for the measurement of flamm-ability properties of insulated wire, Polym. Degrad. Stabil. 64 (1999) 577–584. [32] B.N. Rao, R.A. Jothi, A.R. Srinivasan, A. Sudhindra, Heat release measurements on
FRLS cables using cone calorimeter - CPRI's experience, Proc. Fire Mater. Conf, 2007.
[33] B.N. Rao, R.A. Jothi, Assessing smoke and heat release during combustion of electric cables using cone calorimeter, Proc. 9th Int. Conf. Insul. Power Cables, 2015.
[34] E. Gallo, W. Stöcklein, P. Klack, B. Schartel, Assessing the reaction tofire of cables by a new bench-scale method, Fire Mater. 41 (2017) 768–778.
[35] ISO, 2015, Reaction-to-fire Tests – Heat Release, Smoke Production and Mass Loss Rate– Part 1: Heat Release Rate (Cone Calorimeter Method) and Smoke Production Rate (Dynamic Measurement) vols. 5660–1, (2015).
[36] D.W. Marquardt, An algorithm for least-squares estimation of nonlinear parameters, J. Soc. Ind. Appl. Math. 11 (1963) 431–441.
[37] B. Schartel, T.R. Hull, Development offire-retarded materials - interpretation of cone calorimeter data, Fire Mater. (2007) 327–354.
[38] B.T. Rhodes, J.G. Quintiere, Burning rate andflame heat flux for PMMA in a cone calorimeter, Fire Saf. J. 26 (1996) 221–240.
[39] E. Mikkola, I.S. Wichman, On the thermal ignition of combustible materials, Fire Mater. 14 (1989) 87–96.