NeuroImage
Characterizing the gradients of structural covariance in the human hippocampus
--ManuscriptDraft--Manuscript Number: NIMG-20-127R1
Article Type: VSI: Gradients
Section/Category: Anatomy and Physiology Corresponding Author: Shahrzad Kharabian Masouleh
Jülich, GERMANY
First Author: Shahrzad Kharabian Masouleh Order of Authors: Shahrzad Kharabian Masouleh
Anna Plachti Felix Hoffstaedter Simon Eickhoff Sarah Genon
Abstract: The hippocampus is a plastic brain structure that has been associated with a range of behavioral aspects but also shows vulnerability to the most frequent neurocognitive diseases. Different aspects of its organization have been revealed by studies probing its different neurobiological properties. In particular, histological work has shown a pattern of differentiation along the proximal-distal dimension, while studies examining functional properties and large-scale functional integration have primarily highlighted a pattern of differentiation along the anterior-posterior dimension. To better understand how these organizational dimensions underlie the pattern of structural covariance (SC) in the human hippocampus, we here applied a non-linear decomposition approach, disentangling the major modes of variation, to the pattern of grey matter volume correlation of hippocampus voxels with the rest of the brain in a sample of 377 healthy young adults. We additionally investigated the consistency of the derived gradients in an independent sample of life-span adults and also examined the relationships between these major modes of variations and the patterns derived from microstructure and functional connectivity mapping. Our results showed that similar major modes of SC-variability are identified across the two independent datasets. The major dimension of variation found in SC runs along the hippocampal anterior-posterior axis and followed closely the principal dimension of functional differentiation, suggesting an influence of network level interaction in this major mode of morphological variability. The second main mode of variability in the SC showed a gradient along the dorsal-ventral axis, and was moderately related to variability in hippocampal microstructural properties. Thus our results depicting relatively reliable patterns of SC-variability within the hippocampus show an interplay between the already known organizational principles on the pattern of variability in hippocampus' macrostructural properties. This study hence provides a first insight on the underlying organizational forces generating different co-plastic modes within the human hippocampus that may, in turn, help to better understand different vulnerability patterns of this crucial structure in different neurological and psychiatric diseases.
Characterizing the gradients of structural covariance in the human
1
hippocampus.
2 3
Shahrzad Kharabian Masouleh1,2, Anna Plachti1,2, Felix Hoffstaedter1,2 , Simon Eickhoff1,2 ,
4
Sarah Genon1,2
5 6
1Institute of Neuroscience and Medicine (INM-7: Brain and Behaviour), Research Centre
7
Jülich, Jülich, Germany 8
2Institute of Systems Neuroscience, Heinrich Heine University Düsseldorf, Düsseldorf,
9
Germany; 10
11
Author's email addresses:
12 s.kharabian@fz-juelich.de 13 a.plachti@fz-juelich.de 14 f.hoffstaedter@fz-juelich.de 15 s.eickhoff@fz-juelich.de 16 s.genon@fz-juelich.de 17 18
Abstract:
19 20
The hippocampus is a plastic brain structure that has been associated with a range of behavioral 21
aspects but also shows vulnerability to the most frequent neurocognitive diseases. Different 22
aspects of its organization have been revealed by studies probing its different neurobiological 23
properties. In particular, histological work has shown a pattern of differentiation along the 24
proximal-distal dimension, while studies examining functional properties and large-scale 25
functional integration have primarily highlighted a pattern of differentiation along the anterior-26
posterior dimension. 27
To better understand how these organizational dimensions underlie the pattern of structural 28
covariance (SC) in the human hippocampus, we here applied a non-linear decomposition 29
approach, disentangling the major modes of variation, to the pattern of grey matter volume 30
correlation of hippocampus voxels with the rest of the brain in a sample of 377 healthy young 31
adults. We additionally investigated the consistency of the derived gradients in an independent 32
sample of life-span adults and also examined the relationships between these major modes of 33
variations and the patterns derived from microstructure and functional connectivity mapping. 34
Our results showed that similar major modes of SC-variability are identified across the two 35
independent datasets. The major dimension of variation found in SC runs along the 36
hippocampal anterior-posterior axis and followed closely the principal dimension of functional 37
differentiation, suggesting an influence of network level interaction in this major mode of 38
morphological variability. The second main mode of variability in the SC showed a gradient 39
along the dorsal-ventral axis, and was moderately related to variability in hippocampal 40
microstructural properties. Thus our results depicting relatively reliable patterns of SC-41
variability within the hippocampus show an interplay between the already known 42
organizational principles on the pattern of variability in hippocampus’ macrostructural 43
properties. This study hence provides a first insight on the underlying organizational forces 44
generating different co-plastic modes within the human hippocampus that may, in turn, help to 45
better understand different vulnerability patterns of this crucial structure in different 46
neurological and psychiatric diseases. 47
48 49 50
1. Introduction:
51
The hippocampus is a complex, phylogenetically preserved brain structure, located within the 52
medial temporal lobe. Characterizing its functional pattern, multiple studies have demonstrated 53
its involvement in different domains of human behavior including memory functions (Bonnici 54
et al., 2013; Eichenbaum, 2004; Maren and Holt, 2000; Stella and Treves, 2011), spatial 55
navigation (Chersi and Burgess, 2015), emotion (Plachti et al., 2018; Strange et al., 2014) and 56
creative thinking (Chersi and Burgess, 2015). The variety of tasks and behavioral domains that 57
are associated with this phylogenetically old brain structure hence demonstrates its crucial role 58
in the whole cognitive system. 59
Neurobiologically, hippocampus’ direct and indirect connections to cortical and subcortical 60
structures place it at the cross-road of information transfer between distinct brain regions and 61
as an important component of the brain’s large scale networks (Clawson et al., 2019; Dalton et 62
al., 2019; Mitra et al., 2016; Ward et al., 2014). Accordingly, hippocampal alterations are 63
reported within the most frequent neurodegenerative and psychiatric diseases, such as 64
Alzheimer’s disease (Allen et al., 2007; Halliday, 2017), schizophrenia (Lieberman et al., 65
2018), depression (Fateh et al., 2019; Kemmotsu et al., 2013) and anxiety (Cha et al., 2016) 66
disorders where changes in its functional and morphological properties are linked to symptom 67
severity and progression of the disease. 68
Within healthy individuals, the hippocampus structure is known to be very plastic
69
exhibiting one of the most unique phenomena of the adult mammalian brain, namely, the
70
development of new neurons throughout the life span (i.e. neurogenesis). Presumably
71
partially related to this unique property, at the macroscopic level, plastic changes within
72
the hippocampus are documented based on in-vivo MRI measurements. For example, it
73
has been shown that taxi drivers with expert navigation abilities have lager posterior
74
hippocampi than controls and bus drivers (Maguire et al., 2006). In addition to these
75
experience-based morphological changes, in-vivo dynamics of microstructural integrity of
the hippocampus have been demonstrated in association with sex-hormones, at much
77
shorter time scales (Barth et al., 2016).
78
These structural changes in the hippocampus arise from variation at its local
79
microstructural organizations. Nevertheless, considering the tight integration of
80
hippocampus within the large scale brain networks and its high degree of structural, as
81
well as functional, connectivity (Maller et al., 2019) with other brain regions, the observed
82
morphological plastic changes could also be accounted by system-level interactions of the
83
hippocampus with distinct brain regions.
84
As far, two organizational patterns have been proposed in the hippocampus. The first one is 85
based on the long history of cytoarchitectonic mappings, evidencing reliable boundaries based 86
on microscopic features, such as somatic size, shape and size (Andersen et al., 2007; Duvernoy, 87
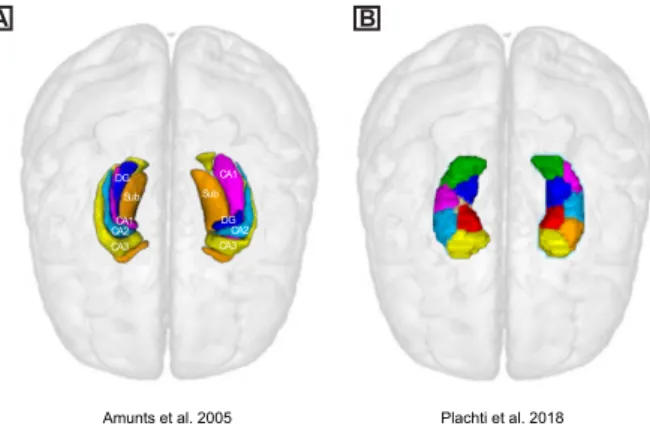
2005), subdividing the hippocampus into different subfields. The hippocampal subfields 88
spatially span along the proximal-distal axis, which is represented along the medio-lateral and 89
the ventro-dorsal axes, in the rolled-in, volumetric representations (Figure 1-A). In parallel, in-90
vivo examinations using electrophysiological recordings and task activations, as well as studies
91
assessing connectivity patterns of the hippocampus, have suggested an organization along the 92
anterior-posterior axis (Colombo et al., 1998; Przeździk et al., 2019; Strange et al., 2014). 93
In the recent years, many studies of the hippocampus have begun to focus more on this later 94
organizational dimension. Multiple lines of evidence in animals and humans support the 95
existence of such organizational pattern and its relevance for behavioral functions. In particular, 96
it has been shown that the hippocampal projections to cortical and subcortical structures follow 97
a graded pattern of connections changing gradually along its longitudinal axis (Strange et al., 98
2014). Also, gene expression studies have demonstrated a molecular gradient along the 99
longitudinal axis, which is linked to distinct functional networks in the brain, each showing 100
preferential vulnerability to different neurodegenerative conditions (Vogel et al., 2019). 101
Interestingly, association with behavioral functions in the hippocampus have also shown a 102
gradual change along the longitudinal axis (Plachti et al., 2018). According to these 103
accumulating evidence, unlike the cytoarchitectonic organizational pattern, which is mainly 104
related to local microscopic tissue properties, the longitudinal organizational pattern is driven 105
by cortical and sub-cortical interactions of the hippocampus, demonstrating its tight integration 106
within the large scale functional systems, enabling the hippocampus to sub-serve broad 107
behavioral functions. 108
Data-driven approaches to parcellate the hippocampus based on its connectivity profiles with 109
the rest of the brain have demonstrated a differentiation in the connectivity patterns along the 110
longitudinal axis, subdividing the head and tail of the hippocampus from more intermediate 111
sections. In addition, the intermediate clusters are also separated into medial and lateral clusters 112
(Plachti et al., 2018) (Figure 1-B). Strikingly, the existence of such medial-lateral clusters in 113
addition to the general pattern along the anterior-posterior axis of the hippocampus might be 114
indicative of multiple superimposed organizational forces coming from innate microstructural 115
characteristics (such as cytoarchitectonic and myelin features), as well as interaction with other 116
brain regions. Such an interplay between long-range connectivity and local microstructural 117
properties were demonstrated recently by Vos de Wael et al., identifying two main axes of 118
functional connectivity transition within each of the hippocampal cytoarchitectonically-defined 119
subfields. In particular, while the first axis demonstrated a gradual anterior to posterior 120
transition of functional connectivity patterns with the rest of the brain, the second axis followed 121
closely the distribution of myelin markers in most subfields. These results demonstrate the 122
existence of overlapping functional organizational patterns, within each hippocampal subfield, 123
presumably shaped by both, long-range connections as well as, the underlying microstructural 124
properties. 125
Research on the dynamic properties of hippocampal structure and its morphological
126
alterations in association with learning, aging, neurodegenerative diseases and its
127
vulnerability to factors such as stress and hormonal alterations has a longer history than
MRI-based functional evidence of a longitudinal gradient. However, as far, an integrative
129
view on the existence and interplay between different organizational forces, shaping
130
hippocampal structure and its morphological dynamic properties, is crucially lacking.
131
Characterizing the major dimensions shaping the structural aspects of the hippocampus
132
can open new perspectives to better understand the multifaceted role of the hippocampus
133
in the complexity of the human cognitive systems, hippocampus’ plasticity, as well as
134
population’s patterns of interindividual variability and, vulnerability to
135
neurodegenerative diseases.
136
To identify and disentangle the major organizational modes of the hippocampal macrostructure, 137
in the current study, we leveraged high-resolution multi-modal neuroimaging from the openly 138
accessible HCP dataset. We examined hippocampal voxels with regards to their structural co-139
plasticity with the rest of the brain. We hence characterized the main dimensions of variability 140
across hippocampal voxels with regard to similarity of their whole-brain structural covariance 141
patterns. The thereby derived estimates of co-plasticity are called structural covariance (SC) 142
and reflect the degree of co-variability in the structural properties of each hippocampal voxel 143
with all other gray matter voxels, across a large group of individuals. 144
145
Previous studies have revealed the existence of multiple highly reproducible co-plastic
146
networks consisting of distinct regions across the brain within cohorts of healthy
147
individuals. Regions belonging to the same co-plastic network are suggested to
148
demonstrate similar vulnerability to disease processes. Accordingly, pathologic conditions
149
such as different types of neurodegenerative diseases, primarily affect regions that belong
150
to the same co-plastic network (Evans, 2013; Seeley et al., 2009; Zhou et al., 2012). By
151
definition, structural covariance is based on the similarity of the macrostructural
152
variations (Mechelli et al. 2005; Alexander-Bloch et al. 2013) and thus is primarily
153
influenced by factors influencing underlying structure, such as expression of common
genetic cues during early development of the cortex (Raznahan et al., 2011) and direct
155
structural connectivity through monosynaptic connection (Yee et al., 2018). Nevertheless,
156
within healthy individuals, the co-plastic patterns also resemble functional networks
157
derived from resting-state functional connectivity (RSFC) analysis, suggesting that the
158
structural covariance also arises due to network mediated plasticity – as a result of
159
plasticity-related changes at the synaptic and cellular levels (Evans, 2013). RSFC reflects
160
the intrinsic patterns of signal co-fluctuations between two distinct regions and hence
161
presumably functional interaction between regions. The structural properties of the
162
regions that demonstrate such functional coupling, co-vary to a high degree together as
163
well (Alexander-Bloch et al., 2013a), hence conceptually linking RFSC and structural
164
covariance networks (Kotkowski et al. 2018). In sum, structural covariance is assumed to
165
reflect common influences of certain factors on microstructure, be it synaptogenesis based
166
on functional synchronous firing, connectivity as direct monosynaptic connection, gene
167
expression in synapses development, or similarities in the local micro-architectonic
168
properties. In the current study, we use the information from this multi-facet covariance
169
pattern to disentangle major dimensions of variability of the hippocampal co-plasticity.
170
In the first step, across a group of young participants from the HCP cohort, we identified the 171
patterns of structural covariance of each voxel within the hippocampus and all none-172
hippocampal gray matter voxels. The similarity of the structural covariance patterns of every 173
pairs of hippocampal voxels were then summarized in an affinity matrix. This latter was further 174
decomposed into its major components using a diffusion map embedding approach (a non-175
linear manifold learning technique (Margulies et al., 2016)). In brief, the algorithm estimates a 176
low-dimensional embedding from a high-dimensional similarity matrix. Within each new 177
dimension, the voxels with more similar pattern of structural covariance are closer together and 178
the voxels at the opposite ends of the gradient have the most different structural covariance 179
patterns. Compared to other nonlinear manifold learning techniques, the algorithm is relatively 180
robust to noise and computationally inexpensive (Tenenbaum et al., 2000). 181
Importantly, we assessed the replicability of these structural gradient patterns in an independent 182
dataset. To further interpret these organizational axes, we assessed spatial similarity of major 183
dimensions of structural covariance with variations in local microstructural properties, 184
approximating myelin destitution, as well as cytoarchitectonic distinctions across the 185
hippocampus. Furthermore, to investigate the relationship between structural and functional 186
organization patterns within the hippocampus, major modes of variations in the functional 187
connections and co-activation patterns of the hippocampal voxels with the rest of the brain were 188
derived using the same decomposition approach. 189
Our analysis revealed a principal gradient of structural covariance that followed the 190
hippocampal longitudinal axis and corresponded to the main dimension of functional 191
connectivity variation in the hippocampus. The second gradient, demonstrated a dorsal-medial 192
organization, and was moderately associated with the spatial distribution of proxy measures of 193
myelin in hippocampus. It also showed a moderate link with cytoarchitectonic classifications, 194
suggesting a partial link between this second dimension of structural covariance and the 195
hippocampal innate microstructural properties. 196 ---Figure 1--- 197 198 2. Methods: 199 2.1. Participants: 200
The participants of the main analysis were selected from the publicly available data from the 201
Human Connectome Project (HCP; http://www.humanconnectome.org), consisting of young 202
healthy adults. HCP comprises data from 1113 individuals (656 females), with mean age of 203
28.8 years (standard deviation (SD) = 3.7, range = 22–37). The full set of inclusion and 204
exclusion criteria are described elsewhere (Glasser et al., 2013; Van Essen et al., 2013). Here 205
we selected a subset of unrelated individuals from this cohort, consisting of 377 individuals 206
(age: 28 ± 3.6, 192 female), with good quality structural and four available resting-state 207
functional scans. 208
For replication sample, healthy adult participants from the enhanced NKI (eNKI) Rockland 209
cohort (Nooner et al., 2012) were selected. We focused only on participants for which good 210
quality T1-weighted scans were available. Exclusion criteria consisted of alcohol or substance 211
dependence or abuse (current or past), psychiatric illnesses (eg. Schizophrenia) and current 212
depression (major or bipolar). Furthermore, we excluded participants with bad quality of 213
structural scans after pre-processing, resulting in a total sample of 468 healthy participants (age: 214
48 ± 19, 315 female). 215
216
2.2. MRI acquisition and preprocessing:
217
2.2.1. Structural MRI:
218
MRI data of the main sample (HCP) were acquired on the HCP’s custom 3T Siemens Skyra. 219
Two T1w images with identical parameters were acquired using a 3D-MPRAGE sequence 220
(0.7mm isotropic voxels, TR=2400ms, TE=2.14ms, flip angle=8°; iPAT=2). Two T2w images 221
were acquired with identical geometry (TR=3200ms, TE=565ms, variable flip angle; iPAT=2). 222
The imaging data of the eNKI cohort were all acquired using a single scanner (Siemens 223
Magnetom TrioTim, 3.0 T). T1-weighted images were obtained using a MPRAGE sequence (1 224 mm isotropic voxels, TR = 1900 ms; TE = 2.52 ms). 225 226 2.2.2. Rs-fMRI: 227
Within the HCP cohort, four rs-fMRI scans were acquired using multi-band accelerated 2D-228
BOLD echo-planar imaging (2mm isotropic voxels, matrix=104x90, 72 sagittal slices; 229
TR=720ms, TE=33ms, flip angle=52°; mb factor=8; 1200 volumes/scan). Participants were 230
instructed to keep their eyes open, look at fixation cross, and not fall asleep. 231
232
2.3. Image Processing:
233
2.3.1. Structural MRI:
234
Both datasets were preprocessed using the CAT12 toolbox (Gaser and Dahnke, 2016). Briefly, 235
each participant’s T1-weighted scan was corrected for bias-field inhomogeneities, then 236
segmented into gray matter (GM), white matter (WM), and cerebrospinal fluid (CSF) 237
(Ashburner and Friston, 2005). The segmentation process was further extended for accounting 238
for partial volume effects (Tohka et al., 2004) by applying adaptive maximum a posteriori 239
estimations (Rajapakse et al., 1997). The gray matter segments were then spatially normalized 240
into standard (MNI) space using Dartel algorithm (Ashburner, 2007) and further modulated. 241
The modulation was performed by scaling the normalized gray matter segments for the non-242
linear transformations (only) applied at the normalization step. While this procedure ignores 243
the volume changes due to affine transformation, it allows preserving information about 244
individual differences in local gray matter volume. In other words, it re-introduces individual 245
differences in local gray matter volume removed in the process of inter-subject registration and 246
normalization. Finally, the modulated gray matter images were resampled to a voxel resolution 247
of 2mm isotropic. 248
249
2.3.2. T1-weighted over T2-weighted ratio:
250
For each individual, the bias-corrected T2-weighted images were co-registered to the 251
individual’s T1-weighted scan using a rigid-body transformation model. The ratio of the two 252
scans (T1w/T2w) is then generated for each individual and warped to the standard (MNI) space 253
using deformation fields, calculated from application of Dartel algorithm on the participant’s 254
T1-weighted data. The warped T1wT2w-ratio maps were also resampled to a voxel resolution 255
of 2mm isotropic. 256
2.3.3. Rs-fMRI:
258
Pre-processed resting-state timeseries were downloaded from the ConnectomeDB 259
(https://db.humanconnectome.org). Briefly, for each participant, the timeseries were corrected 260
for gradient nonlinearity, and head motion was corrected using a rigid body transformation. The 261
geometric distortions were corrected using the R-L/L-R blipped scan pairs. Distortion corrected 262
images were warped to T1w space using a combination of rigid body and boundary-based 263
registrations (Greve and Fischl, 2009). These transformations were concatenated with the 264
transformation from native T1w to MNI152, to warp functional images to MNI152. After 265
removing the bias field, brain extraction and normalization of whole brain intensity was done. 266
A high-pass filter (>2000s full-width-half-maximum) corrected the time series for scanner 267
drifts. Further noise was removed using the ICA-FIX procedure (Salimi-Khorshidi et al., 2014). 268
Finally, the preprocessed resting-state scans, with a voxel resolution of 2mm, were smoothed 269
with an isotropic gaussian kernel of 5 mm (full-width-half-maximum). 270
271
2.4. Hippocampal Volume of Interest (VOI) and gray matter target:
272
We defined our VOI as a consortium of the cytoarchitectonic maps, available in the SPM 273
Anatomy Toolbox 2.0 (Eickhoff et al. 2005), and the macro anatomically-defined Harvard-274
Oxford Structural Probability Atlas (http://neuro.imm.dtu.dk/wiki/Harvard-Oxford_Atlas) 275
(Desikan et al. 2006). The hippocampal formation included the following subfields: CA1–3, 276
dentate gyrus, and subiculum. In addition, by thresholding average of the modulated gray matter 277
images from the HCP cohort to values above 0.2, a whole brain gray matter mask was generated. 278
The aforementioned hippocampal VOIs are further restricted by this gray matter mask. The 279
total number of voxels in a 2mm × 2mm× 2mm space in the right hippocampus was 771 and 280
that of the left hippocampus was 756 voxels. 281
Furthermore, as target mask for covariance (structural/functional) analyses, the hippocampal 282
VOIs were dilated by 8mm (isotropic) and the resulting regions (both the left and right dilated-283
hippocampal VOIs) were excluded from the above-mentioned thresholded whole-brain gray 284
matter mask. This procedure aims to diminish the possibility of mixing of the signal from the 285
hippocampal voxels in the target, which my otherwise occur, for example as a result of 286
smoothing. The remaining gray matter voxels (including cerebral and cerebellar, as well as 287
subcortical gray matter) were used as target mask. 288
2.5. Hippocampal Connectivity analysis:
289
2.5.1. Structural covariance:
290
Within each cohort, structural covariance (SC) was measured by computing the Pearson’s 291
correlation coefficient between gray matter volume values of the hippocampus’ VOI voxels 292
(seed voxels per hemisphere) and all other brain gray matter voxels across the whole sample. 293
This procedure yielded one seed-by-target structural covariance matrix, at the group level, for 294
each of the hippocampal VOIs (i.e. one pre hemisphere). 295
To reduce noise and increase between participant overlap of gray matter structures, in particular 296
in the highly folded cortical regions, the target voxels were selected from modulated gray matter 297
images that were additionally smoothed with an isotropic gaussian kernel of 8mm (full-width-298
half-maximum). The seed voxels (hippocampal VOI) were, however, selected from resampled, 299
modulated gray matter segments with no further smoothing. 300
301
2.5.2. Resting-state functional connectivity analysis:
302
For every participant, resting-state functional connectivity (RSFC) was assessed for every 303
session, by calculating the Pearson’s correlation between time courses of seed voxels and target 304
voxels, both extracted from the preprocessed, smoothed resting-state scans of each session. 305
Then the FC matrices were averaged across the four sessions, within each participant and were 306
standardized using the Fisher’s Z-transformation. By averaging the resulting z-scored, averaged 307
FC-matrices across all participants, one seed-by-target overall mean FC-matrix was created, for 308
each of the hippocampal VOIs (i.e. one pre hemisphere). 309
2.5.3. Task-based co-activation analysis:
310
As an additional measure of functional interaction, or connectivity, we characterized task-based 311
co-activation profiles, between hippocampal seed voxels and the rest of the brain (cfs (Plachti
312
et al., 2018)). These co-activation profiles were investigated using seed-based activation 313
likelihood estimation meta-analysis of functional neuroimaging data stored in the BrainMap 314
database (Laird et al. 2011)(http://www.brainmap.org). To account for spatial uncertainty, the 315
nearest 100 experiments reporting activation within each seed voxel or in its immediate vicinity 316
were considered. The brain-wide co-activation pattern for each seed voxel was then computed 317
by a quantitative meta-analysis, using the revised ALE algorithm (Eickhoff et al. 2012), over 318
the retrieved experiments. This analysis resulted in one seed-by-target co-activation matrix, 319
for each of the hippocampal VOIs (i.e. one per hemisphere).
320 321
2.6. Gradient mapping:
322
We utilized diffusion embedding, an unsupervised learning algorithm, to identify principal 323
modes of spatial variations in covariance pattern across the entire of hippocampal voxels, per 324
hemisphere. Briefly, for each modality, the overall (per hemisphere) hippocampal
325
connectivity (covariance) matrix, was proportionally thresholded at 90% per row,
326
retaining only the top 10% correlations between each hippocampal voxel and the target
327
gray matter voxels. This sparse thresholded, asymmetric covariance matrix was then
328
transformed into a normalized angle matrix (based on affinity matrix created based on
329
cosine similarities, resulting in a non-negative and symmetric similarity matrix. Then
330
diffusion map embedding, a one-parameter (α) family of graph Laplacians that integrates
331
local information into a global description, was applied on this normalized angle matrix,
332
to obtain a low-dimensional representation of the covariance matrix, explaining the
333
variance in descending order (each of 1 × #VOI voxels). See Figure 2 for schematic
334
representation of these steps. In line with previous neuroimaging studies, e.g. (Bayrak et
al., 2019; Margulies et al., 2016; Vos de Wael et al., 2018), we used an α of 0.5, resulting in 336
diffusion maps that retain the global relations between data points in the embedded space
337
and are more robust to noise in the covariance matrix.
338
Voxels along each gradient map are assigned unitless embedding values. Along each
339
gradient (columns of the embedding matrix on the right, in Figure 2), voxels that share
340
similar covariance pattern have similar embedding values. For further details see
341
(Margulies et al., 2016; Vos de Wael et al., 2018).
342 ---Figure 2--- 343 344 2.7. Statistical analysis: 345
2.7.1. Major gradients of structural covariance matrix and their between-sample replicability:
346
In order to assess between-sample replicability of major modes of variation in the structural 347
covariance across the hippocampal voxels, the structural covariance maps were generated, as 348
mentioned earlier, for the HCP and eNKI datasets separately, and the diffusion map embedding 349
algorithm was then applied for each VOI, on each sample’s affinity matrix. The resulting 350
gradient maps were ordered according to the explained variance, within each dataset. We then 351
assessed similarity of the distribution of the gradients across the datasets, by calculating spatial 352
Spearman's rank correlations between pairs of gradients derived from the two datasets.
353
As the sign of the gradients are arbitrary, for all correlations, we report only the absolute 354
coefficients. 355
356
2.7.2. Exploring the relation between hippocampal structural gradients and functional
357
gradients:
358
To explore the association between the major modes of structural covariance variation and 359
hippocampal local microstructural properties, the T1wT2w-ratio maps were masked using the 360
VOI mask of each hippocampus and the distribution of the values within each hemisphere were 361
correlated with the distribution of the values for each gradient separately, using Spearman’s 362
rank correlations. 363
To characterize the influence of cytoarchitectonic differentiations on the patterns of structural 364
covariance gradients, we used the Jülich cytoarchitectonic atlas (https://jubrain.fz-365
juelich.de/apps/cytoviewer/cytoviewer-main.php#), released as part of FSL-package and 366
compared the distribution of the gradient values between its main subdivisions using Wilcoxon-367
Mann-Whitney-tests (significance was set at p-value < 0.0002, correcting for multiple 368
comparison for the four gradients and three subdivisions using Bonferroni correction). For this, 369
we masked the hippocampus, within each hemisphere, using the cornu-ammonis (CA),
370
dentate gyrus and subiculum masks. Distribution of the gradient values of the voxels
371
belonging to each of the masked subregions are then compared with each other to
372
investigate the possible impact of cytoarchitectonic differentiations on the generation of
373
the observed pattern of structural covariance of the hippocampus.
374 375
3. Results:
376
3.1. Gradients of hippocampal structural covariance and their between sample replicability:
377
The spatial distributions of the first four gradients of the structural connectivity within the HCP 378
cohort are presented in Figure 3 and Supplementary Figure 1. In total, these four principal 379
gradients explained more than 55% of variance of the data in each hemisphere (left: 55%; right: 380
58%) and corresponded to the clearest elbow in the scree plot (Figure 3). 381
The first gradient of structural covariance (G1SC), which explained more than 20% of the
382
variance (left: 20%; right: 24%) showed an anterior-posterior organization along the 383
longitudinal axis of the hippocampus. The second gradient (G2SC) depicted a general
dorsal-384
ventral and partly medio-lateral gradient pattern, explaining 16% of variance, in each 385
hemisphere (Figure 3). Finally, the third and fourth gradients of structural covariance (G3SC and
386
G4SC), each explaining ~10% of variance (G3SC : left: 12%; right: 10%; G4SC: left: 7%; right:
387
8%) showed a mixed pattern of differentiation along the longitudinal direction but also in the 388
orthogonal directions, in the medio-lateral and dorsal-ventral directions, respectively 389
(Supplementary Figure 1). 390
---Figure 3---
391
To confirm that these organizational patterns of the structural covariance were not sample 392
specific, we ran the same approach on 468 participants of the eNKI sample, which covers a 393
larger age-range than the HCP participants. Figure 4 demonstrates the spatial correlation of the 394
first four gradients of the two datasets. Accordingly, in both hemispheres the first gradient of 395
the eNKI cohort also demonstrated an anterior-posterior organization and had a high spatial 396
correspondence (rho > 0.7), showing similar organization of the voxels in the first principal 397
gradient along the longitudinal axis of the hippocampus, as compared to the HCP sample. In 398
this dataset, the principal gradient explained 16% and 18% of variance in the left and right 399
hemisphere, respectively. 400
Further examinations of the similarity of the organization of the voxels in the subsequent 401
gradients in the eNKI dataset suggested high correlation (rho > 0.63) with the same ordering of 402
the HCP dataset in the left hemisphere. In the right hemisphere, while the forth gradient of the 403
eNKI sample correlated mostly with the forth gradient (G4SC) of the HCP sample, the second
404
and third gradients showed a more mixed spatial patterns, correlating with both G2SC and G3SC
405
in the HCP cohort (rho > 0.38). In addition, in both, the left and right hemisphere, the first and 406
second gradients from the eNKI cohort also correlated moderately (rho > 0.3) with G2SC from
407
the HCP cohort. Similarly to what we observed in the HCP dataset, within the eNKI sample, 408
the first four gradients, captured more than 50% of the variance (left hemisphere: 15%, 14%, 409
7%; right hemisphere: 17%, 12%, 7%, demonstrating the variance explained by the second, 410
third and fourth components, respectively). 411
So, in sum, in both datasets, more than 50% of the SC pattern can be summarized into four 412
gradients whose spatial patterns are replicable across both datasets. In the right hemisphere, the 413
second and third gradients did not show a clear one to one mapping between cohorts suggesting 414
that these two gradients could differently vary across different datasets, but in the left 415
hemisphere, a relative one to one correspondence could be evidenced. 416
417
---Figure 4---
418 419
3.2. Highly similar functional and structural main organizational patterns in the hippocampus:
420
To investigate the similarity of the organizational patterns of the hippocampal voxels based on 421
structural covariance with the organizational patterns of the hippocampal voxels based on 422
functional connectivity, we utilized two independent measures of functional connectivity: 423
RSFC and meta-analytic task-based co-activation. As Figure 5 shows, the first gradient of the 424
structural covariance (G1SC) from the HCP cohort correlated strongly with the principal
425
gradient of both functional modalities (G1RSFC rho = 0.7 and 0.79; Co-activation rho = 0.58 and
0.73, in the left and right hemisphere, respectively). This main functional gradient, just like the 427
G1SC, exhibited a dominant anterior-posterior organization (see Supplementary Figure 2) and
428
explained ~30% of variance in either hemisphere in both functional modalities. In general, these 429
results demonstrate the existence of a general smooth transition along the longitudinal 430
hippocampal axis, that represent the major mode of variation in hippocampal structural and 431
functional covariance/connectivity patterns. 432
The first and third gradients of task-based co-activations further showed moderate association 433
with the third gradient of structural covariance (G3SC) (rho ~ 0.4), in both hemispheres,
434
suggesting a partial pattern of medial-lateral gradient in the major modes of variability of task-435
based co-activations. The other gradients of either of the functional data did not show
436
consistently strong (i.e. similarly strong in both hemispheres) pattern of spatial association with 437
the remaining structural gradients. 438
439
---Figure 5---
440 441
3.3. Relationships of hippocampal structural gradients with estimates of microstructure and
442
cytoarchitectonic organization:
443
The spatial maps of the distribution patterns of T1wT2w-ratio (used to estimate myelin) in the 444
bilateral hippocampus showed moderate association (rho > 0.34) with the second gradient of 445
structural covariance (G2SC), in the HCP cohort (see Supplementary Figure 3 for spatial maps
446
of the distribution patterns of T1wT2w-ratio) . In addition, within the left hemisphere, 447
T1wT2w-ratio also spatially correlated with G1SC (rho = 0.36).
448
Further subdividing the hippocampus into broad cytoarchitectonic territories, using the 449
subregions cornu-ammonis (CA) and subiculum showed a tendency towards a consistent (i.e. 450
in both hemispheres) pattern of higher gradient values in the CA field, compared to the 451
subiculum region, in the second gradient of the structural covariance (G2SC) (p-value of the
Mann-Whitney U tests in both hemispheres < 10-5 (Figure 6). Of note, to avoid biased
453
conclusions, due to relatively smaller size of the dentate gyrus compared to CA field (~11 times) 454
and subiculum (~ 6 times), Figure 6 only presents the results of comparison between CA and 455
subiculum subfields. Comparison across all the three sub-regions are shown in the 456
supplementary Figure 4. 457
These results suggest that, unlike the principal anterior-posterior structural covariance gradient 458
that could be more associated with system-level interactions of the hippocampus with the rest 459
of the brain, the second major mode of variation in the structural covariance of the hippocampus 460
is more tightly linked to its local microstructural properties. 461 462 ---Figure 6--- 463 464 4. Discussion: 465
In the current work, we investigated hippocampal structural organization, in terms of its co-466
plasticity patterns with the rest of the brain. We found that the main principal dimension of the 467
structural covariance in the hippocampus depicts an anterior-posterior gradient hence 468
suggesting that the predominant pattern of co-plasticity with the rest of the brain follows a 469
smooth change across the hippocampal longitudinal axis. We demonstrated the high 470
replicability of this organizational pattern in an independent dataset, consisting of participants 471
with a broader age range hence confirming the generalizability of this main axis of co-plasticity 472
variation across datasets. A similar anterior-posterior organization has been very recently 473
shown as a major dimension of functional connectivity change within the hippocampus 474
(Przeździk et al., 2019; Vos de Wael et al., 2018). Here we replicated this finding using both, 475
resting-state and task-based functional connectivity/co-activation information and highlighted 476
that a large proportion (~50%) of variance in the principal structural gradient of the 477
hippocampus could be explained by this main pattern of functional configuration. 478
The examination of the subsequent structural gradients suggested a very limited similarity of 479
the second dimension of structural variations and functional organization dimensions. Rather, 480
the second major mode of variation in the structural covariance of the hippocampus 481
demonstrated a predominantly dorsal-ventral organization and was bilaterally moderately 482
associated with the spatial distribution of myelin markers in the hippocampus, suggesting a 483
partial link between this organizational pattern and hippocampal innate microstructural 484
properties. Below we discuss the integration of these findings with very recent literature and 485
emerging views in brain mapping, as well as the potential limitations of our study. 486
487
4.1. Disentangling overlapping modes of structural covariance change for a unifying model of
488
hippocampal organization:
489
Understanding the organizational patterns of the brain that subserve information processing in 490
health and explain behavioral phenotypes in pathology are crucial open questions in systems 491
and clinical neuroscience. The study of brain organization is often complicated by evidence of 492
multiple axes of organization that are found with respect to different neurobiological properties 493
(Eickhoff et al., 2018). For example, traditional mapping of the brain organization used local 494
properties such as myelo- and cytoarchitectonic information to characterize brain regions and 495
their relative organization (Hopf and Vitzthum, 1957; von Economo and Koskinas, 1925). 496
Recent advances in in-vivo neuroimaging has expanded the scope of mapping brain 497
organizational principles to the study of network-level interactions and characterizing 498
overlapping axes of information processing and have hence revealed multiple organization 499
dimensions (see (Haak et al., 2018) and (Genon et al., 2018, 2017) for recent examples, 500
depicting such multiple dimensions of organization in the visual and premotor cortices, 501
respectively). 502
The co-existence of these overlapping (i.e. spatially co-existing) and yet, distinct (i.e. from their 503
properties) organizational principles and the interplay between them may give rise to the 504
functional/behavioral specifications of brain regions and determine distinct neurocognitive 505
patterns in pathologic conditions. 506
In particular, considering the hippocampal complex role in multiple different behavioral 507
domains, its distinct cytoarchitectonic properties, its importance as a hub node in the human 508
connectome and its involvement in multiple disorders, understanding its multiple organizational 509
principles, may provide novel insights towards a unifying model of the hippocampus and its 510
variabilities in health and disease. In the current study we examined the change in the structural 511
covariance patterns of the hippocampal voxels with the rest of the brain, to disentangle the 512
different dimensions of its structural organization. 513
Structural covariance, defined as coordinated change in the local morphological
514
properties between distinct pairs of brain regions across a population, reflects long-range
515
co-plasticity. Shared genetic influences, direct structural connections (Yee et al., 2018),
516
similarity of micro-structural properties and coordinated growth (Alexander-Bloch et al.,
517
2013b), shared vulnerability towards toxic agents but also co-activation and co-firing of
518
neurons, all may shape the pattern of structural co-plasticity of a given brain region. From
519
this standpoint, the study of structural covariance may provide unique information about
520
the interaction between these local and global factors and their relative representations
521
on hippocampal neuroimaging-derived macrostructural properties.
522
4.2. The main dimension of structural covariance of the hippocampus map onto the
anterior-523
posterior functional differentiation:
524
The major principal gradient of the structural covariance, running in the anterior/posterior 525
direction, explained more than 20% of variance in the whole data and demonstrated a smooth 526
transition pattern of structural co-plasticity across the longitudinal axis of the hippocampus. 527
Our investigation of the replicability of the principal dimensions of hippocampal structural 528
covariance in an independent dataset confirmed the sample-independence of this core finding. 529
In other words, our results demonstrated the existence of a generalizable strong organization 530
principle, governing hippocampal co-plastic patterns across its major longitudinal axis, among 531
healthy individuals. 532
Multiple lines of evidence pointed out the pattern of differentiation of hippocampal properties 533
along its longitudinal axis. In particular, a recent study have determined a gradual pattern of 534
gene expression along the hippocampal longitudinal axis (Vogel et al., 2019). Similarly, 535
associations with behavioral function, defined from task-activation meta-analytic analysis, 536
indicated an emotion-cognition gradient along the anterior-posterior axis of the hippocampus, 537
e.g. (Moser and Moser, 1998). However, the strongest support for the existence of an 538
organizational principle along the hippocampal long-axis comes from its patterns of 539
connectivity with the rest of the brain. Indeed, anatomical projections and electrophysiological 540
recordings in rodent have demonstrated a gradual variation in the connectivity patterns of the 541
hippocampus along the longitudinal axis (Strange et al., 2014). Similarly, in humans, using 542
resting-state functional connectivity analysis, it has been shown that the large-scale functional 543
interaction properties follow a dominant gradual change across hippocampal longitudinal axis 544
(Vos de Wael et al., 2018). In the same line, our findings of strong spatial correlations between 545
the major gradient of the structural covariance and functional connectivity analyses, suggest 546
that the major organizational structural principle within the hippocampus may be enforced 547
through long-range functional synchronous firing and task co-activation. 548
These findings can be related to the evidence of differential involvement of the anterior and 549
posterior hippocampus in different neurodegenerative diseases (LaJoie et al., 2014b; Lee et al., 550
2017). In particular, our findings can be related to the differential impact of different 551
pathologies, for example Amyloid/Tau pathology versus TDP-43-pathies (Lladó et al., 2018),
552
in atrophy along the hippocampal longitudinal axis and hence provide a system-level 553
explanation for the mechanisms underlying these pathologic changes and the related behavioral 554
phenotypes. For instance, while many studies have shown local atrophy within the 555
hippocampus, in both Alzheimer’s disease and semantic dementia, it is known that the 556
behavioral phenotype differ to a relatively large extent between these two diseases, with 557
episodic memory being mainly impaired in the former. (LaJoie et al., 2014a) interpreted the 558
differential behavioral outcomes linked to hippocampal changes in terms of the variabilities of 559
global functional interactions of the hippocampus within distinct large-scale networks in the 560
two diseases. Similar complementary interpretations were found when considering the local 561
hypermetabolism along the hippocampal longitudinal axis, that were linked to differential 562
network-level interactions and hence were associated with different behavioral symptoms 563
among patients with depression compared to schizophrenic patients (Small et al., 2011). These 564
findings provide evidence that specific aspects of local structural variations in the hippocampus 565
are explained through the study of hippocampal global interactions, opening doors towards the 566
identification of mechanistic biomarkers differentiating patients’ specific profile across the 567
disease spectrum. 568
4.3. Linking additional dimensions of hippocampal structural covariance to local structural
569
properties:
570
The local microstructural properties of the hippocampus, unlike the distribution of its functional 571
interaction and behavioral associations, do not predominantly differentiate along the 572
anterior/posterior axis (DeKraker et al., 2019). Instead, the distinctions within the hippocampus 573
based on the histological findings have been mainly defined across the dorsal-ventral and 574
medial-lateral direction (proximal-distal axis), showing mainly that the structural properties of 575
the hippocampus differentiate roughly orthogonal to its longitudinal axis and allowing the 576
definition of subfields. 577
As a major principal organizational rule of the hippocampus, we expected to find an impact of 578
the variations in these local structural properties in the structural covariance gradients. 579
Accordingly, we found a moderate association between the spatial distributions of T1wT2w 580
ratio, a proxy marker of myelin density, and the second gradient from the structural covariance 581
data, in both hemispheres. These moderate associations suggests a link between the second 582
dimension of macro-structural organization and the hippocampal internal circuitry 583
(Augustinack et al., 2010; Zeineh et al., 2017). Linking the crude cytoarchitectonic 584
differentiations to gradients from the structural covariance also showed a tendency in the CA 585
subfield and subiculum to load on opposite ends of the second gradient. Since proximity in the 586
gradient space reflects the similarity of the patterns of structural covariance, these findings 587
suggest that, in the second main mode of structural covariance, the voxels in the CA show in 588
general a distinct pattern of covariance with other gray matter voxels than the patterns shown 589
by the voxels within the Subiculum. Although caution should be taken when interpreting 590
these findings, due to the wide range of the values within each subfield, the trend in
591
difference between subfields is congruent with our recent clustering of hippocampus’ voxels 592
based on their structural covariance pattern in healthy adults (Plachti et al., 2018). Indeed, 593
applying a clustering algorithm to cluster hippocampus voxels based on the similarity of their 594
brain co-plasticity pattern reveal a differentiation within the hippocampus body and tail that 595
resembles the CA vs. Subiculum differentiation. Thus, altogether, the results of our previous 596
clustering study together with the results of the current study suggest the partial influence of 597
underlying microstructural properties in the pattern of structural covariance of hippocampus’ 598
voxels. 599
The distribution of in-vivo markers of myelin are shown to demonstrate differences across 600
hippocampal subfields, with the highest levels of myelin concentrations being found in the 601
subiculum (DeKraker et al., 2018; Patel et al., 2019; Vos de Wael et al., 2018). The elevated 602
myelin estimate within this subfield could be assumed to party result from the perforant path, 603
passing through the subiculum, conceptually linking myelin distribution to subfield boundaries 604
(DeKraker et al., 2018). 605
Finally, further dimensions of structural covariance, despite their general high degree of cross-606
sample replicability, did not show stable association with the functional gradients. Furthermore, 607
their associations with the distribution of T1wT2w-ratio in the whole hippocampus and the 608
atlas-defined cytoarchitectonic differentiations were also negligible. Altogether, these lack of 609
associations suggest that these second-order dimensions cannot be characterized by our current 610
estimates of myelin and a crude cytoarchitectonic differentiation. This could be related to the 611
limited neurobiological validity of our estimates and/or to associations with unexplored
612
neurobiological features. The possible methodological limitations of our study are further
613
discussed below.
614 615
4.4. Challenges in linking patterns of structural covariance to local structural properties:
616
An important aspect of the structural covariance analysis is the group-wise nature of the 617
analysis, in which the covariance pattern of each voxel is defined based on correlation of 618
morphological properties with the rest of the brain across a group of participants. Therefore, it 619
requires the same definition of voxels across all participants of the cohort. Accordingly, to 620
achieve such cross-individual correspondence, the structural images are preprocessed and 621
registered to a common template, where gray matter volumes are defined within the same voxel 622
on the template image for each individual. The procedure of registering single participant’s 623
structural data to the template involves multiple linear and non-linear deformations and thus 624
can result in considerable inaccuracies, in particular when considering distinctions between 625
small sub-regions within the hippocampus. Such inaccuracies should be considered in the 626
identification of the subfields and their deformation from histological scans to the MNI template 627
space. The cumulative impact of these deformation and registration inaccuracies, can in turn 628
disguise the impact of the underlying cytoarchitectonic properties in the computation of 629
separate dimensions of large-scale structural covariance patterns. To overcome this limitation, 630
some studies used a subject-wise estimate of the subfields, derived from automatic 631
classifications of the structural (T1w and T2w MRI) scans that are already registered to the 632
template space, e.g. (Vos de Wael et al., 2018). However, due to possible inter-individual 633
differences in the shape and size of the subfields, these algorithms are followed by further 634
reparameterizations to improve correspondence of voxels across subjects, which can result in 635
similar inaccuracies, particularly for structural covariance analysis, where the correlations are 636
assessed as a result of group-level variations. 637
Additionally, linking the microstructural properties to the major modes of structural covariance 638
variation is limited by the restricted neurobiological validity of the T1wT2w-ratio as an in-vivo 639
marker of myelin (Arshad et al., 2017; Hagiwara et al., 2018; Uddin et al., 2018). The use of 640
more direct and quantitative in-vivo correlates of myelin (Weiskopf et al., 2013) and even 641
combination of multiple modalities (such as additional use of markers of white matter integrity 642
and myelin density from diffusion MRI scans (Patel et al., 2019)) may provide more detailed 643
information about how the underlying micro-structural variabilities are represented and 644
possibly shape the macro-structural co-plasticity and co-atrophy patterns of the hippocampal 645
voxels. These scientific developments could in turn help to explain the specific aspects of local 646
vulnerability of the hippocampus in pathologic conditions. 647
4.5. Conclusions and future perspectives:
648
The current study aimed to disentangle the major modes of variation in the similarity of 649
hippocampal voxels in terms of their co-plastic properties. Here we demonstrated that using a 650
data-driven decomposition approach, the major modes of variation of the structural covariance 651
patterns could be identified reliably across independent datasets with different age ranges. This 652
replicability allows us to assume that the major dimensions shown in this study reflect 653
generalizable patterns and are caused by general principles governing hippocampus’ 654
organization. 655
In this regard we showed that the principal component of the structural covariance followed the 656
hippocampal longitudinal axis, depicting a smooth gradient running from the head to the tail 657
and hence suggesting a smooth transition in the covariance patterns along this axis. The spatial 658
pattern depicted by this gradient correlated highly with the major gradient of the functional 659
connectivity analysis, suggesting an influence of global connectivity and co-firing in the 660
realization of the main mode of variation in the structural covariance patterns in the 661
hippocampus. In contrast, the second gradient of structural covariance ran in the orthogonal 662
direction mainly along the dorsal-ventral side and was moderately associated with hippocampal 663
microstructural properties and cytoarchitectonic differentiation. 664
Considering the multi-faceted nature of the structural covariance information, further research 665
incorporating more local and global complementary information, including gene expression 666
patterns (Vogel et al., 2019), global white-matter connectivity patterns (Maller et al., 2019) and 667
more quantitative measures of local micro-structural properties (Menon et al., 2019; Weiskopf 668
et al., 2013) can help to further understand the underlying organizational forces generating 669
different co-plastic modes in health and to characterize the vulnerability patterns between and 670
within different pathologic conditions. 671
Acknowledgments
673
This work was supported by the Deutsche Forschungsgemeinschaft (DFG, GE 2835/1-1, EI 674
816/4-1), the Helmholtz Portfolio Theme ‘Supercomputing and Modelling for the Human 675
Brain’ and the European Union’s Horizon 2020 Research and Innovation Programme under 676
Grant Agreement No. 785907 (HBP SGA2). Data were provided by the Human Connectome 677
Project, WU-Minn Consortium (Principal Investigators: David Van Essen and Kamil Ugurbil; 678
1U54MH091657) funded by the 16 NIH Institutes and Centers that support the NIH Blueprint 679
for Neuroscience Research; and by the McDonnell Center for Systems Neuroscience at 680
Washington University. 681
Competing interests: The authors declare no competing interests.
682 683 684
References
685
Alexander-Bloch, A., Giedd, J.N., Bullmore, E., 2013a. Imaging structural co-variance 686
between human brain regions. Nat. Rev. Neurosci. 14, 322–36. doi:10.1038/nrn3465 687
Alexander-Bloch, A., Raznahan, A., Bullmore, E., Giedd, J., 2013b. The convergence of 688
maturational change and structural covariance in human cortical networks. J. Neurosci. 689
33, 2889–2899. doi:10.1523/JNEUROSCI.3554-12.2013 690
Allen, G., Barnard, H., McColl, R., Hester, A.L., Fields, J.A., Weiner, M.F., Ringe, W.K., 691
Lipton, A.M., Brooker, M., McDonald, E., Rubin, C.D., Cullum, C.M., 2007. Reduced 692
Hippocampal Functional Connectivity in Alzheimer Disease. Arch. Neurol. 64, 1482. 693
doi:10.1001/archneur.64.10.1482 694
Amunts, K., Kedo, O., Kindler, M., Pieperhoff, P., Mohlberg, H., Shah, N.J., Habel, U., 695
Schneider, F., Zilles, K., 2005. Cytoarchitectonic mapping of the human amygdala, 696
hippocampal region and entorhinal cortex: intersubject variability and probability maps. 697
Anat. Embryol. (Berl). 210, 343–352. doi:10.1007/s00429-005-0025-5 698
Andersen, P., Morris, R., Amaral, D., Bliss, T., O’Keefe, J., 2007. The hippocampus book. 699
Oxford University Press. doi:10.1002/hipo.20355 700
Arshad, M., Stanley, J.A., Raz, N., 2017. Test–retest reliability and concurrent validity of in 701
vivo myelin content indices: Myelin water fraction and calibrated T1w/T2w image ratio. 702
Hum. Brain Mapp. 38, 1780–1790. doi:10.1002/hbm.23481 703
Ashburner, J., 2007. A fast diffeomorphic image registration algorithm. Neuroimage 38, 95– 704
113. doi:10.1016/j.neuroimage.2007.07.007 705
Ashburner, J., Friston, K.J., 2005. Unified segmentation. Neuroimage 26, 839–851. 706
doi:10.1016/j.neuroimage.2005.02.018 707
Augustinack, J.C., Helmer, K., Huber, K.E., Kakunoori, S., Zöllei, L., Fischl, B., 2010. Direct 708
visualization of the perforant pathway in the human brain with ex vivo diffusion tensor 709
imaging. Front. Hum. Neurosci. 4, 42. doi:10.3389/fnhum.2010.00042 710
Barth, C., Steele, C.J., Mueller, K., Rekkas, V.P., Arélin, K., Pampel, A., Burmann, I., 711
Kratzsch, J., Villringer, A., Sacher, J., 2016. In-vivo Dynamics of the Human 712
Hippocampus across the Menstrual Cycle. Sci. Rep. 6, 32833. doi:10.1038/srep32833 713
Bayrak, Ş., Khalil, A.A., Villringer, K., Fiebach, J.B., Villringer, A., Margulies, D.S., Ovadia-714
Caro, S., 2019. The impact of ischemic stroke on connectivity gradients. NeuroImage 715
Clin. 24. doi:10.1016/j.nicl.2019.101947 716
Bonnici, H.M., Chadwick, M.J., Maguire, E.A., 2013. Representations of recent and remote 717
autobiographical memories in hippocampal subfields. Hippocampus 23, 849–854. 718
doi:10.1002/hipo.22155 719
Cha, J., Greenberg, T., Song, I., Blair Simpson, H., Posner, J., Mujica-Parodi, L.R., 2016. 720
Abnormal hippocampal structure and function in clinical anxiety and comorbid 721
depression. Hippocampus 26, 545–53. doi:10.1002/hipo.22566 722
Chersi, F., Burgess, N., 2015. The Cognitive Architecture of Spatial Navigation: 723
Hippocampal and Striatal Contributions. Neuron 88, 64–77. 724
doi:10.1016/J.NEURON.2015.09.021 725
Clawson, W., Vicente, A.F., Ferraris, M., Bernard, C., Battaglia, D., Quilichini, P.P., 2019. 726
Computing hubs in the hippocampus and cortex. Sci. Adv. 5, eaax4843. 727
doi:10.1126/sciadv.aax4843 728
Colombo, M., Fernandez, T., Nakamura, K., Gross, C.G., 1998. Functional Differentiation 729
Along the Anterior-Posterior Axis of the Hippocampus in Monkeys. J. Neurophysiol. 80, 730
1002–1005. doi:10.1152/jn.1998.80.2.1002 731
Dalton, M.A., McCormick, C., Maguire, E.A., 2019. Differences in functional connectivity 732
along the anterior-posterior axis of human hippocampal subfields. Neuroimage 192, 38– 733
51. doi:10.1016/j.neuroimage.2019.02.066 734
DeKraker, J., Ferko, K.M., Lau, J.C., Köhler, S., Khan, A.R., 2018. Unfolding the 735