SPATIAL PLANNING AS A DRIVER FOR CHANGE IN BOTH MOBILITY
AND RESIDENTIAL ENERGY CONSUMPTIONS
S. Dujardin1; A-F. Marique1; J. Teller1
1: Lepur Université de Liège, 1 Chemin des Chevreuils, B52, 4000 Liège 1. Belgique
ABSTRACT
This paper presents the results of the first part of an important two-year research dedicated to analysing the impact of territorial structures upon GHG emissions in the Walloon Region (Belgium). The rationale of the research is to provide regional authorities with up-to-date figures about the long-term influence of land planning decisions upon energy consumptions and GHG emissions, both in the residential building stock as well as for home-to-work commuting. The analysis has been conducted at the regional scale (16.844 km2) and includes both urban, periurban and rural settlements. It appears that those sectors that perform well on mobility also tend to perform well in terms of building consumption. This opens an avenue towards a much more progressive approach in terms of spatial planning, where compact cities may be viewed as part of the solution, still not the whole solution. This is especially true when one considers the entire territorial structure of a region and its strong inertia over time.
INTRODUCTION
This paper presents the results of the first part of an important two-year research dedicated to analysing the impact of territorial structures upon GHG emissions in the Walloon Region. The rationale of the research is to provide regional authorities with up-to-date figures about the long-term influence of land planning decisions upon energy consumptions and GHG emissions, both in the residential building stock as well as for home-to-work commuting. Ultimately aspects covered by the research should cover both direct consequences (increase of travel distance due to sprawl f.i.) and indirect ones (brakes to the deployment of renewable technologies due to low building density f.i.) in a prospective approach at a 2040 horizon. This first year of research focused most especially on direct relations, considering ex-post factors: what has been the impact of the past
evolution of the territorial structure on building and energy consumptions in the Walloon Region?
Territorial structure is here addressed via three main variables: the location of households, employmentandmobilityinfrastructures(road, bus, train). Following Newman and Kenworthy [1], itisconsideredthatthe combination of these three variables is, first, a structural property of the territorythatmayaffectenergyuseviaitsincidenceonmobilityandhousingconsumptionpatterns. Increasing household densities generally implies more compact buildings (terraced houses and apartments), whichtends tolessenenergylosses.Mixingemploymentandhouseholdsallowsthe lattertofindajobatcloser locations, which may reduce their work travel distances as wellastravels relatedtoshopping, leisure etc. Obviously it should be acknowledged that there is an important behavioraldimensioninthisrelation[2].Theproximityofjobsdoesnotconstituteaguarantee that households will effectively select a job nearby home. Developing the analysis on a statistical basis allowstohighlightempirical trends in the relation between these variables and observed behaviors. The combination of these three variables is assumed to be an element that can somehow be handled by urban planning policies. Even if one can consider the effective influence of urban planninguponemploymentandhouseholdlocationswithmodestyorevencriticism[3], itshouldbe acknowledged thatplanning policies,at aEuropean level,ledto quite strikingdifferencesat this respect.ThisisparticularlythecasewhenonecompareslandoccupancyinBelgiumandthe Nether-lands, two neighboring countries with quite a different trajectory in terms of urban sprawl and mixed-useddevelopments.Thesepoliciescanonlyaffectsettlementpatternsonalongerterm, given theinertiaofterritorialstructures,whichpleasfor a consideration of these effects at a 2040 horizon.
METHODOLOGY
The overall methodology of the research is based on spatial correlations between energy performance indicators (for both mobility and residential building consumptions) with territorial variables (density, mixity, job/housing ratios, accessibility to public transport and road infrastructure) at a very disaggregated scale. Quite importantly it should be stressed that, by contrast with Newman and Kenworthy well known approach, our analysis has been entirely conducted at the regional scale (16.844 km2) and includes both urban, periurban and rural settlements.
For home-to-work commute, the model has been based on the general survey realized in Belgium every 10 years amongst all citizens more than 16 years old. The survey provides figures about distance travelled by citizens and their mode choice at the statistical unit level. This data has been used to build a mobility energy performance index, following Boussauw and Witlox [4]. It has been calculated for 1991 and 2001, corresponding to the last two general surveys in Belgium. The following conversion table has been used for estimating kWh per travel and passenger for the different travel modes.
Mode GWh % kWh/pkm Teq.CO2 % geq.CO2/pkm
Car 18722,0 94,4 0,45 4894,7 94,9 118,3
Moto, scooter 251,4 1,3 0,41 64,6 1,3 105,0
Bus, tram, metro 417,6 2,1 0,35 93,7 1,8 79,5
Train 451,1 2,3 0,15 104,4 2,0 35,7
Bike - - -
Walking - - -
Total 19842,1 100 - 5157,5 100 -
Table 1: Specific energy consumptions and CO2 emission per mode in the Walloon Region
This table is based on regional energy accounts, figures for distance travelled by mode as well as conversion factors for electricity to CO2 emissions provided by electric companies. It does not take into consideration known variations between public transport emissions/energy consumptions according to their occupancy. It is hence unfavorable to urban transports, which have higher occupancy rates than rural ones.
For residential building consumptions, the model has been based on combining cadastre surveys with buildings heights provided by digital photogrammetry, for some 850.000 residential buildings in the Walloon Region (namely 85% of the residential building stock). As the cadastre provides the age of buildings, this variable was used to estimate envelope and heating system performances for each building. This approach was also used by [5] and [6]. Thermal needs of buildings were estimated via a conventional method [7].
Building period U Wall (W/m2K) U Window (W/m2K) U Roof (W/m2K) U Floor (W/m2K) Ventil. rate (V/h) Window % <1945 2,2 3,3 1,6 1,9 1 24 1945-1970 1,4 3,3 1,4 1,5 1 27 1971-1985 0,8 3 1,0 2,4 0,9 25 1986-1996 0,5 2,6 0,9 0,7 0,9 25 1997-2010 0,5 2,4 0,7 0,7 0,7 26
Building periodsweredesignedsoastomatchwithimportanttechnical/thermalturning points, asfor instancetheadoption/changesofthermalregulationintheWalloonRegion(in1985,1996 and 2010). Table 2 provides an overview of thermal performance parameters used in the model. It is based on the most recent housing survey realized in the Walloon Region, which provides information about insulation of buildings for a sample of 6.000 housings [8]. It hence includes information about renovatedbuildings.Itcanbeseen from the table that wall, slab and roof performance of residential buildings in the Walloon Region are quite poor for older buildings. It should be stressed at this stage that some 52% of the housing stock in the Walloon Region is older than 1945.
Both analyses are conducted at the scale of statistical units, namely the most disaggregate spatial unit for collecting statistical data in Belgium. The territory of the Walloon Region is covered by 9.876statisticalunits.Theareaofstatisticalunitsisvaryingbetween1,3haand5834hawithamedian value of 47,7 ha, which corresponds to a circle of a bit less than 400 m radius. Statistical units correspondto neighborhoods in urban areas and encompass large depopulated zones in rural areas.
Home-work commute consumptions
The analysis highlights an increase of 20% in CO2 emissions per person and travel in the Walloon Region between 1991 and 2001. This is mainly due to the strength of sprawl and a modification of employment catchment areas. It is striking to note that amongst the 20 municipalities which witnessed the most important increase in their emission related to mobility, 18 of them are localized in the south of the region and somehow polarized by the city of Luxembourg.
Figure 1: Energy consumptions per travel and person for home-work commute in the Walloon Region at the statistical unit level
Figure 1 highlights that urban areas are characterized by lower energy consumptions and CO2 emissions and, at the opposite, rural and periurban areas by much higher energy consumptions. The issue of periurban areas is especially challenging since they now gather important volumes of population. Some of these areas witnessed a decrease or stabilization in their CO2 emissions over the 1991-2001 period, due to the relocation of jobs outside Brussels.
In terms of urban planning, this should lead to contrasted solutions in these different urban patterns. Even though urban areas have better performances than rural and periurban areas, energy consumptions per travel and passenger should still be reduced as they concentrate a large share of the population. At the opposite population growth in remote rural areas should be contained as it usually leads to important and long car travel distances. Finally, in periurban areas, a combination of reconcentration of housing and economic activities around efficient public transport hubs is probably the best option to curb the actual mobility and CO2 emission trends.
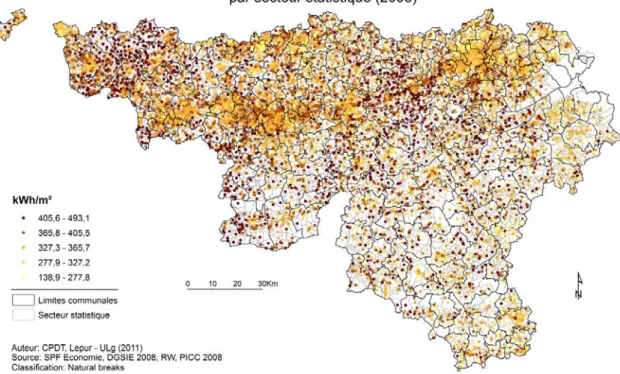
Residential building consumptions
When considering the entire housing stock, annual consumptions by floor square meter appear largely related with the age of construction, though they are also influenced by urban compactness and climate factors. Quite strikingly it appears that old urban areas generally have better performances than more recent periurban areas (Figure 2), especially for those buildings that were erected before 1985 at a time when there was no regulation on thermal performance of buildings. This period corresponds to an f intense sprawl in the Walloon Region. The thermal performance of existing residential buildings is very poor, with a mean annual consumption of some 350 kWh/floor m2 (standardised consumption along standard calculation).
Figure2:EnergyconsumptionsinresidentialbuildingsintheWalloonRegionatthestatisticalunitlevel
In dense urban areas, where the network of streets and buildings is now consolidated, improving the performance of buildings should now be an objective fully integrated within all urban regeneration policies. By contrast, in periurban areas, improving building performances could rather be achieved through demolition/reconstruction operations, especially in those cases where densification proves to be an interesting option when they have a due access to public transport, services, etc.
Residential vs. Mobility consumptions
As documented by the literature, it appears that these two indicators are both correlated to human density —as defined by Fouchier [9]— and mixity. Still correlation factors are rather weak (Table 3). Mobility performances are better correlated to mixity than to density, although these two variables are themselves correlated. By contrast, residential building performances are better correlated to density, which is linked to compactness, than to mixity.
Net human density inhabitants + jobs per ha
Net functional mixity nb of functions in the vicinity
IPE mobility (kg éq CO2/trip) -,483 ** -,504** IPE buildings (kWh / floor m²) -,603 ** -,545**
Table 3: Correlation test between indictors of density and mixity with energy performance indices (**) Correlation significant at 0.01 (2-tailed).
These results somehow ponder assertions by Newman and Kenworthy, linking energy performance of cities to the sole density. First, because there is a very important variance amongst statistical units along the observed trend: low density units may be characterized by very good performances. Additionally, it stresses the importance of mixity besides density for understanding and influencing travel behaviors.
Finally the performance of statistical units along the two dimensions observed until now can be crossed for the entire region (Figure 3). These units have been classified along their belonging to a hierarchy of 8 classes of municipalities in Belgium [10], according to their size and level of equipment (presence of higher education, metropolitan services, schools etc.).
Figure 3: Scatter of mobility and building performance indicators along the hierarchy of municipalities established by Van Hecke[10] for Belgium. GV= Large city; VR = Regional city; PVBE = Small city with good services; PVME = Small city with medium services; PVFE = Small city with poor services; CNUBE = Rural municipality with good services; CNUME = Rural municipality with medium services; CNUFE = Rural municipality with poor services
In general terms, it appears that those sectors that perform well in terms of mobility also tend to perform well in terms of building consumption and that the reverse is also true. Additionally, most rural settlements have higher than average consumptions both for mobility and building. Finally and most importantly, good performances are observed in all 8 types of human settlements (urban, rural and periurban ones), depending on the distance to employment centers and specificities of the urban pattern.
CONCLUSIONS
A method for a combined analysis of building and mobility performances has been established and applied to statistical units in Belgium. Results indicate that these performances are closely related to the nature of the statistical unit, both in terms of density and mixity, and that performances along these two axes are closely related. Still the analysis further highlights that statistical units with higher than average performances can be identified in all types of settlements, may these be urban, periurban or rural.
This opens an avenue towards a much more progressive approach in terms of spatial planning, where compact cities may be viewed as part of the solution, still not the whole solution. Indeed, planning policies should be tailored to each settlement types in order to curb progressively the entire scatter of points of Figure 3 towards the lower left side of the graph rather than through a very hypothetical and unrealistic claim to concentrate the population in compact cities. This way of planning, based on sharing efforts by all settlement types, is especially pertinent when one considers the entire territorial structure of a region and its strong inertia over time.
REFERENCES
1. Newman, P.W.G., Kenworthy, J.R.: Sustainability and Cities: Overcoming Automobile Dependence. Washington DC: Island Press, 1999.
2. Owens, S.: Energy, Planning and Urban Form. London: Pion Ltd., 117 p, 1986.
3. Breheny, M.: The compact city and the transport energy consumption. Transactions of the institute of British Geographers, Vol. 50, n°1, pp 285-304, 1995.
4. Boussauw, K., Witlox, F.: Introducing a commute-energy performance index for Flanders. Transportation Research Part A, n°43, pp 580-591, 2009.
5. Maizia, M., Menard, R., Nicolas, J.P., Teller, J., Viejo, P., Lacoste, G.: Les gisements du développement urbain : Analyse quantitative à l’horizon 2050 des consommations énergétiques et des émissions de CO2 des tissus urbains. Rapport PREBAT (non publié), 2008.
6. Marique, A.-F., Reiter, S.: A method to assess global energy requirements of suburban areas at the neighbourhood scale. In: Proceedings of the 7th International IAQVEC Conference on Indoor Air Quality, Ventilation and Energy Conservation in Buildings, Syracuse, New York, 2010.
7. Uyttenbroeck, J., Carpentier, G.: Estimation des besoins nets en énergie pour le chauffage des bâtiments, CSTC, Note d’information technique, 56 p, 1984.
8. Carlier, P., Fontaine, S., Monnier, B.: La qualité de l’habitat wallon : synthèse des résultats de l’enquête. Les Echos du Logement, n°4, pp 1-15, 2007.
9. Fouchier, V.: Les densités urbaines et le développement durable : le cas de l’Ile de France et des villes nouvelles, Paris : Secrétariat général du groupe central des villes nouvelles, 211pp, 1997.
10. Van Hecke, E.: Actualisation de la hiérarchie urbaine de Belgique. Bulletin du Crédit Communal, Vol. 3, n° 205, pp 45-76, 1998.
![Table 2 provides an overview of thermal performance parameters used in the model. It is based on the most recent housing survey realized in the Walloon Region, which provides information about insulation of buildings for a sample of 6.000 housings [8]](https://thumb-eu.123doks.com/thumbv2/123doknet/6135263.156663/3.892.131.765.572.956/provides-overview-performance-parameters-information-insulation-buildings-housings.webp)
![Figure 3: Scatter of mobility and building performance indicators along the hierarchy of municipalities established by Van Hecke[10] for Belgium](https://thumb-eu.123doks.com/thumbv2/123doknet/6135263.156663/5.892.117.786.518.1036/scatter-mobility-building-performance-indicators-hierarchy-municipalities-established.webp)
