To cite this version :
Tarrade, Laurent and Pineau, Gérard and
Calluaud, Damien and Texier, Alain and David, Laurent and
Larinier, Michel Detailed experimental study of hydrodynamic
turbulent flows generated in vertical slot fishways. (2011)
Environmental Fluid Mechanics, vol. 11 (n° 1). pp. 1-21. ISSN
1567-7419
O
pen
A
rchive
T
OULOUSE
A
rchive
O
uverte (
OATAO
)
OATAO is an open access repository that collects the work of Toulouse researchers and
makes it freely available over the web where possible.
This is an author-deposited version published in :
http://oatao.univ-toulouse.fr/
Eprints ID : 11266
To link to this article :
DOI: 10.1007/s10652-010-9198-4
http://dx.doi.org/10.1007/s10652-010-9198-4
Any correspondance concerning this service should be sent to the repository
administrator:
[email protected]
Detailed experimental study of hydrodynamic turbulent
flows generated in vertical slot fishways
L. Tarrade · G. Pineau · D. Calluaud · A. Texier · L. David · M. Larinier
Abstract The kinematics of hydrodynamic turbulent flows developed in vertical slot fish-ways (VSF) was studied in detail in flow patterns not yet published to date for the purposes of modifying existing devices and to allow for the passage of all fishes, particularly the smaller species. A transparent device based on the typical prototype dimensions of VSF in France was constructed for the experiment. The velocity measurements were carried out by Particle Image Velocimetry (PIV). These measurements were used to determine the various kine-matics parameters characterizing the flow. From the dimensions and slope of the fishway, two flow topologies highlighting the swirling pattern were proposed. The method of Proper Orthogonal Decomposition (POD) was used to undertake unsteady and energetic analyses to characterize the main phases of flow evolution that fish passing through the passage may encounter.
Keywords Turbulent flow · Vertical slot fishways · PIV · Measurements · POD
1 Introduction
With the European Water directive, the restoration of ecological continuity in the rivers, and more especially the longitudinal connectivity, became a major stake for the “regulated rivers”. The most effective solution from an ecological point of view, i.e. the total or partial
L. Tarrade · G. Pineau · D. Calluaud · A. Texier (
B
) · L. David Institut Pprime, CNRS-Université de Poitiers-ENSMA, UPR 3346, SP2MI Téléport 2, Boulevard Marie et Pierre Curie,BP 30179, 86962 Futuroscope Chasseneuil Cedex, France e-mail: [email protected]
M. Larinier
ONEMA, Pôle Ecohydraulique, Institut de Mécanique des Fluides de Toulouse, Allée du Professeur Camille Soula, 31400 Toulouse, France
pulling down of the obstacles, is seldom used, even on the works which are no longer used, more often for local opposition rather than for technical reason. Thus it remains the solution of the installation of crossing devices. Many devices were developed: fishways consisting of successive pools of various types (the passage of water from one pool to another being either by surface overflow, through notches, slots or orifices), baffle fishways, locks, elevators, and “nature-like” fish passes.
The vertical slot fishways (VSF) are the most frequently used in France, particularly on hydroelectric installations. The latter can be adapted to many local situations, particularly to the flows of the rivers and the variations of the water level both upstream and downstream of the installation. In addition, the VSF is adapted to the majority of the species present in the river and the sizes of the fishes concerned are taking into account in the geometrical dimensioning of the basins as well as the capacities of swim and the behaviour of migration of the various species. The main parameters of a VSF are the dimensions of the pools, the geometrical characteristics of the wall separating two slots, as well as the drop between the pools. These geometrical parameters determine (considering the upstream and downstream water levels) the hydraulic conditions in the pools, i.e. the flow pattern, the velocities as well as the flow passing through the slot.
The main design criteria for a vertical slot fish pass are the maximum head difference between the pools (1H ) and the maximum volumetric dissipated power Pv. The drop between the pools, which determines the maximum velocity in the jet, is straightforwardly defined by the target species. Pv (in Watts/m3) is a general indicator of the agitation level in the pools and can be expressed as Pv = ρg Q1H /Vol, where ρ is the density of water (1,000 kg/m3),
g the acceleration due to gravity (9.8 m/s2), Q the flow discharge in the facility (m3/s)
and Vol the volume of water in the pool (m3). The value of 200–250 W/m3 is generally
considered as the upper limit for salmonids [1,6]. This commonly-used and purely empir-ical criterion based on Pv values was proposed in the 1980s [2,5] when there was no sim-ple technical means for measuring the characteristics of turbulence in pools. This metric has the advantage of being easily accessible by calculation, on the other hand it is not exactly known what it physically corresponds to in terms of turbulence characteristics in the pools.
Several relevant turbulence parameters, which are deemed most important to migrating fish, have been identified: turbulence intensity, turbulent kinetic energy, vorticity, strain, eddy length scales [4,9,10]. Besides recent observations in VSF’s show that fish may take advantage of the unsteady character of the turbulent flow [19].
Nowadays, the turbulent characteristics of flows can be assessed by the use of measure-ment techniques such as Particle Image Velocimetry (PIV) and Acoustic Doppler Velocime-try (ADV). Several experimental studies have been carried out recently using microacoustic velocimeters [7,11] to measure velocities and different turbulence parameters such as turbu-lent kinetic energy and length scale of eddies in VSFs.
Experimental investigations were carried out in the Institut Pprime of the University of Poitiers (France) to better characterize the kinematics parameters of the flow like the mean velocity, the kinetic turbulent energy, the vorticity and the flow instationarity for several slopes, several flow discharges and different geometries of vertical slot fishway. This paper presents for two designs the mean vorticities and some unsteady quantities of the flow, which have not been shown before inside a vertical slot fishway.
For a more comprehensive overview of the results concerning mean flow and turbulent kinetic energy, the reader is directed to the papers of Tarrade et al. [15,16] and Wang et al. [19].
2 Experimental setup and postprocessing tools
2.1 Experimental device
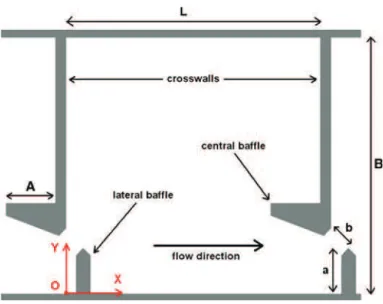
For this experimental study the geometry of the physical model used was based on an analysis of the geometry of VSFs built in France over the last 20 years, from which we defined an ‘average’ geometry. The fishway model conceived in the P’ Institute Laboratory was built at the largest possible geometrical scale to be able to carry out observations on the fish behav-iour in the future. The model was made of five pools, L = 0.75 m long and H = 0.55 m deep, installed in a plexiglass flume (Fig.1). The width of the slot was b = 0.075 m. Four different values of B, the pool width, have been tested: B = 0.675, 0.575, 0.50 and 0.425 m (B/b = 9– 5.67). The baffles in the pools had the following dimensions: A = 0.15 m ( A/b = 2), a = 0.1 m (a/b = 1.3) with “ A” being the length of the large central deflector and “a” being the length of the small side deflector. The model and the prototype were related by the Froude similitude, on a geometrical scale between 1/2.5 (for a small trout fish pass) and approximately 1/6 (for a large fish pass for shad and large diadromous species) depending on the dimensions of the prototype pools.
Three flow discharges in the fish pass were tested (18, 23, and 27 l/s) and the flume slope “S0” in this study could be set to 5, 10 or 15%, the reference slope being S0= 10%. These
values of the bottom slope encompassed the most commonly used fish pass slopes, which can vary from less than 7% for a large fishway for large species to more than 12% for a small trout fish pass. The cross-walls between pools were set vertically within the flume when the floor slope was set at 10%.
The adjustment of the average water level H in the basins was carried out by means of a guillotine placed at the end of the fishway and was controlled by a rackrail. The flow discharge was controlled by a hydraulic loop which made possible to adjust the measured prototype discharge by less than 5% of the set average discharge value.
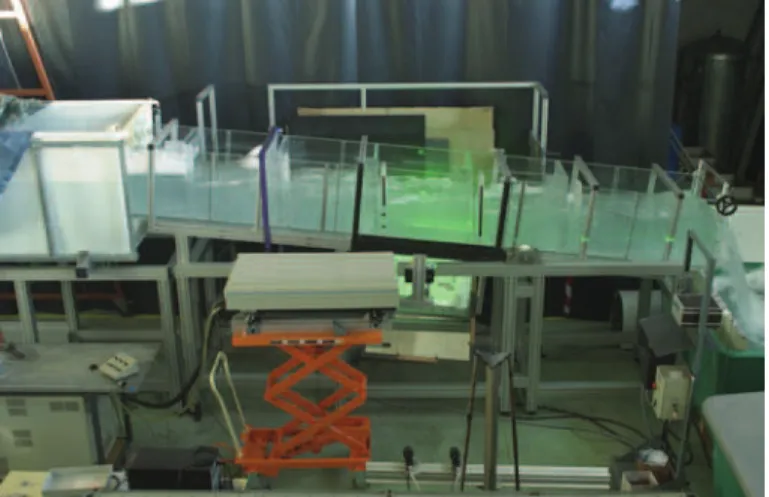
Fig. 2 Experimental device
The observations and the measurements were made in the third pool (Fig.2) where the
flow was fully established and the velocity conditions at the entrance and the exit were similar. Flow visualizations and two velocity components measurements by Particle Image Velocimetry (2C–2D PIV) were performed to obtain the flow topology and to quantify the unsteady characteristics of the fluid motions. All the experimental measurements were taken in the third pool to ensure a developed flow existed. PIV device was composed of a Nd-Yag laser (Spectra-Physics, 180 mJ/pulses) to illuminate the flow previously seeded by hollow glass particles (20 µm diameter). The laser sheet thickness was 1.5 mm and the flow was illu-minated in a plane parallel to the channel bed of the fishway at Z /b = 2. In order to record velocity fields with a large spatial resolution, two cameras 8 bits JAI of 1,600 × 1,200 pixels resolution were used with Nikon objectives of 50 mm. Those CCD cameras visualized the whole pool through a 45◦ mirror (Fig.2). The Hiris 2.1 software was used to synchronize the PIV acquisition system. Davis 7.2 software (LaVision Company) computed multi-passes cross-correlation analysis on successive images of final size 32 × 32 pixels with 50% overlap. Each camera visualized a common region which was used to merge the instantaneous velocity fields obtained. Consequently, two sets of 500 and 1,000 instantaneous velocity fields of the entire pool were acquired with a spatial resolution of 8 mm2and a frequency rate of 10 Hz.
2.2 Statistical and kinematics quantities extracted from PIV measurements
In order to study the dynamical behaviour of the flow in VSF, statistical and kinematics val-ues were calculated from a set of N = 1,000 instantaneous two components velocity fields,
ui! Ex, tj" recorded at Z/b = 2.
2.2.1 Mean, turbulence kinetic energy and vorticity estimations
A statistical description of flow requires the specification of the type of averaging procedure which is involved. There are at least three types of averaging which could be used to obtain statistical information about a flow system: averaging over space, averaging over time and averaging over an ensemble. In this paper, averaging over time of the velocity, ui(Ex), was
ui(Ex) = 1 N N # j =1 ui! Ex, tj " (1) PIV provides measurements of the two-dimensional, two-component velocity fields,
ui! Ex, tj", with spatial and temporal resolutions which are sufficiently high for the estimation
of:
– the turbulence energetic by turbulence kinetic energy (TKE), Eq.2
TKE(Ex) =1 2· $ u′21(Ex) + u′22(Ex)% with u′i(Ex) = 1 N N # j =1 & ui! Ex, tj" − ui(Ex) ' (2) If we accept the hypothesis that the Froude similitude applies to TKE in the same way as to mean kinetic energy, this quantity can be extrapolated to different pool size.
– the instantaneous out-of-plane component of vorticity ω! Ex, tj" = ω3! Ex, tj", Eq.3
ω! Ex, tj" = ∂u2! Ex, tj " ∂x1 −∂u1! Ex, tj " ∂x2 (3) – the mean vorticity, ω (Ex),
ω (Ex) = 1 N N # j =1 ω! Ex, tj " (4)
and the dimensionless vorticity, ω∗(Ex), calculated using U0and b. 2.2.2 Proper Orthogonal Decomposition: theoretical aspects
The Proper Orthogonal Decomposition (POD) allows for extracting the more energetic struc-tures and is useful to compare the instantaneous flow strucstruc-tures obtained from experimental or numerical data between several configurations. A popular technique for finding the eigen-functions is the method of snapshots developed by Sirovich [14] and explained in details by Cordier and Bergmann [3]. It was introduced as an efficient method when the resolution of the spatial domain is higher than the number of observations. This second method is classically used to analyze fluid behaviours obtained by PIV acquisitions—[12,17]. Consequently, in the study presented here, the PIV data obtained were analyzed by the snapshot POD approach to identify the flow structure evolutions in VSF.
The snapshot POD allows to decompose instantaneous velocity fields into a basis set of optimal (in the mean square sense) orthogonal eigenfunctions an(t ), which can be deduced
from this integral eigenvalue problem: (
T
R!t, t′" · a
n!t′" dt = λn· an(t ) (5)
where an(t )and λnare respectively the discrete eigenfunctions and eigenvalues.
R(t, t′)is the two point temporal correlation tensor of the velocity defined by:
R!t, t′" = 1 N
( (
6
ui(Ex, t ) · ui! Ex, t′" dx (6)
The projection of the instantaneous velocity fields onto the POD eigenfunctions provides the POD spatial coefficients Φi(n)(x, y). The POD allows to decouple between time and space variables and instantaneous velocity component ui(x, y, t )can then be approximated from
the following equation:
ui(Ex, t ) ≈ Nmod
#
j =1
aj(t ) · φi(j )(Ex) (7)
where Nmod is the number of spatial and temporal modes required for the velocity field
representation.
One of the properties of the POD is that λj represents the variance of the data set in
the direction of the corresponding POD mode, φi(j )(Ex). In physical terms, λj measures the
amount of kinetic energy captured by the respective POD mode, φi(j )(Ex). In this sense, the energy measures the contribution of each mode to the overall dynamics.
The relative energy captured by the j th mode, Ejis defined by:
Ej = λj )N mod # j =1 λj (8)
3 Mean flow behaviours
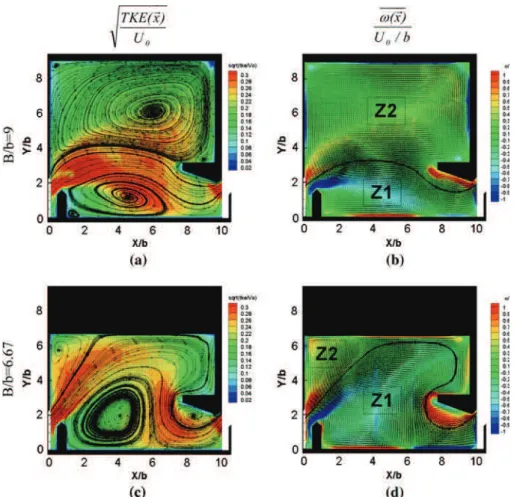
The topology of the flow in vertical slot fishway was composed of three main areas: a main curved jet produced by the slot, passing through the pool with decreasing velocity and two fully turbulent recirculation zones generated on each side of the jet, Fig.3. The fluid pattern seemed quasi-bidimensional and unrelated to the discharge. The influence of the hydraulic and geometric parameters on the flow topology and the influence of the main flow behav-iours (maximum of the velocity, turbulent kinetic energy) have been shown by [15,16,19]. According to Wang et al. [19], the location and the volume of the zones where TKE remained low varied with both the slope and the width. For a given slope, the volume of the zones with low values of turbulent energy increased considerably with the pool width. The maximum values of TKE were reached in the jet and on the edge of recirculation. This confirmed the presence of significant fluid movements and instationary velocity fluctuations. In this present work, we focused on the link between the flow vorticity and its impact on the dynamic for two fishway configurations:
– For a first flow pattern, existing for a configuration B/b = = 9, S0=10%, Q = 23 l/s, the principal flow leaving the slot entered the pools as a curved jet which opened out before converging again towards the next slot (Fig.3a, b). The jet created a large recirculation zone occupying roughly half of the pool between the cross-walls and had an unsteady beating movement around the large baffle.
– For a second flow pattern, existing for a configuration B/b = 6.67, S0= 10%, Q = 23 l/s,
the jet had a very curved form and hit the opposite side wall (Fig.3c, d). Two large contra-rotating swirls were then generated in the upstream corner of the pool and in the convex part of the jet and a smaller one occurred near the large baffle.
Figure3b and d present the vorticity of the mean flow for the two selected configurations. Whatever the fishway dimension, the flow was characterized by the strong shearing areas, *
* *ω (Ex)
* *
Fig. 3 Turbulent kinetic energy and vorticity for B/b = 9, and 6.67, S0= 10%, Q = 23 l/s
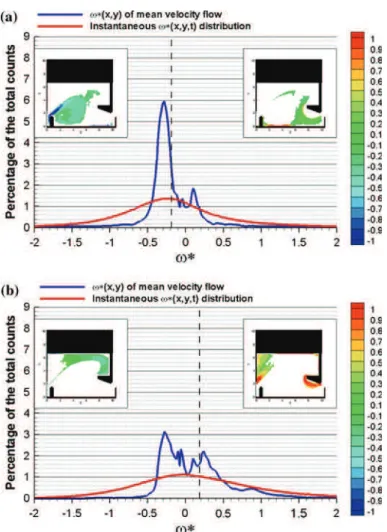
In order to quantify the contribution of the vorticity in the recirculation zones, two distinct regions, Z1 and Z2 have been defined (Fig.3b, d). The boundaries of those zones were the median streamline of the jet. For each zone, the probability densities function of the mean flow vorticity (Figs.4a, b,5a, b), blue lines were preformed and highlighted the vorticity distribution of the main recirculation cells.
In the zone Z1, for the configuration B/b = 9, the distribution was bimodal, mainly char-acterized by −0.8 ≤ ω (Ex)/(U0/b) ≤ 0.2 with a median value ω (Ex)/(U0/b) = −0.28.
The major mode was defined for ω (Ex)/(U0/b) ≈0 and emphasized the flow regions with
weak rotation or shearing regions. The second mode revealed the vortices with negative vorticity, ω (Ex)/(U0/b) ≈ −0.5. In the zone Z2, for the configuration B/b = 9, the
distri-bution was monomodal and defined by −0.2 ≤ ω (Ex)/(U0/b) ≤ 0.5 with a median value
ω (Ex)/(U0/b) = 0.14. The vortices of the zone Z2 were defined by a lower rotation rate
compared to the swirls of the zone Z1.
For B/b = 6.67, in the zone Z1, the distribution of ω (Ex)/(U0/b)was included between
−0.6 and +0.3 with a median value ω (Ex)/(U0/b) = −0.18. This zone was predominantly
marked by a fluid rotation ω (Ex)/(U0/b) ≈ −0.3. Two main rotation rates highlighted the zone Z2: ω (Ex)/(U0/b) = −0.3 and ω (Ex)/(U0/b) =0.2. The volumes taken by those two
Fig. 4 Probality density functions of the vorticity for B/b = 9, S0= 10%, Q = 23 l/s. a zone Z1 and
b zone Z2
rotation parts were even and respectively emphasized the effect of the jet curve in the zone Z2 and the regions of significant shearing close to the walls due to the flux of the jet near the upstream slot.
For the two widths studied, the maximum of vorticity were located on each side of the jet along the large deflector and in the core of the zone Z1 vortex. Significant shearing represents a barrier to be crossed by fishes for those volumes. Within the zone Z1, the intense rotation could also disorientate the small species fishes. Nevertheless, this mean description, although satisfactory as a first approach, was not completely representative of the flow. Indeed if we focused on the probability density functions of the instantaneous vorticity fields (red lines, Fig.5a, b), a dispersal of the instantaneous vorticity was emphasized whatever the zone and the width of the fishway. Significant differences were highlighted between the maximum of the mean flow vorticity (blue lines) and the instantaneous flow vorticity (red lines) for all the zones. This can prove that strong intensity variations of the vortex structures were created with the time. Consequently, the mean flow represented only a part of the flow evolutions developed in the VSF. This flow was characterized by significant velocity fluctuations with
Fig. 5 Probability density functions of the vorticity for B/b = 6.67, S0= 10%, Q = 23 l/s. a zone Z1 and
b zone Z2
the time which could be quantified by the TKE values. To estimate values such as the vortic-ity, the maximum of the velocities, which are physical barriers for the migration of the fish, the instationary behaviour of the swirling structures must be described precisely.
4 Unsteady flow behaviours
In the previous section, we showed that the mean flow generated in the vertical slot fishway can be mainly divided into three parts: a main curved jet crossing the pool with decreas-ing velocities and two fully turbulent eddies generated on each side. However, such a flow appeared to be strongly unsteady. In order to study the time evolution of the flow and to characterize the main phases of the topology, a preliminary qualitative approach consisted to analyze the PIV instantaneous velocity fields and then, a more detailed analysis of the differ-ent spatial and temporal modes would be proposed by using a POD. Finally, the extraction
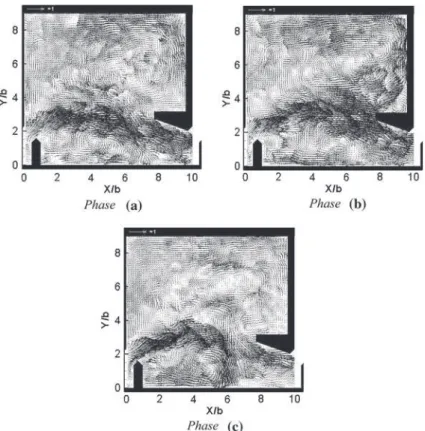
Fig. 6 PIV instantaneous velocity fields characterizing the various phases of the flow. B/b = 9, S0= 10%,
Q =23 l/s
of instantaneous vorticity from the POD decomposition would give some information about the main vortex structures of the flow.
The sequences of instantaneous velocity fields showed that the jet beat alternatively upwards and downwards, due to the combined effects of the velocity bursts coming from the upstream slot and the exchanges of fluid with the main vortices. For the first flow model (B/b = 9, Q = 23 l/s, Slope S0 = 10%) and according to whether the jet beat on one side or
the other one, it fed the recirculation zone located between the lateral deflectors or the upper primary eddy. When the jet was made up of strong velocities, it stretched and tended to move towards the upper lateral wall (Fig.6, phase (a)). Consequently, the jet divided into two parts when in contact with the central deflector. A main part moved towards the following slot and the second fed the upper vortex with a high speed recirculation flow following the upper walls. This back flow moved along the upstream wall towards the slot and disturbed the jet by modifying notably its slope. It should be noted the presence of a small recirculation cell in the corner of the central deflector for this flow configuration.
The reorientation of the jet influenced the flow topology within the pool. In a second phase, the jet became thinner and had a trajectory converging directly towards the following slot (Fig.6, phase (b)). It almost did not feed anymore the upper recirculation zone but mainly fed the lower vortex whose form evolved quickly with the time, i.e. the jet curvature increased (Fig.6, phase (c)). The attachment point located on the lower lateral wall separating the main
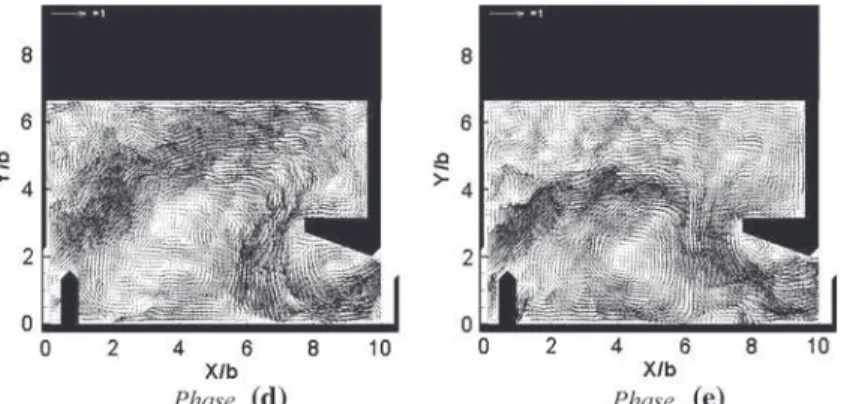
Fig. 7 PIV instantaneous velocity field characterizing the various phases of the flow. B/b = 6.67, S0= 10%,
Q =23 l/s
flow and the lower vortex was subjected to important fluctuations that still highlighted the jet beating.
Contrary to the flow within the large pool (width B/b = 9), the jet beating was less impor-tant for the second flow model (B/b = 6.66, Q = 23 l/s, Slope S0=10%), mainly resulting
in a stretching of the jet. When the jet was strong, it impacted the opposite side wall which it skirted to the central deflector (Fig.7, phase (d)) while feeding its convex part into the recirculation zone. This skirting flow gave rise to a separation bulb located under this same deflector. We also noted the presence of a counter-clockwise-rotating structure located near the left higher corner, structure usually called Upstream Secondary Eddy (USE) to describe the cavity flow topology in the literature [8].
When the jet was less strong (Fig.7, phase (e)), its impact zone on the side wall shifted upstream, the skirting of the central deflector was less important, the principal swirl was further reduced and the flow converged more directly towards the following slot. When the jet became strong again, the process tended towards the phase (d) again: one observed successively the two configurations of the flow topology.
4.1 POD analysis
The different flow patterns have been noted from 2C-2D PIV instantaneous measurements. In order to understand those processes and to highlight the influence of the vorticity in the flow organization and dynamic, the POD of the instantaneous data has been performed.
4.1.1 Cumulated energy
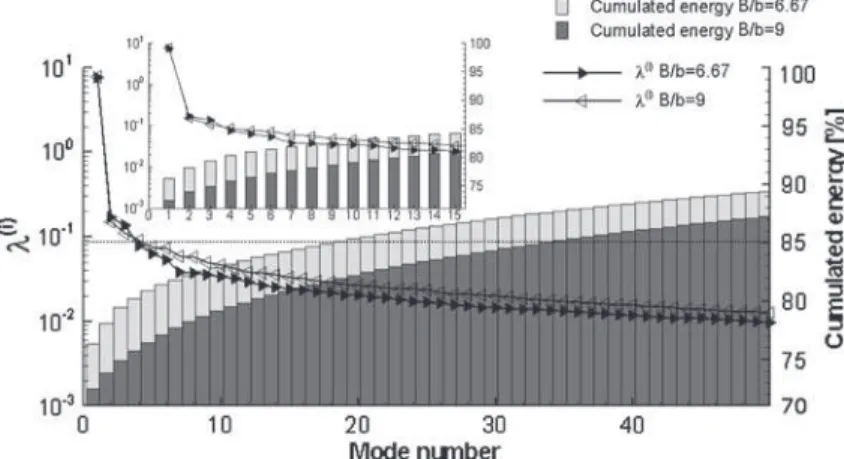
Figure8shows the relative energy of 50 first POD modes calculated on the instantaneous velocities. For the two study configurations, more than 70% of the total kinetic energy was contained in the first POD mode which described the mean flow behaviour. Nevertheless for the type II configuration (B/b = 6.67), the first mode included more energy than the type I configuration (B/b = 9). Moreover 85% of the total kinetic energy was completely defined by respectively 19 and 34 POD modes for the configurations B/b = 6.67 and B/b = 9. For the configuration B/b = 6.67, the total kinetic energy content of the mean flow motion was dominant compared to the fluctuating energy. The fluctuating evolutions described by modes
Fig. 8 Eigenvalues and cumulated energy evolutions as a function of number of modes for B/b = 9 and 6.67,
S0= 10%, Q = 23 l/s
higher than 2 were characterized by an uncomplicated flow dynamic defined by two jet fluxes and a poor contribution of the beating on the flow motions.
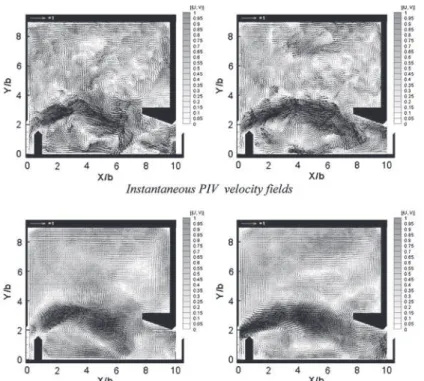
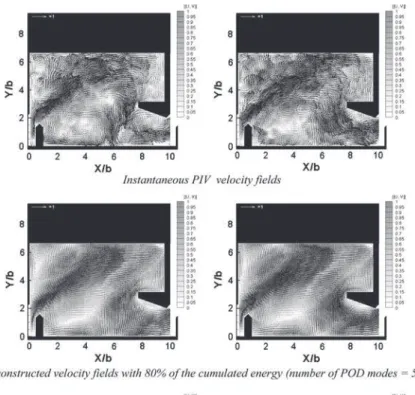
Figures9and10show a time snapshot of various reconstructions with successively higher-order POD modes. As the number of modes increased, high-dimensional features such as the jet motions became more visible. Furthermore each individual reconstructed velocity field showed the same behaviour of the two main recirculations initially defined by the mean flow topology. In addition to the jet beating defined by the first modes, the flow developed in the VSF was dominated by large scale turbulent swirls. To reconstruct the turbulent dynamics generated within the zones of recirculation, it was necessary to consider at least one set of the modes which contained 85% of total kinetic energy. This reconstruction allowed us to correctly define the topology of the flow, the instantaneous variations of the jet curve and its beating, the position of the separation point, the motions of the main vortices as well as the instantaneous spatial distribution of the velocity. However, with 85% or even 90% of total kinetic energy, no coherent structures with small scales were visible on the reconstructed fields. The kinetic energy content of the small scale coherent structures contributed only slightly to the dynamics of the flow. The energy signature of these small size vortices defined less than 10% of total kinetic energy.
4.1.2 Spatial and temporal POD basis
The study of POD spatial basis allowed us to quantify and to sort out several regions of the flow such as the dynamics and fluid motions. According to the properties of the POD, the spa-tial bases were energetic projections of the flow. The spaspa-tial bases were not representations of the real topologies (Figs.11,12).
Besides the mean flow topology, the type I configuration was governed, from an energy point of view, by the important fluctuations imposed by the beating of the jet, Fig. 11. The first mode represented the mean features of the flow. The mode 2 can roughly describe the beating of the jet. The region where the beating was generated and the linked motion of the reattachment point were underlined by this spatial base. The 3rd spatial base showed a large spatial evolution of the flow in the centre of the pool. This POD mode 3 character-ized the bursts process. These two processes were linked by a kinetic energy signature with
Fig. 11 Spatial POD basis for B/b = 9, S0= 10%, Q = 23 l/s
the same weight due to the very close corresponding eigenvalues. The 4th and 5th spatial bases defined spatio-temporal evolutions related to the consequences of the beating of the jet: the spatial fluctuations close to the upstream slot and the preferential motions of the jet close to the large baffle and the downstream slot. Identically in Fig.12for the configuration
Fig. 12 Spatial POD basis for B/b = 6.67, S0= 10%, Q = 23 l/s
base), its beating near the large deflector (3rd spatial base), the preferential motions of the jet (4th and 5th spatial bases) by increasing the total kinetic energy. For each fishway con-figuration, the superior spatial bases revealed the secondary dynamics with low total kinetic energy contents, which defined the instationary behaviours and the turbulent aspects of the flow.
Fig. 13 Temporal POD basis for B/b = 9, S0= 10%, Q = 23 l/s
Fig. 14 Temporal POD coefficients for B/b = 6.67, S0= 10%, Q = 23 l/s
Consequently the major processes defining the beating of the jet and the main spatial evo-lutions were correctly described by the first 5 POD modes. The analysis of the corresponding temporal coefficients made possible to emphasize the time evolution of those processes, Figs.13and14. A FFT study of the temporal bases highlighted the significant frequencies of the velocity fluctuations. The main beating of the jet motions were defined by temporal evolution with frequency peaks of 0.12 and 0.08 Hz. These results confirmed the temporal analyses by FFT already obtained [18].
4.1.3 Flow dynamics and contributed vortices
The global dynamic of the flow was governed by the various instationary processes (beating of the jet, velocity bursts) characterized by the first fluctuating POD modes and the large size vortices on both sides of the jet defined by the mean flow. Those recirculation structures undertook important instantaneous variations of the curve of the jet. The POD reconstructed snapshots with 85% of the total kinetic energy allowed us to describe in details the dynamics of the flow. To identify the part of the contribution of the main coherent structures on the total
Fig. 15 Instantaneous vorticity evolutions per zones for B/b = 9 (a) and B/b = 6.67 (b) and S0 = 10%,
Q =23 l/s
kinetic energy and on the instantaneous flow topology, averaging over space of the vorticity per zones Z1or Z2(cf. Fig.3b and d) were performed for each snapshot:
ω∗Z!tj" = $ 1 nZ +nZ i =1ω! Exi,tj "% (U0/b) (9) where nZis the number of acquisitions points Exiin the zone Zi (i = 1 or 2) (Fig.15a and b).
This value represented the variations according to the time of instantaneous global rota-tions within each zone. It characterized the main cells of the vortices and allowed us to highlight the differences between the densities of probability of the mean flow vorticity and the instantaneous vorticity, Fig.15a and b. Whatever the fishway configurations or the zones studied, ω∗Z!tj" determined from the original PIV velocity fields emphasized the dynamics of
the flow. Excluding the zone Z2, for configuration B/b = 9, the instantaneous vorticity varied around its median value ± 0.1. This time evolution emphasized significant size variations of the main swirl of recirculation. On the contrary, the Z2 zone, for configuration the B/b = 9, was governed by no time variation. The recirculation core in this zone was so controlled by the mean flow rotation behaviours.
The evolution of ω∗Z!tj" calculated by the reconstructed velocity fields with 85% of the
Fig. 16 Instantaneous velocity fields and vorticity isocontours of the original PIV data and reconstructed
snapshots for B/b = 9 and B/b = 6.67, S0= 10%, Q = 23 l/s
small size vortices (which were not taken into account with 85% of the total kinetic energy) had weak contribution to the dynamics of the recirculation core on both sides of the jet. The “subtraction” between an original instantaneous PIV snapshot and a reconstructed snapshot emphasized the sizes, the rotation rates and the spatial distributions of these small vortices. An example for each fishway configuration is presented in Fig.16. The small size vortices visualized were defined by significant rotation rates and were localised in the shearing region of the jet. Those small size coherent structures did not take part into the spatial and temporal evolution of the large recirculations areas and of the natural beating of the jet.
5 Conclusion
The turbulent hydrodynamic flows developed in VSF were mainly characterized by a strong jet (the core of the flow) which generated large fluid recirculations in each basin, which supported the dissipation of the jet energy. The purpose of this study was to examine in detail the kinematics of these flows for two widths and to analyse the mean and the fluctuating contributions.
In order to precisely characterize these flows, a transparent experimental device has been designed according to the typical dimensions of existing VSF in France which allowed a Fro-ude similitFro-ude on a geometrical scale in the range of 1/2.5 and 1/6 between the model and the prototype. In these conditions, the flow was highly turbulent and the effect of the Reynolds number variation was considered lower than the Froude effect. Tarrade et al. [16] have shown the small variation of the topology of the flow with the flow rate. The representation of the data has also been chosen in the dimensionless form. Two-dimensional measurements by PIV were performed to determine various kinematic parameters such as the velocity amplitude, the turbulent kinematic energy and the vorticity, and were supplemented by an unsteady and energetic analysis of the flow by means of the POD.
The two-dimensional velocity measurements have highlighted two flow topologies that differed according to the pool width and the channel slope:
– a first flow model, for the widest basins, in which a relatively straight jet resulting from the slot generated two great contrarotating recirculations on both sides.
– a second flow model, for the narrowest basins, in which a curved jet impacted the opposite side wall of the basin, creating an intense recirculation in its convex part.
Tarrade et al. [16] have shown that the slope had a strong influence on the average and turbulent kinematics values. The mean velocities and the turbulent kinetic energies increased with the slope of the bottom channel. On the other hand, a discharge variation resulted in a variation of the water level and had a little influence on the flow characteristics. The flow can be regarded as quasi two-dimensional. The vertical component of the mean velocity was more significant in the jet than in the recirculations. Wang et al. [19] have completed this analysis by using fishes to determine the rest zones and the different trajectories in relation to the velocity amplitude and the square root of the turbulent kinetic energy. In this paper the mean vorticity fields demonstrated that the shear was very significant inside a pool for the different widths and could be a barrier for the fish migration as Silva et al. [13] have shown recently for barbell. The high level of the square of the TKE in the main jet and the high variation between the mean vorticity and the instantaneous vorticity distributions showed that only a part of the flow dynamics was approached by studying the mean behaviour.
The examination of the unsteady evolution of the flow showed that the jet beat alternatively from left to right due to the combined effects of the variation of the strong velocities resulting from the slot and the alternating flows of the main swirls. Spatio-temporal analysis has been undertaken to evaluate the beat frequency and the amplitude of the different motions on the unsteady flows. Low frequencies at 0.12 and 0.08 Hz for the widths B/b = 9 and 6.67 have been extracted from POD analysis and were confirmed by ADV measurements. The instan-taneous vorticity has been evaluated and more than 85% of the flow energy was associated to the large vortex structures and the main dynamic of the flow. Localization of maximum of the instantaneous velocity, the mean velocity, the turbulent kinetic energy, the mean vorticity and the instantaneous vorticity are now well-known and could help us in the future to better understand the trajectories and the organisation of the fish migration within VSF.
Acknowledgments The financial support provided for this work by “Office National de l’Eau et des Milieux Aquatiques” (ONEMA) and “Voies Navigables de France” (VNF).
References
1. Bates K (2000) Fishway guidelines for Washington State. Washington Department of Fish and Wildlife, Washington, 57 pp
2. Bell M (1986) Fisheries handbook of engineering requirements and biological criteria. Fish Passage Development and Evaluation Program, US Army Corps of Engineers, North Pacific Division Portland, OR, 290 pp
3. Cordier L, Bergmann M (2002a) Proper orthogonal decomposition: an overview. In: Lectures series 2002–2004 on post-processing of experimental and numerical data, Von Karman Institute for fluid dynamics
4. Hotchkiss R (2002) Turbulence investigation and reproduction for assisting downstream migrating juve-nile salmonids, part I; BPA Report DOE/BP-00004633-I, Bonneville Power Administration, Portland, OR, 138 pp
5. Larinier M. (1983) Guide pour la conception des dispositifs de franchissement des barrages par les poissons migrateurs. Bull Fr Piscic, Hors Série, pp 1–39.www.kmae-journal.org/
6. Larinier M, Travade F, Porcher JP (2002) Fishways: biological basis, design criteria and monitoring. Bull Fr Pêche Pisc 364:1–208
7. Liu M, Rajaratnam N, Zhu dZ (2006) Mean flow and turbulence structure in vertical slot fishways. J Hydraul Eng 132(8):765–777
8. Migeon C, Texier A, Pineau G (2000) Effects of lid-driven cavity shape on the flow establishment phase. J Fluids Struct 14:469–488
9. Odeh M, Noreika JF, Haro A, Maynard A, Castro-Santos T, Cada GF (2002) Evaluation of the effects of turbulence on the behavior of migratory fish. Final Report 2002 to Bonneville Power Administration, Portland, OR, USA, 55 pp
10. Pavlov DS, Lupandin IA, Skorobogatov MA (2000) The effects of flow turbulence on the behavior and distribution of fish. J Ichthyol 40:S232–S261
11. Puertas J, Pena L, Teijeiro T (2004) An experimental approach to the hydraulics of vertical slot fishways. J Hydraul Eng 130(1):10–23
12. Santa Cruz A, David L, Pécheux J, Texier A (2005) Characterization of the passive stabilizer control effect downstream a half cylinder wake formation with a proper-orthogonal-decomposition tool. Exp Fluids 39:730–742
13. Silva AT, Santos JM, Ferreira MT, Pinheiro AN, Katopodis C (2010) Effects of water velocity and tur-bulence on the behaviour of Iberian barbel (Luciobarbus bocagei, Steindachner 1864) in an experimental pool-type fishway. River Res Appl online
14. Sirovich L (1987) Turbulence and the dynamics of coherent structures Part I: coherent structures. Q Appl Math XLV 3:561–571
15. Tarrade L, Texier A, David L, Larinier M (2007) An experimental study of turbulent flow in vertical slot fishways: adaptation to the small fish species. In: 6th international symposium on ecohydraulics, New Zealand
16. Tarrade L, Texier A, David L, Larinier M (2008) Topologies and measurements of turbulent flow in vertical slot fishways. Hydrobiologia 609:177–188
17. Vernet R, Thomas L, David L (2009) Analysis and reconstruction of a pulsed jet in crossflow by multi-plane snapshot POD. Exp Fluids 47:707–720
18. Wang RW, Calluaud D, Pineau G, Larinier M, Texier A, David D (2009) Study of unsteady flow in a vertical slot fish pass. In: 33rd IAHR biennial congress: Water Engineering for a Sustainable Environment, Vancouver, Canada
19. Wang RW, David L, Larinier M (2010) Contribution of experimental fluid mechanics to the design of vertical slot fish passes. Knowl Manag Aquat Ecosyst, no. 396-02, doi:10.1051/kmae/2010002