Preoperative Evaluation of 54 Gliomas by PET
with Fluorine-18-Fluorodeoxyglucose
and/or
Carbon-11 -Methionine
Bruno Kaschten, Achille Stevenaert, Bernard Sadzot, Manuel Deprez, Christian Degueldre, Guy Del Fiore, AndréLuxen and Michel Reznik
Departments of Neurosurgery, Neurology and Neuropathology, University Hospital of Liège and Cyclotron Research Center, University of Liège, Liège, Belgium
This study evaluates the usefulness of PET for the preoperative evaluation of brain gliomas and methods of quantification of PET results. Methods: Fifty-four patients with brain gliomas were studied by PET with 18F-fluorodeoxyglucose (FDG) (n = 45) and/or 11C-methionine (MET) (n = 41) before any treatment. Results of visual analysis, calculation of glucose consumption and five tumor-to-normal brain ratios for both tracers were correlated with two histologie grading systems and with follow-up. Results: Visual analysis (for FDG) and tumor-to-mean cortical uptake (T7MCU) ratio proved to be the best tools for the evaluation of PET results. Methionine was proven to be better than FDG at delineating low-grade gliomas. Tumor-to-mean cortical uptake ratios for FDG and MET were clearly correlated (r = 0.78), leading to the equation T/MCUFDG = 0.4-T/MCUMET. We showed a good correlation be tween FDG PET and histologie grading. MET uptake could not differentiate between low-grade and anaplastic astrocytomas but was significantly increased in glioblastomas. Low-grade oligoden-drogliomas exhibited high uptake of FDG and MET, probably depending more on oligodendroglial cellular differentiation than on proliferative potential. Uptake was decreased in anaplastic oligoden-drogliomas, probably due to dedifferentiation. Care must be taken with peculiar histologie subgroups, i.e., juvenile pilocytic astrocyto mas and oligodendrogliomas, because of a discrepancy between high PET metabolism and low proliferative potential (good progno sis). Both tracers proved useful for the prediction of survival prog nosis. Methionine proved slightly superior to FDG for predicting the histologie grade and prognosis of gliomas, despite the impossibility of differentiation between Grades II and III astrocytomas with MET. This superiority of MET could be explained by patient sampling (low number of Grade III gliomas submitted to examination with both tracers). The combination of both tracers improved the overall results compared to each tracer alone. Conclusion: Both tracers are useful for the prediction of the histologie grade and prognosis. The apparent superiority of MET over FDG could be due to the small number of Grade III gliomas studied with both tracers.
Key Words: brain neoplasms; gliomas; PET; fluorine-18-fluorode-oxyglucose; carbon-11 -methionine
J NucÃ-Med 1998; 39:778-785
.Tor a few years, PET has been used for evaluation of brain tumors (detection of a tumor, prediction of the histologie grade of gliomas, prediction of prognosis, evaluation of response to treatment and differential diagnosis between recurrence and radiation necrosis) (1-11). The most widely used tracer is certainly fluorine-18-fluorodeoxyglucose (FDG). A method of absolute parametric quantification is available for this tracer,
which might be seen as an advantage. FDG is, however, a
nonspecific tracer, which sometimes limits its interest. For
Received May 2, 1997; revision accepted Aug. 5, 1997.
For correspondence or reprints contact: Bruno Kaschten, MD, Department of Neurosurgery, C.H.U. Sart-Tilman (B35), B-4000 Liège,Belgium.
example, low-grade gliomas are usually seen as hypometabolic lesions that are undistinguishable from other pathologies, such as ischemie lesions. Carbon-11 -methionine (MET), an amino acid, might be better to detect these low-grade tumors. Both tracers have advantages and limitations, but only a few centers have published comparative results using both tracers in small series of patients with gliomas (12-14) (Table 1). Combined studies on larger groups of patients are necessary to determine which is the best tracer to use for the specific clinical problem. Moreover, the combination of both tracers can give valuable indications concerning the metabolism and the rate of expan sion of these tumors.
In some previous reports, relationships were found between FDG uptake and the histologie grade of gliomas (1,3,9,13), the tumor cell density (75) and the survival prognosis (5,7,16,17). Correlations also were demonstrated between MET uptake and histology (6,13,14,18,19), but so far no correlation has been demonstrated between MET uptake and survival prognosis.
Most of the published large series included heterogeneous groups of patients, some evaluated before treatment and others studied after treatments such as radiation therapy or chemother apy, which certainly modify the metabolism of the normal brain as well as of the tumor tissue. The preoperative prediction of histologie grade or survival prognosis requires objective crite ria. Consequently, from a series of about 300 PET examinations
of brain gliomas performed in our center, we selected 54
patients (86 PET examinations) who were evaluated before any treatment that could have interfered with the metabolism, except for corticoids (20) or antiepileptic drugs (21-23).
There is no consensus on the best method to analyze PET studies in patients with gliomas. We have, therefore, evaluated our PET examinations according to several methods described in the literature, to compare their usefulness in clinical practice. MATERIALS AND METHODS
Patients
We evaluated 54 patients (28 men and 26 women) with sus pected brain gliomas before they had received any treatment. PET examinations were performed on 13 patients with FDG alone, on 9 patients with MET alone and on 32 patients with both tracers. Mean age was 50 ±17 yr (age range 12.8-74.9 yr). Time from first symptoms to surgery ranged from 0.4 mo to 10 yr (mean
age =11.5 mo).
Pathologic diagnosis was obtained by open surgery (n = 40) or stereotactic biopsy (n = 9). In five patients in which no pathologic examination was obtained, the diagnosis of low-grade astrocytoma (4 patients) or low-grade oligodendroglioma (1 patient exhibiting calcifications on CT) was based on radiologie investigations and confirmed by the clinical follow-up (all patients stable without any treatment). All available specimens were reviewed by two
neuro-TABLE 1
Previously Published Series Comparing PET with Glucose and MET in Brain Tumors
First author (Ref.)Ericson (72)Ogawa (73)Derlon (74)No. of patients
(no. ofgliomas)16(14)11(9)22Tracers11C-MET11C-glucose"C-MET18F-FDG"C-MET18F-FDGCorrelationwithhistologyNot studiedNot studiedYesYesYes-Yes*Correlation withsurvivalNot studiedNot studiedNot studiedNot studiedNot studiedNot studied 'Correlation with histologie type (astrocytoma compared to oligodendroglioma) but not with histologie grade (included only low-grade gliomas).
pathologists according to the World Health Organization (WHO)
(24) and Mayo-Sainte Anne (25) classifications.
According to the WHO classification (n = 54), the distribution of specimens was as follows: I juvenile pilocytic astrocytoma (JPA; Grade I), 23 low-grade (Grade II) gliomas, 10 anaplastic (Grade III) gliomas and 20 glioblastomas (Grade IV). Grade II and III gliomas were divided into three subgroups: astrocytomas (Group A), oligodendrogliomas (Group O) and mixed oligoastro-cytomas (Group OA) (Table 2). According to the Mayo-Sainte Anne classification (n = 49 because the five patients without surgical histology were not included), there were 2 Grade I, 18 Grade II, 6 Grade III and 23 Grade IV gliomas.
The 32 patients submitted to PET examination with both tracers included 1 JPA, 19 WHO Grade II gliomas (12 Group A, 5 Group OA and 2 Group O), only 2 Grade III gliomas (1 Group OA and 1 Group O) and 10 Grade IV astrocytomas (glioblastomas). The relative lack of Grade III gliomas and its influence on the results is discussed below.
In most patients (n = 44), PET was performed within a few days before surgery. In five patients with low-grade gliomas, the time between PET and surgery ranged from 2-8 mo, without clinical or radiologie evidence of tumor modification during this time. In the five patients without pathologic verification, the day of PET examination was considered the reference for the follow-up.
Postoperatively, 37 patients were treated by radiation therapy, and 1 patient was treated by brachytherapy. At time of recurrence, 6 patients underwent reoperation (4 resections and 2 biopsies), 1 patient received radiation therapy and 10 patients were treated by chemotherapy with carmustine. Follow-up ranged from 1 to 86 mo (mean follow-up = 18 mo). At time of completion of this study, 25 patients were dead: 3 with Grade II astrocytomas, 6 with Grade III astrocytomas and 16 with Grade IV astrocytomas (glioblastomas).
PET Methods
The first PET examinations (16 patients) were performed with a NeuroEcat tomograph (EG&G ORTEC, Oak Ridge, TN) (intrinsic resolution = 8 mm FWHM), providing only two simultaneous slices in high-resolution mode. Since 1992 (38 patients), PET examinations have been performed with a Siemens ECAT 951/31R camera (CTI PET Systems, Inc., Knoxville, TN), imaging 31
TABLE 2
Pathologic Results According to WHO Classification (n = 54)
Grade1IIIIIIVNo. ofastrocytomas(Group A)116620No. ofoligoastrocytomas(Group OA)51No. ofoligodendrogliomas(Group O)23
planes simultaneously over an axial length of 10.8 cm (resolu tion = 6 mm FWHM).
Patients fasted for at least 4 hr before the PET examination. PET images were acquired with the patients in a resting state, with their eyes closed and with minimum ambient noise. Imaging planes were oriented parallel to the canthomeatal line. In 54 PET examinations, transmission images first were obtained to correct for photon attenuation; in 32 PET examinations, attenuation correction was performed with a skull-fitting, operator-drawn ellipse method. A dose of 222-370 MBq (6-10 mCi) FDG or 481-740 MBq (13-20 mCi) MET was injected intravenously within 1 min. Static emis sion scanning was performed for a 20-min period, beginning at least 10 min after MET injection or at least 30 min after FDG injection. In 30 patients, arterial blood samples obtained after FDG injection allowed the calculation of the cerebral metabolic rate of glucose (CMRG1; in mg/100 g/min) of the tumor, after the method of Sokoloff et al. (26) and the operational equation derived by Phelps et al. (27).
When both tracers were injected into the patient on the same day (n = 24), MET PET was performed first, considering the short half-life of "C (20 min), and FDG PET then was performed after a sufficient time had elapsed to allow for UC decay (at least five periods or 100 min).
Data Analysis
In all cases, CT and MRI data were available during PET examination and during evaluation and quantification of the results. Fusion of MRI images over PET data was used only recently for the last patients.
Images were first evaluated by comparison with the surrounding brain parenchyma [regardless of whether it was cortex (CTX) or white matter (WT)] and classified as follows:
1. +, hypermetabolic lesion (hot spot); 2. —,hypometabolic lesion (cold spot); and
3. O, lesion difficult to distinguish from surrounding brain tissue.
Lesions were then rated by visual analysis according to Schifter et al. (16):
1. Grade I, uptake by the tumor lower than that of WM; 2. Grade II, uptake equal to that of WM;
3. Grade III, uptake between those of WM and CTX; 4. Grade IV uptake equal to that of CTX; and 5. Grade V, uptake higher than that of CTX.
Raw appearance of the lesion (hot or cold spot) and visual grading according to Schifter et al. (16) are two separate methods of evaluation, the latter depending on the location of the lesion. A tumor with an intermediate FDG uptake, between those of WM and CTX [visual Grade III by Schifter et al. (76)] may be a hot spot in WM as well as a cold spot in the CTX or basal ganglia.
TABLE 3
PET Results with Fluorine-18-FDG
Grade/typeI (n = 1)II (n =23)Astrocytoma (n = 16)Oligoastrocytoma (n =Oligodendroglioma (nIII (n = 6)Astrocytoma (n = 3)Oligoastrocytoma (n =Oligodendroglioma (nIV (n = 15)5)= 2)1)= 2)T/CTX0.840.59 ± 0.250.54 ± 0.220.56 ± 0.221.01 ±0.190.71 ± 0.270.89 ± 0.150.840.39 ± 0.021.28 ±0.42T/CCR1.290.79 ± 0.420.76 ± 0.450.75 ± 0.361.1 3 ±0.450.85 ± 0.160.95 ±0.1 70.840.72 ± 0.021.90 ±0.98RatioT/MCU0.860.55 ± 0.220.51 ± 0.200.51 ± 0.150.98 ±0.110.77 ± 0.280.92 ± 0.141.000.43 ± 0.001.23 ±0.43T/WM1.541.1 5 ±0.461.11 ±0.501.09 ±0.341.58 ±0.091.57 ±0.661.76 ±0.662.230.96 ± 0.042.62 ±1.02T/W*C1.220.75 ± 0.310.70 ± 0.290.72 ± 0.211.28 ±0.061.03 ±0.341.21 ±0.271.260.66 ± 0.011.72 ±0.50CMRGI (mg/1 00g/min)3.51 ± 0.433.32 ± 0.982.91 ± 0.887.504.88 ±1.875.39 ± 0.827.293.1 6 ±1.036.10 ±1.77
Values are mean ±s.d.
Finally, five ratios were calculated for each tracer between the uptake of the tumor [region of interest (ROI) placed in the region of highest uptake)] and various normal brain tissue references:
1. T/CTX ratio, tumor-to-contralateral CTX in front of the tumor ratio;
2. T/CCR ratio, tumor-to-same contralateral corresponding re gion ratio;
3. T/MCU ratio, tumor-to-mean cortical uptake (seven ROls) ratio;
4. T/WM ratio, rumor-to-WM (two ROIs in the centrum semi ovale) ratio; and
5. T/W*C ratio, tumor-to-mean uptake of WM (centrum semi ovale) and temporal CTX ratio.
The ROI diameter was chosen depending on the size and aspect of the tumor on CT, MRI and PET images. When the rumor was
large and homogeneous, the ROI was two times the spatial
resolution of the tomograph. In small tumors or when only a thin rim of viable tissue surrounded a cystic or necrotic center, a smaller ROI was used to include, to the highest extent possible, only viable tumoral tissue.
Statistical analysis included multiple-group comparisons by analysis of variance, comparisons between histologie subgroups by Student's t-test, comparisons between FDG and MET ratios by linear regression, comparisons of the different ratios and of the two tracers by stepwise multigroup logistic discriminant analysis and survival analysis by Cox's model and the life-table method of Kaplan and Meier.
RESULTS
The results of FDG PET and MET PET examinations are presented in Tables 3 and 4, according to the histologie grades and types of the WHO classification. For some patients, T/CCR ratio (four tumors on the midline) or CMRGI was not available. Considering the peculiar metabolic behavior of the single case of JPA (Grade I), correlations described below, if not specified, are reported for Grades II, III and IV gliomas. In some statistical analyses, astrocytomas and oligoastrocytomas were grouped together.
Visual Analysis
Raw appearance of the lesion (hot or cold spot) and visual grading according to Schifter et al. (16) are combined in Table
5. In most low-grade tumors (Fig. 1), FDG PET showed a
hypometabolic focus (Table 5, —), and visual grade usually extended from 1 to 3. In most high-grade tumors (Fig. 2), FDG PET showed a hypermetabolic focus (Table 5, +), and visual
grade usually extended from 3 to 5. However, these usual
findings have to be tempered in some cases. Some low-grade gliomas exhibited a hot spot, especially JPAs (Grade I) and oligodendrogliomas. In Grade III tumors, oligodendrogliomas exhibited a cold spot and visual grades of 1 to 2. Finally, four glioblastomas were rated only visual Grade III because of large necrotic or cystic center surrounded by only a thin rim of tumoral viable tissue (partial volume effect), but all presented nevertheless as hot spots on the images. FDG visual grade was clearly correlated to WHO histologie grade (p < 0.001).
Concerning MET PET, all but two lesions were clearly
TABLE 4
PET Results with Carbon-11-MET
Grade/typeI (n = 1)II (n =19)Astrocytoma (n = 12)Oligoastrocytoma (n =Oligodendroglioma (nIII (n = 6)Astrocytoma (n = 3)ONgoastrocytoma (n =Oligodendroglioma (nIV (n = 15)5)= 2)1)= 2)T/CTX1.751.71 ± 0.601.47 ±0.301.81 ±0.722.88 ± 0.162.08 ± 0.711.56 ±0.163.342.22 ± 0.252.81 ±0.61T/CCR2.421.94 ±0.741.73 ±0.511.89 ±0.853.16 ± 0.062.05 ± 0.771.48 ±0.303.342.27 ± 0.193.09 ±0.59RatioT/MCU1.781.64 ±0.621.39 ±0.291.73 ±0.682.91 ± 0.341.98 ±0.621.54 ±0.283.062.12 ± 0.062.79 ±0.71T/WM3.282.58 ± 0.942.26 ± 0.472.61 ±1.054.43 ± 0.872.85 ± 0.892.28 ± 0.014.582.85 ±0.114.37 ±1.41T/WC2.542.09 ± 0.791.78 ±0.342.18 ± 0.853.71 ± 0.742.40 ± 0.731.87 ±0.303.652.58 ± 0.093.51 ±1.00
TABLE 5
Results of Visual Analysis for FDG PET According to WHO Histologie Grading
(WHO)1 2345 II Astrocytoma Oligoastrocytoma Oligodendroglioma III Astrocytoma Oligoastrocytoma Oligodendroglioma IV + O+ +
depicted as hot spots on the images, allowing a more precise delineation of the tumor than with FDG, especially in low-grade gliomas. All patients except four of them were rated Grade V, indicating that this visual grading method was useless for MET PET (not correlated to the histologie grade).
Multiple-Group Comparisons
Taking all the WHO grades together and considering either all types of gliomas, only astrocytomas or astrocytomas and oligoastrocytomas, analysis of variance showed significant differences for all the variables (p < 0.001 for FDG and MET) except visual analysis of MET. Results were slightly less significant with the Mayo-Sainte Anne classification (p < 0.01 for FDG; p < 0.05 for MET except visual analysis).
FIGURE 1. Grade II astrocytoma. MPI (T1-weighted image after gadolinium injection) showing hypointense lesion with a small region of contrast en hancement. PET showing increased uptake of MET and decreased uptake of FDG in the tumor.
FIGURE 2. Glioblastoma (Grade IV). MRI (T1-weighted image after gadolin ium injection) showing necrotic lesion with heterogeneous contrast enhance ment. PET showing high uptake of both MET and FDG in the tumor.
Comparisons between Groups A, OA and O within either
Grade II or Grade III gliomas snowed significant differences for FDG (p < 0.05) and MET (p < 0.01), except for visual analysis of MET.
Comparisons Between Histologie Subgroups
FDG PET showed significant differences between Grades II and III gliomas (p < 0.05 for T/MCU and T/W*C) and more significant differences between Grades III and IV gliomas (p < 0.001 for T/CTX, p < 0.01 for T/W*C and p < 0.05 for the other ratios; p was not significant for CMRG1). Differences were highly significant between Grades II and IV gliomas (p < 0.001 for all the variables, including CMRG1).
When only astrocytomas or astrocytomas and oligoastrocy tomas were considered, differences were significant between Grades II and III (p < 0.001) and between Grades II and IV gliomas (p < 0.001 ) but not between Grades III and IV gliomas because of the large s.d. for glioblastomas.
MET PET results were the same considering either all
gliomas, only astrocytomas or astrocytomas and oligoastrocy tomas. There was no difference between Grades II and III, but there were highly significant differences between Grades II and IV (p < 0.001 for all ratios) and between Grades III and IV gliomas (p < 0.001 to p < 0.05, depending on the ratios).
Oligodendrogliomas paradoxically exhibited a higher uptake of FDG and MET in Grade II than they did in Grade III gliomas. The Grade IJPA had a behavior closer to that of the Grade III astrocytomas than to that of the Grade II tumors, with a high uptake of FDG as well as of MET.
According to the Mayo-Sainte Anne classification, consid ering either all types of gliomas, only astrocytomas or astrocy
tomas and oligoastrocytomas, FDG PET showed significant
differences between Grades I and III (p < 0.02) and between
Grades II and IV gliomas (p < 0.001), whereas MET PET
showed only a statistically significant difference between Grades II and IV gliomas (p < 0.001).
For all the variables, there was no significant difference
between astrocytomas and oligoastrocytomas within each
grade, although oligoastrocytomas exhibited a slightly higher uptake of MET than did astrocytomas.
Grade II (WHO) oligodendrogliomas exhibited a higher
metabolism than did Grade II astrocytomas, considering either FDG (p < 0.02) or MET (p < 0.001). In Grade III tumors, uptake of FDG was lower in Grade III oligodendrogliomas than it was in Grade III astrocytomas (p < 0.02), but uptake of MET remained higher in Grade III oligodendrogliomas than they did in Grade III astrocytomas (p < 0.05), although it was lower than that in Grade II oligodendrogliomas.
The same calculations, after exclusion of cases without pathologic verification, brought the same statistical significance and will not be detailed here.
TABLE 6
Correlation Between FDG and MET (n = 32), Linear Regression Analysis
Ratio
T/MCUT/W*CT/WMT/CTXT/CCR0.77540.75670.70790.68250.5693<0.001<0.001<0.001<0.001<0.01
Correlation Between FDG and MET Ratios
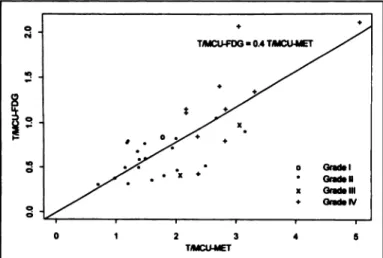
Considering patients submitted to PET examination with both tracers (n = 32), linear regression analysis was applied to the corresponding ratios (Table 6). The best correlation was ob served with T/MCU ratio (r = 0.78, p < 0.001) (Fig. 3), from which the following equation could be derived:
T/MCUFDG = 0.4 •T/MCUMET.
The ranges of the T/MCU ratio were 0.30-2.12 for FDG PET
and 0.70-5.05 for MET PET.
Discriminant Power of the Ratios
Stepwise multigroup logistic discriminant analysis was used to select, for each tracer, the best ratio(s) for clinical purpose, based on their discriminant power (capacity to reclassify pa tients in the correct histologie grade from the PET results).
When all WHO Grades II, III and IV gliomas were consid ered, the most discriminant ratios for FDG were the T/W*C, T/CTX and T/MCU ratios alone [82% correct classification], and the most discriminant ratio for MET was the T/MCU ratio (69%). When astrocytomas and oligoastrocytomas were consid ered, the most discriminant ratios were the T/W*C and T/MCU ratios (86% correct classification) and the T/MCU ratio (81% correct classification), for FDG and MET, respectively.
When only the Grades II and IV astrocytomas were consid ered (the number of Grade III astrocytomas was too small to be considered), the most discriminant ratios were the T/WM,
T/W*C and T/MCU ratios (96% correct classification) for
FDG, whereas for MET, all ratios except the T/correct classi-ficationR ratio gave 100% correct classification due to total separation of the two groups.
Considering the Grades II, III and IV of the Mayo-Sainte Anne classification, the most discriminant variables were the T/WM ratio (80% correct classification) and the T/MCU ratio (74% correct classification) for FDG and MET, respectively.
T/MCU-FDG - 04 T/MCU-MET Gradel Graden Grade III Grada IV 2 3 T/MCU-MET 0_ O™ »0 •N0P _O'fi iLp ~'.1 'H"!^ L !L_: S H-1I'0 20 4060Time (months)KFOG-AV1F DG -AV 2FDG-AV3FDG-AV4FDG-AV580 KIO
FIGURE 3. Linear regressionof the T/MCUFDG ratio over the T/MCUMEr ratio, correlated with histologie grade of WHO classification (r = 0.78, p < 0.001).
FIGURE 4. Survival curves (Kaplan-Meier analysis) according to FDG visual grade (FDG-AV) (p < 0.001).
Discriminant Power of MET Compared with FDG
The same stepwise analysis was applied to the T/MCUFDG and T/MCUMET ratios together to select which of the tracers was the most discriminant, considering the prediction of the histologie grade. The choice of the T/MCU ratio was derived from the results described above.
When considering all Grades II, III and IV gliomas (WHO), the most discriminant was the T/MCUMET ratio (71% correct classification, p < 0.001 ). Addition of the T/MCUFDG ratio was at the limit of statistical significance (p = 0.08) and improved the results to 81% correct classification.
When astrocytomas and oligoastrocytomas were considered, results were similar: MET was the most discriminant tracer (86% correct classification, p < 0.001), and addition of FDG improved the results to 89% correct classification (p = 0.06).
When only Grades II and IV astrocytomas were considered,
MET remained the most discriminant because of complete
separation between the two groups (100% correct classifica tion). FDG did not improve the results.
When only Grades II, III and IV (Mayo-Sainte Anne) were considered, MET was also the most discriminant (80% correct classification, p < 0.001), and addition of FDG improved the results to 88% correct classification (p = 0.14).
Survival Analysis
Cox's model was used to analyze the correlation between the different parameters (tumor-to-normal brain ratios and CMRG1) and survival. For FDG the most significant prognostic factor was the T/CTX ratio (p < 0.001). The stepwise procedure gave no further significant variable. For MET the most significant variable was the T/MCU ratio (p < 0.001). The stepwise procedure did not give any further significant variables.
Prognostic significance of MET compared to FDG was
assessed by using a Cox's model with the T/MCUFDCi and
T/MCUMET ratios. The T/MCUMET ratio proved the most
significant (p < 0.001), and the stepwise procedure gave no further value, indicating that addition of FDG did not bring more prognostic power over MET alone.
The life-table method of Kaplan and Meier was then used to assess the prognostic role of visual analysis (for FDG) and of the T/MCU ratio (for both tracers) (this ratio was selected considering all the results described above).
There was a significant correlation (p < 0.001) between visual analysis of FDG PET and survival (Fig. 4): prognosis was very good for visual Grades I and II (median survival > 5
T/MCU-FDG«0.8 0.8<T/MCU-FOG<1.1 T/MCU-FDG »1.1 40 60 Time (month») 100
FIGURE 5. Survival curves (Kaplan-Meier analysis)according to T/MCUFDG ratio (p < 0.001).
yr), fair for visual Grade III (median survival = 31 mo) and bad for visual Grades IV and V (median survival = 10 mo).
Patients were divided into three groups according to the T/MCU ratio for FDG: highly significant differences (p <
0.001) were observed between the 23 patients with a
T/MCUFDG ratio of <0.8 (median survival > 5 yr), the 12 patients with T/MCUFDG ratios between 0.8 and 1.1 (median survival = 20 mo) and the 10 patients with T/MCUFDG ratios of >1.1 (median survival = 10 mo) (Fig. 5).
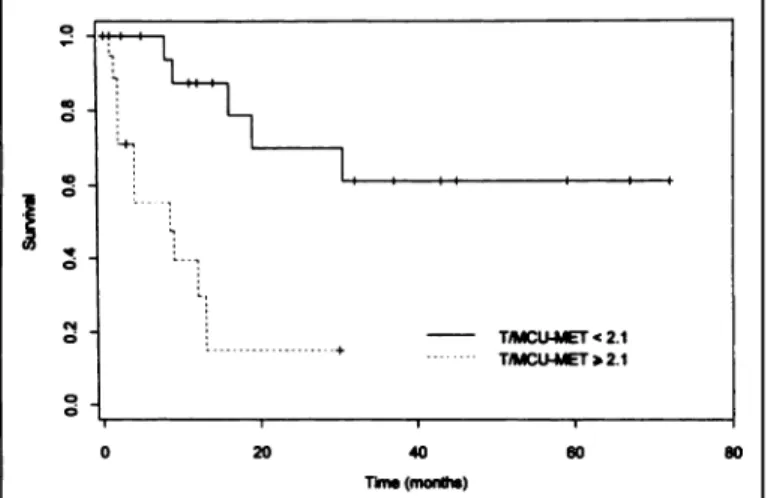
Considering the previous results for MET PET and the
absence of differentiation between Grades II and III gliomas, patients were divided into only two groups: prognosis of the 21 patients with T/MCUMET ratios of <2.1 (median survival > 5 yr) was significantly better than prognosis of the 20 patients with T/MCUMFT ratios of >2.1 (median survival = 8 mo) (Fig. 6) (p < 0.001);
Figure 7 shows the survival curves when FDG and MET are considered together: prognosis was good when the uptake was low for both tracers, fair when there was a high uptake of one of the tracers and bad when there was a high uptake of both tracers (p < 0.001).
DISCUSSION
Methods of Interpretation of PET Results
The simple visual analysis of FDG PET offers a reliable estimation of tumor grading and prognosis. Gliomas with FDG uptake lower than or equal to that of the WM have a good
T/MCU-MET < 2.1 T/MCU-MET>2.1
40
Time (month»
T/MCU-FDG < 08 and T/MCU-MET < 21 T/MCU-FDG «0.8 and T/MCU-MET »21 0.8 < T/MCU-FDG < 1.1 and T/MCU-MET < 2.1 0.8 < T/MCU-FDG < 1 1 and T/MCU-MET > 2 1 T/MCU-FDG > 1 1 and T/MCU-MET > 2 1
40
Time (month»)
FIGURE 6. Survival curves (Kaplan-Meier analysis) according to T/MCUMET ratio (p < 0.001).
FIGURE 7. Survival curves (Kaplan-Meier analysis) according to both T/MCUFDG and T/MCUMET ratios (p < 0.001).
prognosis; those with FDG uptake between those of WM and CTX have an intermediate prognosis; whereas prognosis is poor when FDG uptake is equal to or greater than that of CTX.
Nearly all our patients exhibit a MET uptake higher than that of CTX, which does not allow histologie grading based only on visual analysis, but have the advantage of precisely delineating the tumors, especially low-grade gliomas in which FDG usually cannot differentiate between tumor and surrounding edema. Image registration (fusion of MRI and PET images) is now available and greatly increases the accuracy of interpretation of PET data, especially for FDG PET.
Calculation of tumor-to-normal brain tissue ratios is a very simple semiquantitative method allowing comparisons between groups of individuals or between repeated PET examinations of the same patient. Trying to solve the problem of standardization of the results, we showed that the less useful ratio was obviously the T/CCR ratio: it cannot be applied to tumors of the midline and has the largest variability due to the contralateral
reference (sometimes CTX, sometimes WM and often a com
bination of both). Considering all the statistical results de scribed above, the T/MCU, T/CTX and T/W*C ratios are all satisfactory ratios for evaluating FDG PET, but the T/MCU ratio seems to have important advantages for MET interpreta tion, as demonstrated in the stepwise multigroup logistic dis criminant analysis. Moreover, the T/MCU ratio is the more reproducible between PET centers and is only subject to a low error margin because it is calculated as a mean of seven cortical regions (medial and lateral frontal, medial and lateral temporal, parietal, medial and lateral occipital CTX). We suggest that the T/MCU ratio should be used as a standardized reference for evaluation of PET results with both FDG and MET.
Absolute quantification of glucose consumption (CMRG1) is interesting for research purposes but less useful in clinical practice because of large variations in tumoral CMRG1 as well as in normal brain tissue. Statistical results were less significant with this parameter than with tumor-to-normal brain ratios. It remains interesting for comparisons of iterative PET examina tions in the same patient, for instance, in the evaluation of response to radiation therapy and/or chemotherapy. However, as already stated by Di Ghiro and Brooks (28), considering its heaviness, it cannot be recommended as a routine procedure. Correlation Between PET Results and Histology
Although not always statistically significant because of the low number of patients in some groups, FDG uptake increases
gliomas, especially in pure astrocytomas. Oligoastrocytomas have the same FDG PET pattern as do astrocytomas, regardless of whether Grade II or Grade III tumors are considered.
MET PET did not allow differentiation between Grade II and Grade III gliomas, especially in astrocytomas; MET uptake was significantly higher in glioblastomas. Despite the low number of cases, the higher MET uptake in our oligoastrocytomas
compared with pure astrocytomas confirms the results of
Ericson et al. (12) (three oligoastrocytomas with marked accu mulation of MET).
Pure oligodendrogliomas seem to exhibit different behavior. Derlon et al. (14), in low-grade gliomas, showed a significantly higher uptake of MET in oligodendrogliomas than in astrocy tomas, whereas both histologie types exhibited FDG hypome-tabolism, which was slightly more pronounced in astrocytomas. We confirm that Grade II oligodendrogliomas have a higher
uptake of MET and FDG than do Grade II astrocytomas or
oligoastrocytomas, probably reflecting some specific metabolic properties of oligodendroglial cells (such as myelin synthesis) rather than proliferative tumoral metabolic activity; this could explain the discrepancy between high metabolic activity and good prognosis. This difference could also be explained by different cellular densities or rates of cell turnover (14). Moreover, the decreased metabolism in Grade III compared to Grade II oligodendrogliomas could reflect the cellular dediffer-cntiation accompanying anaplasia, decreasing specific "oligo dendroglial" metabolism, whereas proliferative tumoral metab olism is not really increased. The low FDG uptake, lower than in Grade III astrocytoma, corresponds to the good prognosis of Grade III oligodendrogliomas (100% alive in our series) com pared with Grade III astrocytoma (100% dead in our series). However, although decreased compared to Grade II
oligoden-droglioma, MET uptake in Grade HI oligodendroglioma re
mains higher than in Grade III astrocytoma.
Our JPA patient also presents a discrepancy between a quite
high metabolism (FDG and MET) and a good prognosis.
Fulham et al. (29) reported similar observations in a series of five JPAs studied with FDG. Patients with JPA also can exhibit pseudomalignant radiologie features, such as contrast enhance ment on CT and MRI. These findings might reflect the unusual vascularity of JPA, and the increased FDG uptake might be related to marked expression of the glucose transporter (29). However, the increased MET uptake demonstrated in our case could indicate a really peculiar metabolic property rather than just a difference in vascularity.
Correlation of our PET results with pathologic grading according to Mayo-Sainte Anne classification did not give additional information. From our point of view, it is less useful than the WHO classification.
Correlation Between FDG and MET Uptakes
Ogawa et al. (13) first demonstrated a correlation between
CMRG1 and MET uptake. In our series, linear regression
showed significant correlation between FDG and MET for all the ratios used, especially for the T/MCU ratio.
When the T/MCUFDG ratio is divided by the T/MCUMET ratio, the values obtained fluctuate greatly between 0.19 and 0.68 (mean = 0.4, as described above); no significant difference could be observed in this correlation either between histologie grades or between histologie subgroups.
Correlation Between PET Results and Survival
The prognostic significance of FDG PET has been recog
nized since the works of Di Ghiro and his group and has been confirmed by other groups (3,5,7,16,17). To our knowledge, no
correlation has ever been demonstrated between MET PET and survival or between a combination of both tracers and survival.
Our results suggest that both tracers bring valuable informa tion for prognosis. FDG visual analysis alone already can predict quite accurately the survival prognosis.
Cutoff values for tumor-to-normal brain ratios have been proposed by different authors, but the methodology and refer ences must be analyzed carefully. For prediction of prognosis inside high-grade gliomas, Patronas et al. (5) used a cutoff value of 1.4 for FDG tumor to contralateral region ratio (correspond ing to our T/CCR ratio), but their results are not transposable because most of their 45 cases were recurrences. Delbeke et al.
(9), on 58 untreated gliomas studied with FDG, found that
optimal cutoff value for differentiation between low- and high-grade gliomas was 0.6 for tumor-to-fronto-parietal CTX ratio and 1.5 for the T/WM ratio. No cutoff level was proposed between Grades III and IV gliomas (9).
Our FDG cutoff levels grossly correspond to differentiation between Grades II and III gliomas (T/MCUFDG ratio = 0.8) and between Grades III and IV gliomas (T/MCUFDG ratio = 1.1). However, some low-grade gliomas exhibited a T/MCUFDG ratio higher than 0.8: the two Grade II oligodendroglioma patients, the JPA patient and another patient with a Grade II astrocytoma who died 16 mo later (clinical evolution corresponding more to
a Grade III astrocytoma). Among low-grade gliomas with a
T/MCUFDG ratio between 0.6 and 0.8, there were three cases with a small tumor within the CTX (T/MCU overestimated by partial volume effect) and another Grade II astrocytoma patient, who died 30 mo later. So, after exclusion of partial volume effect and special histologie subgroups (especially JPA and
oligodendrogliomas), a T/MCUFDG ratio of >0.6 and, of
course, >0.8 is an indicator of malignant potential and bad prognosis.
To our knowledge, no cutoff level has been proposed
between Grades III and IV gliomas. Our value of 1.1 was
chosen so that all tumors above this value were Grade IV gliomas, which is meaningful in clinical practice.
Within Grade III gliomas, all astrocytomas and oligoastrocy tomas had a T/MCUFDG ratio between 0.8 and 1.1 (75% died), whereas the Grade III oligodendrogliomas had a ratio of <0.8 (both patients are alive).
One glioblastoma exhibited a T/MCUFDG ratio of <0.8 due to important partial volume effect, and four cases had a ratio between 0.8 and 1.1, but no difference in prognosis could be demonstrated.
Only one MET cutoff level was defined by the limit between Grade II/III and Grade IV gliomas (T/MCUMFT ratio = 2.1). No
discrimination could be made between Grades II and III
gliomas. The most difficult problem is the high MET uptake of oligoastrocytomas and oligodendrogliomas, despite a good prognosis.
Discriminant and Prognostic Power of MET Compared with FDG
The discriminant power (ability, from the PET results, to reclassify the tumors in the correct histologie grade) of MET proved in all of the trials slightly better than that of FDG. The addition of FDG was usually at the limit of statistical signifi cance (p = 0.06-0.14) but improved the percentages of correct classification.
These results could seem astonishing, considering the ineffi ciency of MET to separate Grade III from Grade II gliomas, which was easier with FDG. In fact, none of the Grade III astrocytomas had PET examination with both tracers, and only one Grade III oligodendroglioma and the case of Grade III
oligoastrocytoma were included in this analysis. Differences between Grade II and Grade IV gliomas were more important with MET than with FDG. If more Grade III gliomas could have been included, the discriminant power of FDG could have been equivalent or superior to that of MET.
Furthermore, the choice of the T/MCU ratio could be
criticized because this ratio proved to be the best for MET but not always for FDG. However, differences between the ratios for FDG were small and probably did not greatly influence the results expressed above.
Concerning the survival prognosis, the same comment can be done concerning the small number of Grade III gliomas. This is consistent with the results of univariate analysis, where FDG and MET were quite equivalent (p < 0.001 for both tracers).
Actually, FDG is certainly more widely available and more often used than MET. However, because radiosynthesis of MET has been fully automated in our center (30), MET is used routinely in combination with FDG in brain tumors. The most limiting factor in clinical practice is still the short half-life of "C (20 min). CONCLUSION
This work presents a large series of combined FDG PET and
MET PET examinations, with analysis of discriminant and
prognostic power of both tracers, analyzed individually or together. Although both tracer uptakes are correlated clearly and that of MET seems slightly better than that of FDG, the combination of FDG and MET predicts the histologie grade and the survival prognosis of gliomas better than does either alone. Visual analysis for FDG PET and T/MCU ratios for both tracers seem to be the best means for the evaluation of PET results. Calculation of CMRG1 is not useful in routine clinical PET.
Besides partial volume effects (overestimation of small low-grade cortical lesions and underestimation of necrotic or cystic high-grade tumors), one of the most important remaining problems is the particular metabolic behavior of specific histo logie subgroups (i.e., JPAs and oligodendrogliomas), with a
discrepancy between a high FDG and MET uptake and a low
proliferative potential and good prognosis. These exceptions emphasize the need to integrate PET results with all the other clinical, radiologie and histologie information available to select the best therapeutic procedures.
ACKNOWLEDGMENTS
We thank Prof. A. Albert and W. Dewéfor statistical assistance, C. Ernotte for photographs and J. Hodiaumont for technical assistance during PET examinations. This work was supported by Fonds National de la Recherche Scientifique (Brussels, Belgium) Contracts 3.4546.93F and 9.4555.92F and by the Centre Anti-Cancéreuxprèsl'Universitéde Liège(Liège,Belgium).
REFERENCES
1. Di Chiro G, DeLaPaz RL, Brooks RA, et al. Glucose utilization of cerebral gliomas
measured by [lsF]fluorodeoxyglucose and positron emission tomography. Neurology
1982;32:1323-1329.
2. Di Ghiro G. Positron emission tomography using [18F]fluorodeoxyglucose in brain
tumors. A powerful diagnostic and prognostic tool. Invest Radial 1986;22:360-371.
3. Di Chiro G, Oldfield E. Wright DC, et al. Cerebral necrosis after radiotherapy and/or
intraarterial chemotherapy for brain tumors: PET and neuropathologic studies. Am J
Neuroradiology 1987:8:1083-1091.
4. PatrañasNJ, Di Chiro G. Brooks RA, et al. Work in progress: ['"FJfluorodeoxyglucose and positron emission tomography in the evaluation of radiation necrosis of the brain.
Radiólo®'1982:144:885-889.
5. PatrañasNJ, Di Chiro G, Kufta C, et al. Prediction of survival in glioma patients by
means of positron emission tomography. J Neurosurg 1985:62:816-822.
6. Lilja A, Bergström K. Hartvig P. et al. Dynamic study of supratentorial gliomas with
L-methyl-"C-methionine and positron emission tomography. Am J Neuroradiology
1985:6:505-514.
7. Alavi JB, Alavi A, Chawluk J, et al. Positron emission tomography in patients with
glioma. A predictor of prognosis. Cancer 1988:62:1074-1078.
8. Chatel M. Bustany P. Derlon JM. Métabolismedes tumeurs cérébralesin vivo: apports de la tomographie par émissionde positons. In: Laffont A. Durlex F. eds. Encyclopédie
médico-chirurgicale; neurologie, vol. 5. Paris: Editions Techniques; 1990:17210.
9. Delbeke D, Meyerowitz C, Lapidus RL, et al. Optimal cutoff levels of F-18
fluorodeoxyglucose uptake in the differentiation of low-grade from high-grade brain
tumors with PET. Radiology 1995:195:47-52.
10. Kaschten B. Sadzot B, Stevenaert A. Positron emission tomography. In: Palmer JD. ed.
Neurosurgery 96: manual of neurosurgery. Edinburgh: Churchill Livingstone; 1996:
85-90.
11. Rigo P, Paulus P, Kaschten B, et al. Oncological applications of positron emission
tomography with fluorine-18 fluorodeoxyglucose. Eur J NucÃ-Med
1996:23:1641-1674.
12. Ericson K, Lilja A, Bergström M, et al. Positron emission tomography with
(["C]methyl)-L-methionine, ["C]D-glucose, and [MGa]EDTA in supratentorial tu mors. J Comput Assist Tomogr 1985:9:683-689.
13. Ogawa T, Inugami A, Hatazawa J, et al. Clinical positron emission tomography for
brain tumors: comparison of fluorodeoxyglucose F-18 and L-methyl-"C-methionine.
Am J Neuroradiology 1996; 17:345-353.
14. Derlon JM, Petit-Taboue M-C, Chapon F, et al. The in vivo metabolic pattern of
low-grade brain gliomas: a positron emission tomographie study using li!F-fluorode-oxyglucose and "C-L-methionine. Neurosurgery 1997:40:276-288.
15. Herholtz K, Pietrzyk U. Voges J. et al. Correlation of glucose consumption and tumor cell density in astrocytomas. A stereotactic PET study. J Neurosurg 1993:79:853-858. 16. Schifter T. Hoffman JM. Hanson MW. et al. Serial FDG-PET studies in the prediction
of survival in patients with primary brain tumors. J Comput Assist Tomogr 1993:17: 509-516.
17. De Witte O, Levivier M, Violon P, et al. Prognostic value of positron emission
tomography with [ l8F]fluoro-2-deoxy-D-glucose in the low-grade glioma. Neurosur
gery 1996:39:470-477.
18. Derlon JM, Bourdet C, Bustany P, et al. ["C]L-methionine uptake in gliomas.
Neurosurgery 1989:25:720-728.
19. Ogawa T, Shishido F, Kanno I, et al. Cerebral glioma: evaluation with methionine PET. Radiology 1993:186:45-53.
20. Fulham MJ, Brunetti A, Aloj L, Raman R, Dwyer AJ, Di Chiro G. Decreased cerebral
glucose metabolism in patients with brain tumors: an effect of corticosteroids.
J Neurosurg 1995:83:657-664.
21. Theodore WH, Di Chiro G, Margolin R, Fishbein D, Porter RJ, Brooks RA.
Barbiturates reduce human cerebral glucose metabolism. Neurology 1986:36:60-64.
22. Theodore WH, Bairaman D, Newmark ME, et al. Effect of phenytoin on human
cerebral glucose metabolism. J Cereb Blood Flow Melab 1986:6:315-320.
23. Theodore WH, Bromfield E, Onorati L. The effect of carbamazepine on cerebral
glucose metabolism. Ann Neural 1989:25:516-520.
24. Kleihues P, Burger PC, Scheithauer BW. Histológica! typing of tumors of the central
nervous system. World Health Organisation international classification of tumors.
Berlin: Springer Verlag; 1993.
25. Daumas-Duport C, Scheithauer B, O'Fallon J, Kelly P. Grading of astrocytomas. A
simple and reproductive method. Cancer I988;62:2152-2165.
26. Sokoloff L. Reivich M, Kennedy C, et al. The [C-l4]deoxyglucose method for the
measurement of local cerebral glucose utilization: theory, procedure, and normal
values in the conscious and anesthetized albino rat. J Neurochem 1977:28:897-916. 27. Phelps ME, Huang SC, Hoffman EJ, Selin C, Sokoloff L, KühlDE. Tomographie
measurements of local cerebral glucose metabolic rate in humans with
[F-18]-2-fluoro-2-deoxy-D-glucose: validation of the method. Ann Neural 1979:6:371-388.
28. Di Chiro G, Brooks RA. PET quantitation: blessing and curse. J NucÃ- Med
1988:29:1603-1604.
29. Fulham MJ, Melisi JW, Nishimiya J, Dwyer AJ, Di Chiro G. Neuroimaging of juvenile
pilocytic astrocytomas: an enigma. Radiology 1993:189:221-225.
30. Del Fiore G. Peelers JM, Quaglia L, et al. Automated preparation of carbon-11 ethanol
and carbon-11 butanol for human studies using positron emission tomography. J