POINT CLOUD CLASSIFICATION OF TESSERAE FROM TERRESTRIAL LASER
DATA COMBINED WITH DENSE IMAGE MATCHING FOR ARCHAEOLOGICAL
INFORMATION EXTRACTION
F. Poux a, *, R. Neuville a, R. Billen a
a Ulg, Geomatics Unit, University of Liège, 4000 Liège, Belgium- (fpoux, romain.neuville, rbillen)@ulg.ac.be
Commission II
KEY WORDS: point cloud, data fusion, feature extraction, segmentation, classification, cultural heritage, laser scanning
ABSTRACT:
Reasoning from information extraction given by point cloud data mining allows contextual adaptation and fast decision making. However, to achieve this perceptive level, a point cloud must be semantically rich, retaining relevant information for the end user. This paper presents an automatic knowledge-based method for pre-processing multi-sensory data and classifying a hybrid point cloud from both terrestrial laser scanning and dense image matching. Using 18 features including sensor’s biased data, each tessera in the high-density point cloud from the 3D captured complex mosaics of Germigny-des-prés (France) is segmented via a colour multi-scale abstraction-based featuring extracting connectivity. A 2D surface and outline polygon of each tessera is generated by a RANSAC plane extraction and convex hull fitting. Knowledge is then used to classify every tesserae based on their size, surface, shape, material properties and their neighbour’s class. The detection and semantic enrichment method shows promising results of 94% correct semantization, a first step toward the creation of an archaeological smart point cloud.
1. INTRODUCTION
Point clouds constitute exhaustive datasets on which efficient data mining techniques can build themselves to extract essential information for cultural heritage applications. Generated using an ever increasing variety of remote sensing platforms and sensors (Toth and Jóźków, 2015), their heterogeneity, complexity and massiveness rises. This creates a need to move toward hybrid automatic processing and direct information extraction to avoid data saturation (Guest, 2006) and unlock efficient decision making processes close to real-time.
This democratisation benefits multisensory systems. While used since decades (Llinas and Hall, 1998), new advancements, methodologies and cost-effective solutions has stirred many industry gravitating around spatial data to develop new effective systems (Labayrade et al., 2005). These leverage the complementarity of signals and features by merging important contextual information sources following data fusion principles. In a cultural heritage context, combining terrestrial laser scanning (TLS) and techniques such as dense image matching (Remondino et al., 2014) provides increase flexibility, performance and facilitate archaeological awareness which enhances our ability to understand and interpret a specific environment. However, point cloud data fusion processes to merge, prioritize (Poux et al., 2016b) and address semantic information needs to be context-coherent, thus the importance of pertinent knowledge integration.
Organizing, segmenting, classifying and handling billions of observations including outliers are no trivial task. Indeed, we need to retain only relevant observations and bring intelligence to raw data based on available information and analytical routines. Building on the concept of Smart Point Cloud (Poux et al., 2016a), we specifically look at device, analytical and domain knowledge as information sources for point cloud data processing before its integration in a semantically rich and query efficient structure.
* Main and corresponding author.
In this paper, we propose a knowledge-based approach to automatically pre-process, segment, classify and attach semantics onto a complex point cloud of a mosaic to enable archaeological information extraction (tesserae-wise).
The underlying dataset constitute a very challenging sample as accessibility, temporal variation and the different materials nature introduce noise and biased signal in dense image matching reconstruction as well as in the laser scan point cloud and total station data. In a first part, we describe the context and the operational 3D capture that was carried on to obtain a very high density point cloud. We will go through the specificity of the site along with the different devices used. In a second part, we present our knowledge-based processing methodology. We will describe registration techniques, pixel and attribute fusion approaches to coherently merge different sensor’s signals. Then we discuss extracted features and their role within a new knowledge-based segmentation and classification methodology enabling tesserae detection and semantization. Finally, we present the results and discuss our future work in the area.
2. DATA ACQUISITION & CONTEXT
2.1 Study site
The Carolingian oratory situated in Germigny-des-prés (Loiret, France) hosts ancient mosaics dated from the 9th century, composed of approximatively one hundred thousand tesserae. The preserved artworks are a unique opportunity for the study of mosaics but also for that of glass. Indeed, the tesserae which compose it are mainly made in this material rather rare in archaeological context and whose provenance in the early Middle Age is still a mystery (Van Wersch et al., in press). Its study could reveal important predicates, by considering each tessera independently taken or as a whole and analysing different properties, repartitions or advanced extracted information.
Composed of tesserae from different materials, sizes and periods, it is a well preserved and restored mosaic that culminates at 5.402m above the ground, presenting many challenges for 3D capture from both active and passive sensors. The dome is protected and the limited accessibility tolerates only a light scaffolding, too narrow and unstable for tribrach positioning.
Figure 1 The mosaic of Germigny-des-prés © Line Van Wersch
2.2 Operational 3D capture
2.2.1 Sensor’s properties
Independently from remote sensing platforms, a sensor will measure a property in the scene, and to be highly representative, must be sensitive to only the property measured, without influencing the return signal. However, systematic errors (zero input, sensitivity error, and environmental error) that can be calibrated and random errors (noise, aliasing error …) deteriorate the final measurements. This is mainly due to absorption, i.e. operation frequency, scattering (considering the properties of the observed object) and the wavelength of the incident energy. As passive sensors rely solely on the light emittance of the measured object, they are more influenced by atmospheric conditions and errors. Typically, passive systems used in remote sensing applications operate in the visible, infrared, thermal infrared, and microwave portions of the electromagnetic spectrum. Active sensors, due to their narrow measurement spectrum are considered hyperspectral, but some applications including (Wei et al., 2012) applied multi-wavelength LiDAR acquisition to benefit of multispectral data. Whereas low energy LiDAR sensors exists (Flash LiDAR, Geiger Mode and Photon counting PMT), pulse high energy systems such as phase-based TLS are the most used in cultural heritage digitization. These predicates influence the sensor’s choice considering the application, playing in favour of multisensory systems (Petrie, 2009). Indeed, data fusion “combines data from multiple sources to improve the potential values and interpretation performances of the source data, and to produce a high-quality visible representation of the data” (Zhang, 2010). The sensor’s choice mainly depends on the context, the precision and the resolution that the specific application domain demands.
To describe accurately a scene composed of scattered observations, extracting high fidelity descriptors from sensors becomes essential. This process implicitly requires a device knowledge including contextual adaptation, data acquisition methodology and sensor’s expertise. Indeed, minimizing errors including noise, outliers and misalignment (Weinmann, 2016) will not correct acquisition methodology flaws.
Our first challenge concerns the optimal acquisition geometry. Improper set-ups lead to missing/erroneous data, misadjusted density, clutter and occlusion as referred in (Dimitrov and Golparvar-Fard, 2015) which delineates the importance in aware and contextual 3D capture leveraging device knowledge to narrow further problematics. Therefore, combining different sensors to create a multisensory systems allows to develop new methodologies for 3D capture, giving more flexibility and thus more representative point cloud datasets. But combining data regarding fusion principles at the pixel & feature level means first overlaying different data from multiple sources in one coherent system. There are discussions about which registration method to use for multi-source point clouds as varying spatial and temporal resolutions present many challenges, with some preliminary results in (Poux et al., 2016b). Establishing a priority list among attributes is a first step for automated pixel fusion to be more informative and synthetic than either of the input data, or reveal the changes between data sets acquired at different times. Overlaying passive sensor’s colour data over TLS point clouds is a representative example of such a practice which allows to correlate a spatial position of an element where the colour plays an important role, especially in cultural heritage documentation (Guarnieri et al., 2006; Ortiz et al., 2006).
2.2.2 Terrestrial laser data
Each TLS emits on a narrow band mostly in between 600 nm and 1600 nm and gather a received signal intensity from each measurement, frequency-related (this allows a better context adaptation to environment constraints). However spherical loss, topographic and atmospheric effects decrease the fidelity, thus the representativity of the backscattered signal intensity. The work of (Höfle and Pfeifer, 2007) focusing on aerial laser scanning correction gives a method to efficiently correct most of the influential effects in order to obtain a more homogeneous backscattered signal. This can be extended to TLS to obtain an efficient classifier. Both time of flight and pulse based technology for TLS are largely reviewed in (Reshetyuk, 2009), stating that raw observations include systematic and random errors affecting the fidelity of point cloud.
Registration of different set-ups together addresses georeferencing. (Landes et al., 2011; Landes and Grussenmeyer, 2011) compare direct and indirect georeferencing to establish that indirect georeferencing is more precise and coherent than direct georeferencing, although the latest is quicker for outdoor surveys. However, to reduce georeferencing errors as defined in (Reshetyuk, 2009), it is more coherent to work analogically to topographic surveys, creating a local registration later georeferenced using least squares for internal cohesion and minimum deviation. However other errors associated with TLS technology – instrumental, object related, environmental – needs to be taken into account for efficient normalization. To obtain a representative intensity value, the echo must be calibrated or linearly scaled (Höfle and Pfeifer, 2007), and the properties of surfaces must be classified in order to correct specular reflection (smooth surface involving darker value, typically -20 dB), diffuse scattering (rough surface involving darker values, typically -20dB) and double bounce backscattering (involving lighter values, typically -10 dB).
The dome, object of interest, culminates between 115.276 m and 116.360 m for the highest tessera (altitude NGF). We acquired the data using a phase-based calibrated terrestrial laser scanner: the Leica P30. The different scans were registered using 1338 reflective targets from which 127 were shot by a total station
(Leica TCRP1205, precision of 3mm+2ppm) and used for indirect georeferencing afterwards. The mean registration error is 2 mm, and the mean georeferencing deviation is 2 mm. Two point cloud segments of the same zone (mosaic) were extracted: one unified point cloud that includes measurements from 8 different positions with varying range and resolutions, and one high resolution point cloud (HPC) from one optimized position by using an extended mounted tribrach (Figure 2). This emphasized the influence of the angle of incidence and the range over the final resolution, precision and intensity of the point cloud. Therefore, we chose the HPC for its higher representativity.
Figure 2 Top View and Side view of TLS data, with the optical TLS centre’s position (red cross)
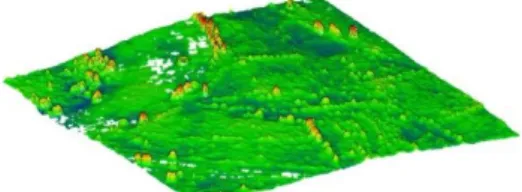
The TLS was operated at 1550 nm for a maximum pulse energy of 135 nJ. Initial filtering was conducted such as deletion of intensity overloaded pixels (from highly retro-reflective surfaces) and mixed pixel to flag problematic multi-peak scan lines and keep the right return via full-waveform analysis. The final accuracy of a single point at 78% albedo is 3 mm. The final HPC is composed of 30 336 547 points with intensity ranging from 0.0023 to 0.9916, and covers solely the mosaic (Figure 3).
Figure 3 TLS point cloud, unrealistic view from above After unwrapping the point cloud based on NURBS calculations as in (Leal et al., 2010) and using a sub-sampled knowledge-based HPC as reference, the point cloud mosaic covering 9.38 m² has an average of 3 points/mm².
In addition to spatial attributes and intensity, getting a high number of feature descriptors and parameters for each point permits a higher physical and semantical description important for classification and domain adaptation, thus fusing passive sensor’s data.
2.2.3 Point cloud from dense image matching
Several pictures were taken at different positions in order to obtain a 3D point cloud of the mosaic. These pictures were shot using a Canon EOS 5D mark III camera equipped with a 24-105 mm lens. 286 pictures of 5760 x 3840 in RAW, radiometrically equalized and normalized were used to reconstruct the point cloud. Different software benchmarked in (Nikolov and Madsen, 2016) were tested and the final image-based point cloud reconstruction (IPC) was made using ContextCapture, for its higher 3D reconstruction’s precision over the mosaic. Looking at the complexity our subject poses, a pipeline to correctly georeference the IPC is mandatory for further analysis. We first benchmarked the accuracy using control points (CP) extracted from two different sensor’s data sources (1) and (2):
(1) 46 points extracted from HPC located at the center of 46 least-problematic (due to the material nature and reflectivity) tesserae; (2) 46 points using the Leica TCRP1205 in RL at a wavelength of 660 nm by shooting the mosaic (Figure 4).
The 3D IPC generation was made by defining both references (1) or (2) as control point using 7 constraint points (yellow) the other ones being CPs (red) for control operations only.
Figure 4 Survey point network over the mosaic. In yellow, CPs used as constraints, in red, CPs used as check points only While the IPC showed a sub-pixel (sub-millimeter) median reprojection error (0.51 pixels) for extracted tie-points, the quality control over CP obtained by the total station & scan data created additional errors with a median reprojection error of 9.54 pixels (3 mm). This can be partially explained by the accuracy of both the TLS and the total station (3 mm at this distance) and the nature of the CP material. The IPC (Figure 5) is composed of 275 257 253 points which represent a density of 29 pts/mm².
Figure 5 photogrammetric point cloud, unrealistic view from above
3. KNOWLEDGE-BASED PROCESSING
The complexity in multi-source data fusion, the acquisition context and the environment lighting condition creates many challenges to the operational data capture, and by extension point cloud data processing for information extraction. Following the continuum defined by (Poux et al., 2016a), we will focus on the first part of the creation as in Figure 6. If within the point cloud and its attributes, both qualitative and quantitative, all the necessary information can be found and easily conveyed without the need for time consuming and redundant tasks, it would become a more intelligent structure for processes.
Figure 6 Derived from Smart Point Cloud (Poux et al., 2016a) Classification thus segmentation relies on data abstraction into consistent indicators and feature descriptors which can describe the essential information, both spatial and semantic, to handle precise analysis and processing. This challenge remains highly contextual as to detect relevant objects given a specific context, one must understand which descriptors one should use (Steder et al., 2011) to recognize an object composed of several points with attributes within a scene. Hence, classifying a subpart of a global entity means determining which observations lies within an interval, defined both spatially and semantically. Our work will therefore adopt a global vision over point cloud processing, involving many research fields that relate closely to the problems of data mining (Xindong Wu et al., 2014). A data-driven approach relying on automated segmentation, classification and
geometric inference (Lamdan and Wolfson, 1988) conserving contextual and domain knowledge would allow multisensory efficiency as well as scalability.
3.1 Point Cloud registration
In order to perform accurate attribute transfer in regard to (Poux et al., 2016b), control deviation was performed by comparing HPC and IPC to knowledge-based NURBS surfaces generated by sub-sampling HPC and IPC point clouds and keeping only accurate data (mosaics joints). Indeed, the material constituting the mosaic involve noisy datasets which influence the comparisons results.
Each point cloud with its associated NURBS shows a gaussian of 0 mm and a standard deviation of 2 mm (noise). The HPC/IPC NURBS comparisons gives evidence to a misalignment (Gaussian of 3.3 mm, standard deviation of 1.8 mm) explained by the precision of both the total station and TLS measurement systems (Figure 7).
Figure 7 Misalignment graph between knowledge-based NURBSs
Adapting these sensor’s signals and capturing methodology through device knowledge while retaining possible flaws is essential to control the quality of the initial information, and weight accordingly when errors subsist. Therefore, to obtain mergeable datasets, the initial registration was improved by Iterative Closest Point (ICP) (Chetverikov et al., 2005) using the TLS-based NURBS as a reference. We notice that the two generated NURBS from each error free sampled and filtered dataset present 10 µm maximum deviation after ICP, strengthening initial knowledge-based assumptions. The comparison of full resolution HPC and IPC point clouds gives a Gaussian of 10 µm and a variance of 1 mm. In regard to the low residuals in data registration, we consider the overlaying accurate for point cloud data fusion.
3.2 Pixel and attribute level fusion
Scene understanding without considering geometry is profoundly influenced by colour information. Our eyes sense detailed and precise colour for each point within our extended fovea. Then we will a priori assign a colour gradient to a specific element and use this information for precisely determining which element it is. Therefore, colour information is a very good descriptor that can be used as a semantic recognition descriptor, and classifier. However, the quality, and fidelity of the colour information for a given point, or a sample depends on many parameters:
- Sensor’s properties: the quality of the sensor, the type (CCD, CMOS, Foveon …), it’s resolution and working wavelength;
- Methodology for acquiring colour information: whereas it is a mounted external camera (nodal-point
centered), an internal device or a different point of view (parallel data acquisition);
- Colour similarity: one of the most important issue in colour distribution, mainly separating objects with shadow, highlight and texture. This can be minimize using a suited colour space (Sapkota, 2008); - Homogeneity to a high number of set-up with
different lighting conditions;
- Underlying mapping algorithm and maximal deviation to true colour;
- Temporal and spatial coherence: if the data acquisition differ temporally and spatially from the active capture, parallax and false colorization can generate a wrong descriptor.
After reviewing the state of the art in segmentation methods applied to point cloud, (Sapkota, 2008) gives an insight for point cloud segmentation using colour information. While capturing the data with a TLS, overlaying colour information means using data from another sensor, captured at the same time or another time and possibly a different position from the scanner (for optimal illumination conditions for example). The author outlines the importance of colour space choice for optimal processing and while RGB colour space is mostly used to describe colour information, distance-based similarity analysis is limited, as well as the perception of the colour by the human visual system. Choosing an adequate colour space between HSI (Hue, Saturation, and Intensity) and CIE Space is therefore essential to extend possible configurations in feature description for segmentation.
3.3 Point cloud feature extraction
An important contribution to point cloud classification and feature estimation is brought by (Weinmann et al., 2015), proposing a general framework to automatically classify a 3D scene via first selecting a neighbourhood sample, deriving feature descriptors and applying a supervised classification. They make interesting comments about suitability of features that should privileged quality over quantity of estimators displaying a need to prioritize and find robust features. This is particularly relevant considering the heterogeneity in point cloud structures, either in density, distribution or parameters.
The complexity of the 3D capturing context and conditions heavily influence the quality of available features. Therefore, the knowledge around mosaic materials and used sensors will allow to correct and obtain more representative point cloud attributes as follow:
- Spatial coordinates (X, Y, Z);
- Abstraction-based features (Poux et al., 2016a): Multi-scale voxel and octree space partitioning allow to infer initial spatial connectivity;
- Colour information from passive sensor (Sapkota, 2008): Used as a feature and a classifier for pattern recognition and information attribution. R, G, B and converted HSI, RGB/3 are studied;
- P30 Intensity (I): Intensity corrected from influential factors being atmospheric conditions, angle of incidence and range, leaving the intensity to represent with a higher fidelity the reflectivity of shot material; - Knowledge-based 3D distance map: amplitude of the
spatial error between TLS data or IPC and the knowledge-based NURBS extracted from sub-sampled filtered points;
Figure 8 3D visualisation of the TLS return colorized regarding the 3D error map
- Inverted error-map
Figure 9 3D visualisation of the projected point cloud over the reference colorized regarding inverted error map - 2nd descriptors: Density, Normals and Curvature; - Shape descriptor: RANSAC (Fischler and Bolles,
1981)
These will constitute the basis on which knowledge-based segmentation and classification routines will build themselves.
3.4 Point cloud segmentation & classification
Segmentation and feature extraction are well studied areas within point cloud processes. However, the integration of knowledge is still rare, with few example of hybrid pipelines (Ben Hmida et al., 2012; Pu and Vosselman, 2009). Our proposed approach constitute a hybrid method inspired by previous work in shape recognition (Chaperon and Goulette, 2001; Lin et al., 2013; Ochmann et al., 2016; Schnabel et al., 2007), region growing pipelines (Dimitrov and Golparvar-Fard, 2015; Nurunnabi et al., 2012; Rusu and Blodow, 2009) and abstraction-based segmentation (Aijazi et al., 2013; Douillard and Underwood, 2011; Girardeau-Montaut, 2006; Girardeau-Montaut et al., 2005; Samet and Tamminen, 1988) relying on 3D connected component labelling and voxel-based segmentation. Indeed, unstructured point cloud can benefit of structural properties that can be used as part of a segmentation process.
Our approach illustrated in Figure 10 is based on available features and directly include knowledge and semantic sources at both the segmentation stage, the classification step and the semantic injection. First, the point cloud is segmented regarding colour information by referring to the database table containing float RGB colour ranges for each material composing the mosaic. Then the gap is enhanced by superimposing intensity values over colour information. The segmentation is refined and reveals better point filtering. Then a multi-scale abstraction-based (global features extracted from a generalized spatial node such as a voxel, a sub-group or region identified spatially) routine that voxelate the 3D space at different abstraction levels and by constructing an octree structure to speed up computations.
Figure 10 Hybrid segmentation and classification pipeline for an archaeological smart point cloud structuration These steps are extracted from analytical knowledge where density information constrain the initial bounding-box containing the points. An initial low level voxel structure is computed retaining the number of points as attribute. 26-connectivity study groups adjacent voxels if voxels aren’t surrounded by empty voxels. This allows to clean possible noise from difficult colour extraction regarding the following equations:
𝑆𝑁𝑢𝑚𝑏𝑒𝑟_𝐶𝐶_1= 𝐷𝑒𝑛𝑠𝑖𝑡𝑦 ∗ min(𝑆𝑢𝑟𝑓𝑎𝑐𝑒𝑚𝑎𝑡𝑒𝑟𝑖𝑎𝑙)(1) 𝑆𝑆𝑖𝑧𝑒_𝐶𝐶_1= min(𝑉𝑜𝑙𝑢𝑚𝑒𝑚𝑎𝑡𝑒𝑟𝑖𝑎𝑙)(2) Where every group composed of less points than SNumber_CC_1 and
where the bounding box has a volume inferior as SSize_CC_1 is
deleted.
Then a multi-scale iterative 3D connected components algorithm at different octree levels starting at a voxel size of 10* 10*10 mm, recursively segments under-segmented groups (detected by injecting analytical knowledge regarding minimum Bounding-box size of processed material) by refining the voxel-based subdivision until the number of generated voxels is inferior to the density-based calculation of estimated voxels number. When subgroups dimensions correspond to material’s available knowledge, segments are added to the Independent Tesserae segments. Else, a convolution bank filter is applied regarding the longest side of the calculated best fit P.C.A Bounding Box. For absorbent materials that imply low intensity and high noise, the 3D distance map is used to detect points that belong to each tesserae. Then, for each detected segment, every point is projected on the RANSAC best fit plane, and a 2D outline algorithm calculate the convex hull of the projected points to constrain the plane. The generated polygon is then studied to establish its complexity regarding the work of (Brinkhoff et al., 1995), and domain knowledge including size, geometry and spatial distribution (Tableau 1) leads to tesserae classification.
Sample Available knowledge
Surface (in cm²) Approx. Geometry Reflectance (at 1.55 µm) Date Gold ~ 1 cm² ~ square H. Reflective XIX
Gold < 1 cm² irregular ~ Mat < Faience ~ 20
cm²
tear, diamond
Reflective XIX Silver ~ 1 cm² ~ square H. Reflective XIX C. glass ~ 1 cm² irregular ~ Reflective < C. glass ~ 1 cm² irregular ~ Absorbent < C. glass ~ 1 cm² irregular Reflective < C. glass ~ 1 cm² irregular Reflective < C. glass ~ 1 cm² irregular ~ Mat < Tableau 1 Tesserae knowledge and semantic properties Finally, semantic information is transferred to the point cloud that can be used for information extraction (Figure 11).
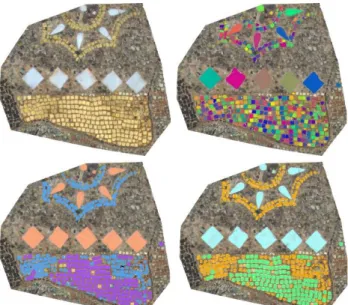
Figure 11 Point cloud from left to right, Colour, colour segmented, abstraction-based segmented, classified
Figure 12 Segmentation, Classification and Semantization
4. RESULTS
We tested the method on different samples from different zones of the mosaic to identify the influence of the segmentation and the classification in different scenarios. To assess the quality of the segmentation, knowledge-based tessera ground truth was extracted from the point cloud and compared to the segmentation method extracts. Results (Tableau 2) show an average 95% segmentation accuracy for point cloud gold tesserae, 97% for faience tesserae, 94 % for silver tesserae and 91% for coloured glass.
Tesserae Segmentation
Number of points
Accuracy Gold Ground truth Tesserae C.
Sample #1 10 891 10 801 99 %
Sample #2 10 123 11 048 91 %
Sample #3 10 272 10 648 96 %
Faience Sample #1 27 204 28 570 95 % Sample #2 23 264 22 978 99 % Sample #3 23 851 24 440 98 % Sample #4 22 238 22 985 97 % Silver Sample #1 1 364 1 373 99 % Sample #2 876 931 94 % Sample #3 3783 3 312 88 % Sample #4 1137 1 098 97 % C. Glass Sample #1 1 139 1 283 87 % Sample #2 936 1 029 90 % Sample #3 821 736 90 % Sample #4 598 625 95 %
Tableau 2 Segmentation accuracy of tesserae samples The tesserae recognition pipeline including segmentation, classification and information extraction was conducted over 3 different representative zones of the point cloud in order to be exhaustive and have the ability to count manually each tesserae for assessing the results. In the first zone containing 12 184 307 points, three types of tesserae were studied: 138 Gold tesserae from the XIX century renovation (NG), 239 ancient gold (AG) and 11 faience tesserae (FT) (Figure 13). The automatic segmentation correctly recognized all FT (100% accuracy) and 331 golden tesserae (GT) (88% accuracy), remaining ones being 5% of under-segmentation (in groups of 2/3 tesserae), 7% of tesserae not detected. The classification correctly labelled respectively 100% FT, 98% NG, and 99% AG.
Figure 13 Zone 1: Classification of tesserae. From left to right, Colour, abstraction-based segmented, classified, 2D outline In the second zone containing 12 821 752 points, 313 gold tesserae (195 NG and 118 AG) and 269 silver tesserae (ST) were processed. 284 (91%) golden tesserae were correctly segmented, of which 93% were correctly labelled NG and 95% AG, and 93% of ST were correctly segmented, of which 87% were correctly labelled. The third larger sample composed of 34 022 617 points includes 945 gold tesserae and 695 CG (coloured glass) tainted in black. The other tesserae in the sample had an insufficient resolution for ground truth generation. 839 (89%) golden tesserae were correctly segmented, of which 86% were correctly labelled NG and 95% AG. Concerning CG, (494) 71% were correctly segmented, and 98% were correctly labelled. While classification results are very high, segmentation is heavily influenced by the
quality of the data, hence, CG shows lower results because of its harsh sensor representation (tesserae are not easily discernible). Globally, 59 028 676 points and 2610 tesserae were processed, 2208 (85%) where correctly detected and segmented of which 2075 (94%) where correctly labelled (Tableau 3).
ID Tesserae Segmentation Classification Res.
Type Nb Nb % Nb % Nb NG 138 331 88% 131 98% 7 1 AG 239 196 99% 43 FT 11 11 100% 11 100% 0 NG 155 284 91% 128 93% 27 2 AG 158 139 95% 19 ST 269 249 93% 216 87% 53 NG 396 839 89% 297 86% 99 3 AG 549 471 95% 78 CG 695 494 71% 486 98% 209 Total 2610 2208 85% 2075 94% 535 Tableau 3 Recapitulative of tesserae detection results
5. DISCUSSIONS
When dealing with thousands of tesserae, manually segmenting and classifying would be a very time consuming and an error prone process. In this paper we presented an effective approach to automate tesserae recognition from terrestrial laser scanning data and dense image matching. Knowledge based feature constraints are defined to extract gold, silver, coloured glass and ceramic tesserae from a hybrid point cloud. Then convex hull polygons are fitted to different segment separately. Knowledge is introduced again to generate assumptions for problematic parts. Finally, all polygons, both directly fitted and assumed, are combined to classify and inject semantic onto the point cloud. Tests on three datasets show automated classification procedures and promising results (Figure 14). This is a first step toward an archaeological smart point cloud structure.
Figure 14 (a) Zone 3 Classification, (b) Zone 2 Classification, (c) Zone 1 Classification
The developed method tackles data quality challenges including heterogeneous density, surface roughness, curvature irregularities, and missing, erroneous data (due to reflective surfaces for example). We see that in zones where the colour quality is good and blur is low, classification results exceeds 95% accuracy. However, the method is very sensitive to 3D capture conditions and representativity such as colour, intensity, resolution and sharpness. Therefore, segmentation will fail when the input data does not allow correct feature extraction and abstraction-based connectivity estimation. More complete tesserae knowledge will help to better understand and detect complex shapes and patterns. While the classification results using domain knowledge are promising, the full point cloud labelling scheme could be enhanced by improving specifically the segmentation step. The combination of dense image matching with laser data and 3D distance map improve the outline generation in a later stage, and allows a better shape estimation (Figure 15). Yet, an efficient registration as illustrated is mandatory for accurate results.
Figure 15 Classification and Semantization of dark CG In order to improve the classification results, the segmentation can be improved using a watershed algorithm as well as obtaining higher representativity colour attribute. The method will be refined and extended to the full point cloud by implementing a machine learning framework using obtained labelled data as training data. Besides, projecting, unwrapping and processing raster images would prove useful to speed up computation and leverage existing libraries. First experiments were conducted and results are encouraging: a prototype that directly allows semantic extraction and visualisation of pertinent information for the end users was proposed in (Poux et al., 2017). Future work will also include region growing algorithms based on the center of previously extracted segments. These will then be integrated into the smart point cloud workflow for a semantically rich data structure.
6. CONCLUSION
Our paper in the context of a complex archaeological mosaic emphasised the role of knowledge in registration, segmentation and classification of point clouds. We demonstrated the importance of device knowledge for pixel and attribute fusion over point clouds from terrestrial laser scanners and dense image matching. We proposed a new segmentation and classification method that handle available and analytical knowledge including biased TLS signal to better classify the mosaic in accordance to the nature of each tesserae. The method presents a multi-scale abstraction-based segmentation followed by a domain-based classification that proved most efficient with a classification accuracy of 94%. Future work will use labelled data as training data for machine learning to automate the transition toward a smart point cloud data structure.
ACKNOWLEDGEMENTS
Line Van Wersch is acknowledged for her support and guidance in archeological reasoning. Project financed by “prix de la fondation Comhaire” - lauréate L. Van Wersch, FRS-FRNS.
REFERENCES
Aijazi, A., Checchin, P., Trassoudaine, L., 2013. Segmentation Based Classification of 3D Urban Point Clouds: A Super-Voxel Based Approach with Evaluation. Remote Sens. 5, 1624–1650. doi:10.3390/rs5041624
Ben Hmida, H., Boochs, F., Cruz, C., Nicolle, C., 2012. Knowledge Base Approach for 3D Objects Detection in Point Clouds Using 3D Processing and Specialists
Knowledge. Int. J. Adv. Intell. Syst. 5, 1–14.
Brinkhoff, T., Kriegel, H., Schneider, R., Braun, A., 1995. Measuring the Complexity of Polygonal Objects, in: Proceedings of the 3rd ACM International Workshop on Advances in Geographic Information Systems. Baltimore, Maryland, p. 109. doi:10.1.1.73.1045&rep
Chaperon, T., Goulette, F., 2001. Extracting cylinders in full 3D data using a random sampling method and the Gaussian image, in: Computer Vision and Image Understanding. pp. 35–42.
Chetverikov, D., Stepanov, D., Krsek, P., 2005. Robust Euclidean alignment of 3D point sets: the trimmed iterative closest point algorithm. Image Vis. Comput. 23, 299–309. doi:10.1016/j.imavis.2004.05.007
Dimitrov, A., Golparvar-Fard, M., 2015. Segmentation of building point cloud models including detailed architectural/structural features and MEP systems. Autom. Constr. 51, 32–45. doi:10.1016/j.autcon.2014.12.015 Douillard, B., Underwood, J., 2011. On the segmentation of 3D
LIDAR point clouds, in: International Conference on Robotics and Automation. IEEE, Shangai, pp. 2798–2805. doi:10.1109/ICRA.2011.5979818
Fischler, M.A., Bolles, R.C., 1981. Random sample consensus: a paradigm for model fitting with applications to image analysis and automated cartography. Commun. ACM 24, 381–395. doi:10.1145/358669.358692
Girardeau-Montaut, D., 2006. Détection de changement sur des données géométriques tridimensionnelles. Télécom ParisTech.
Girardeau-Montaut, D., Roux, M., Thibault, G., 2005. Change Detection on points cloud data acquired with a ground laser scanner, in: ISPRS Workshop Laser Scanning. ISPRS, Enschede.
Guarnieri, A., Remondino, F., Vettore, A., 2006. Digital photogrammetry and TLS data fusion applied to cultural heritage 3D modeling, in: Maas, H.-G., Schneider, D. (Eds.), International Archives of Photogrammetry and Remote Sensing. ISPRS.
Guest, G., 2006. How Many Interviews Are Enough?: An Experiment with Data Saturation and Variability. Field methods 18, 59–82. doi:10.1177/1525822X05279903 Höfle, B., Pfeifer, N., 2007. Correction of laser scanning intensity
data: Data and model-driven approaches. ISPRS J. Photogramm. Remote Sens. 62, 415–433. doi:10.1016/j.isprsjprs.2007.05.008
Labayrade, R., Royere, C., Gruyer, D., Aubert, D., 2005. Cooperative Fusion for Multi-Obstacles Detection With Use of Stereovision and Laser Scanner. Auton. Robots 19, 117–140. doi:10.1007/s10514-005-0611-7
Lamdan, Y., Wolfson, H.J., 1988. Geometric Hashing: A General And Efficient Model-based Recognition Scheme, in: Second International Conference on Computer Vision. IEEE, pp. 238–249. doi:10.1109/CCV.1988.589995 Landes, T., Grussenmeyer, P., 2011. Les principes fondamentaux
de la lasergrammétrie terrestre: systèmes et caractéristiques (partie 1/2). XYZ 128, 37–49.
Landes, T., Grussenmeyer, P., Boulaassal, H., 2011. Les principes fondamentaux de la lasergrammétrie terrestre: acquisition, traitement des données et applications (partie 2/2). XYZ 129, 25–38.
Leal, N., Leal, E., Branch, J.W., 2010. Simple Method for Constructing NURBS Surfaces from Unorganized Points, in: Proceedings of the 19th International Meshing Roundtable. Springer, Berlin, pp. 161–175. doi:10.1007/978-3-642-15414-0_10
Lin, H., Gao, J., Zhou, Y., Lu, G., Ye, M., Zhang, C., Liu, L., Yang, R., 2013. Semantic decomposition and
reconstruction of residential scenes from LiDAR data. ACM Trans. Graph. 32, 1. doi:10.1145/2461912.2461969 Llinas, J., Hall, D.L., 1998. An introduction to multi-sensor data fusion, in: ISCAS ’98. Proceedings of the 1998 IEEE International Symposium on Circuits and Systems. IEEE, pp. 537–540. doi:10.1109/ISCAS.1998.705329
Nikolov, I., Madsen, C., 2016. Benchmarking Close-range Structure from Motion 3D Reconstruction Software Under Varying Capturing Conditions, in: EuroMed 2016: Digital Heritage. Progress in Cultural Heritage: Documentation, Preservation, and Protection. Springer, Cham, pp. 15–26. doi:10.1007/978-3-319-48496-9_2
Nurunnabi, A., Belton, D., West, G., 2012. Robust Segmentation in Laser Scanning 3D Point Cloud Data, in: 2012 International Conference on Digital Image Computing Techniques and Applications. IEEE, Fremantle, WA, pp. 1–8. doi:10.1109/DICTA.2012.6411672
Ochmann, S., Vock, R., Wessel, R., Klein, R., 2016. Automatic reconstruction of parametric building models from indoor point clouds. Comput. Graph. 54, 94–103. doi:10.1016/j.cag.2015.07.008
Ortiz, P., Sánchez, H., Pires, H., Pérez, J.A., 2006. Experiences about fusioning 3D digitalization techniques for cultural heritage documentation, in: Maas, H.-G., Schneider, D. (Eds.), International Archives of Photogrammetry and Remote Sensing.
Petrie, G., 2009. Systematic oblique ae using multiple digitarial photography i frame cameras. Photogramm. Eng. Remote Sensing 75, 102–107.
Poux, F., Hallot, P., Neuville, R., Billen, R., 2016a. SMART POINT CLOUD: DEFINITION AND REMAINING CHALLENGES. ISPRS Ann. Photogramm. Remote Sens. Spat. Inf. Sci. IV-2/W1, 119–127. doi:10.5194/isprs-annals-IV-2-W1-119-2016
Poux, F., Neuville, R., Hallot, P., Billen, R., 2016b. Point clouds as an efficient multiscale layered spatial representation, in: Vincent, T., Biljecki, F. (Eds.), Eurographics Workshop on Urban Data Modelling and Visualisation. The Eurographics Association. doi:10.2312/udmv.20161417 Poux, F., Neuville, R., Hallot, P., Van Wersch, L., Luczfalvy
Jancsó, A., Billen, R., 2017. DIGITAL INVESTIGATIONS OF AN ARCHAEOLOGICAL SMART POINT CLOUD: A REAL TIME WEB-BASED PLATFORM TO MANAGE THE VISUALISATION OF SEMANTICAL QUERIES. ISPRS - Int. Arch. Photogramm. Remote Sens. Spat. Inf. Sci. XLII-5/W1, 581–588. doi:10.5194/isprs-archives-XLII-5-W1-581-2017
Pu, S., Vosselman, G., 2009. Knowledge based reconstruction of building models from terrestrial laser scanning data. ISPRS J. Photogramm. Remote Sens. 64, 575–584. doi:10.1016/j.isprsjprs.2009.04.001
Remondino, F., Spera, M.G., Nocerino, E., Menna, F., Nex, F., 2014. State of the art in high density image matching. Photogramm. Rec. 29, 144–166. doi:10.1111/phor.12063 Reshetyuk, Y., 2009. Self-calibration and direct georeferencing
in terrestrial laser scanning. Umea.
Rusu, R.B., Blodow, N., 2009. Close-range scene segmentation and reconstruction of 3D point cloud maps for mobile manipulation in domestic environments. Intell. Robot. Syst. IROS IEEE/RSJ Int. Conf. 1–6.
Samet, H., Tamminen, M., 1988. Efficient component labeling of images of arbitrary dimension represented by linear bintrees. IEEE Trans. Pattern Anal. Mach. Intell. 10, 579– 586. doi:10.1109/34.3918
Sapkota, P., 2008. Segmentation of coloured point cloud data. International Institute for Geo-Information science and
earth observation.
Schnabel, R., Wahl, R., Klein, R., 2007. Efficient RANSAC for Point Cloud Shape Detection. Comput. Graph. Forum 26, 214–226. doi:10.1111/j.1467-8659.2007.01016.x Steder, B., Rusu, R.B., Konolige, K., Burgard, W., 2011. Point
feature extraction on 3D range scans taking into account object boundaries, in: 2011 IEEE International Conference on Robotics and Automation. IEEE, pp. 2601–2608. doi:10.1109/ICRA.2011.5980187
Toth, C., Jóźków, G., 2015. Remote sensing platforms and sensors: A survey. ISPRS J. Photogramm. Remote Sens. 115, 22–36. doi:10.1016/j.isprsjprs.2015.10.004
Van Wersch, L., Kronz, A., Simon, K., Hocquet, F.-P., Strivay, D., 2016. Matériaux des mosaïques de Germigny-des-Prés. Germigny-des-prés.
Wei, G., Shalei, S., Bo, Z., Shuo, S., Faquan, L., Xuewu, C., 2012. Multi-wavelength canopy LiDAR for remote sensing of vegetation: Design and system performance. ISPRS J. Photogramm. Remote Sens. 69, 1–9. doi:10.1016/j.isprsjprs.2012.02.001
Weinmann, M., 2016. Reconstruction and Analysis of 3D Scenes. Springer International Publishing, Cham. doi:10.1007/978-3-319-29246-5
Weinmann, M., Jutzi, B., Hinz, S., Mallet, C., 2015. Semantic point cloud interpretation based on optimal neighborhoods, relevant features and efficient classifiers. ISPRS J. Photogramm. Remote Sens. 105, 286–304. doi:10.1016/j.isprsjprs.2015.01.016
Xindong Wu, Xingquan Zhu, Gong-Qing Wu, Wei Ding, 2014. Data mining with big data. IEEE Trans. Knowl. Data Eng. 26, 97–107. doi:10.1109/TKDE.2013.109
Zhang, J., 2010. Multi-source remote sensing data fusion: status and trends. Int. J. Image Data Fusion 1, 5–24. doi:10.1080/19479830903561035