COMPENSATORY GROWTH IN DOUBLE MUSCLED BULLS
1 2 3
Different Periods of Feed Restriction Before Compensatory Growth in Belgian Blue Bulls:
4
II. Plasma Metabolites and Hormones1
5 6
J. L. Hornick, C. Van Eenaeme, M. Diez, V. Minet, and L. Istasse.
7 8 9 10
Department of Nutrition, Veterinary Faculty, Sart Tilman
11 B43 4000 Liège, Belgium 12 13 Phone: 32-(0)4-3664139 14 Fax: 32-(0)4-3664122 15 E-mail: HORNICK@STAT.FMV.ULG.AC.BE 16 17 18 19 20 21
ABSTRACT: Plasma metabolites and hormones have been studied in 16 Belgian Blue bulls,
1
double muscled type, maintained at low growth (.5 kg/d) during 4 (G2), 8 (G3) or 14 (G4) mo
2
(low growth period, LGP) before fattening (rapid growth period, RGP). Animals from the
3
control group (CG) were fed a diet high in both energy and protein. The animals from G2, G3,
4
and G4 were fed a restricted amount of a diet low in both energy and protein during LGP and
5
the same diet as CG during RGP. Plasma glucose, alpha-amino nitrogen (AAN), NEFA, urea,
6
creatinine, thyroxine (T4), 3,3',5'-triiodothyronine (T3), and IGF-1 were analysed on blood
7
samples taken fortnightly. Plasma growth hormone (GH) and insulin (I) profiles were
8
analysed on serial blood samples obtained at three moments during growth. RGP was
9
characterized by an initial compensatory growth, by higher plasma glucose, AAN, and urea
10
levels, and by lower plasma NEFA and creatinine levels. Plasma GH concentration decreased
11
after refeeding. Plasma T4 increased linearly during refeeding, as opposed to T3, which
12
showed a different profile in each group. Plasma IGF-1 showed a curvilinear increase during
13
RGP and reached a plateau after 3 mo in each compensating groups. In G4, changes of plasma
14
metabolites and hormones differed often distinctely from G2 or G3. During refeeding, higher
15
nutrient supply improved the functionality of the somatotropic axis and increased the
16
concentration of anabolic hormones, allowing rapid muscle deposition. However, animals
17
underfed the longest period behaved differently than the other groups, possibly because they
18
reached a more complete sexual maturity.
19 20
Key Word: Belgian Blue Bulls, Compensatory Growth, Metabolites, Growth Hormone,
21
Insulin, Thyroid Hormones, IGF-1
Introduction.
1 2
Interactions between hormonal status, metabolites, and environment during growth
3
changes are complex. Feed restriction decreases the concentration of metabolites but
4
increases the concentration of somatotropin (GH) (Blum et al., 1985; Hayden et al., 1993).
5
Age exerts opposite effects and decreases the GH response of bulls to food deprivation
6
(Olbrich-Bludau et al., 1993). Insulin-like Growth Factor I (IGF-1) plays a key role in protein
7
synthesis and its secretion is GH-dependant. However, the IGF-1 concentration, as opposed to
8
GH, is well correlated to growth rate (Van Eenaeme et al., 1989; Dawson et al., 1993). Other
9
hormones also interact with the somatotropic axis. For example, elevation of plasma insulin
10
(I) is associated with a decrease of plasma GH level (Oshibe et al., 1994) whereas thyroid
11
hormones have a synergistic action with somatotropin on metabolism (Burstein et al., 1979).
12
Body development may be physiologically enhanced by compensatory growth (Wilson
13
and Osborne, 1960) when an animal is refed after a period of underfeeding. The effect of
14
compensatory growth on hormones and metabolites has never been reported in double
15
muscled type breeds. The aim of this experiment was to study, in Belgian blue bulls, double
16
muscled type, plasma concentration of metabolites and hormones during the growing and
17
fattening periods as affected by feed restriction lasting for three different time periods.
Material and Methods
1 2
The Animal Care and Use Council of our institute approved the use and treatment of
3
animals in this study. A total of 16 Belgian Blue bulls, double muscled type, were used as
4
experimental animals. They were penned in metabolic stalls and were the same animals from
5
whom nitrogen balance were previously reported by Hornick et al. (unpublished results). The
6
animals of the control group (CG) were fed a diet high in both energy and protein. The
7
animals of groups 2, 3, and 4 (G2, G3, G4) were fed initially a restricted amount of a diet low
8
in both energy and protein, calculated to allow a growth rate of .5 kg/d. This low growth
9
period (LGP) lasted for 114, 243, and 419 d, respectively in G2, G3, and G4. At the end of
10
this period, animals were offered, on an ad libitum basis, the same fattening diet as CG, a
11
transition period being managed over 15 d. Feed was offered twice daily, at 0800 and 1400.
12
Feed intake was recorded daily and live weights were measured twice a month. Jugular blood
13
samples (20 ml) were obtained fortnightly, before the animals were fed in the morning. Blood
14
was equally aliquoted in 10 ml tubes containing either Li-heparin (130 Units/10 ml) or 68 mg
15
of mixture of K-oxalate (40.80 mg) and NaF (27.20 mg) per 10 ml, and centrifuged at 4°C
16
after collection. Plasma was separated and stored at -20°c until analysis for determination of
17
glucose, α-amino nitrogen (AAN), non esterified fatty acids (NEFA), urea, creatinine,
18
thyroxine (T4), 3,3',5'-triiodothyronine (T3), and IGF-1. Serial jugular blood samples (10 ml)
19
were obtained in each group during 24h at 20 min interval on three occasions, in order to
20
determine the profile of GH and I concentration. In CG, serial measures were performed at
21
the beginning, and in the middle of the fattening period and one mo before slaughter. In G2,
G3, and G4, corresponding measurements were obtained on the middle of the low growth
1
period, 1 mo after the end of the transition period and 1 mo before slaughter.
2
The Autoanalyser Technicon was used for determination of glucose by o-toluidine
3
method (Henry et al., 1974a), urea by diacetylmonoxime method (Henry et al., 1974b) and
4
AAN by trinitrophenyl derivatisation (Palmer and Peters, 1969). NEFA were determined by
5
fused silica capillary GC (Müller and Binz, 1982). Somatotropin, I, T3, and T4 were
6
measured by radioimmunoassay using commercial kits. For GH, the kit used was developed
7
and commercialised by UCB Bioproducts, Braine l’Alleud, Belgium, using a homologous
b-8
GH antiserum and pituitary bovine GH (MW 22000) for tracer and standards as described by
9
Closset et al. (1986). The intra-assay coefficient of variation (CV) was 5.8% and inter-assay
10
CV was 11.8%. For I, the kit was developed and commercialised by Medgenix, Fleurus,
11
Belgium, using an IRMA procedure. The intra-assay CV was 7.1% while inter-assay CV was
12
11.1%. For T3 and T4, a kit commercialised by Orion Diagnostica, Espoo, Finland, was used,
13
and for IGF-1, a kit developed by Medgenix, Fleurus, Belgium, using acid-ethanol extraction.
14
The intra- and inter-assay CV were respectively 3.5 and 5.6% for T3, 3.6 and 5.9% for T4,
15
and 4.7 and 9.3% for IGF-1.
16
Data relative to GH profile were analysed with the Munro algorithm and compared
17
using the Student's t-test and the paired t-test. In order to describe the evolution of plasma
18
metabolite concentrations, values obtained twice a month were averaged per group; profiles
19
during LGP and RGP were calculated, assuming a quadratic evolution with time. Insulin, T3,
20
T4, and IGF-1 concentrations were analysed using a dynamic linear model allowing the
21
inclusion of an autoregression and a random effect in the model. This model took into account
22
the fact that each animal was observed several times, that observations made more closely in
time were more closely related and that some observations might be missing (Lindsay et al.,
1
1994). The explanatory variables used to fit the model for I profile were diet, length of the
2
low growth period, days elapse since the beginning of the experiment and accounting for any
3
seasonal component that might affect the mean I profile, age and live weight of the bulls, and
4
sampling time. The IGF-1, T3, and T4 profiles under the low energy and protein diet were
5
assumed to be similar for G2, G3, and G4. A quadratic equation was used to model the
6
evolution in LGP. Another quadratic equation was assumed to describe IGF I, T3, and T4
7
evolution in CG. Data relative to fattening period in G2, G3, and G4 were hypothesized to
8
have different evolutions. A degree two polynomial equation was fitted with a continuous
9
junction at the diet change time, ensured by adding power t' = (ti-tic) to the reference profile
10
where i indexed the groups and tic denoted the switch time to the fattening diet for group i. In
11
models relative to IGF-1, T3, and T4 profiles, the effect of weight was included or discarded
12
according to its significance. The average concentrations of each metabolite during LGP and
13
RGP were calculated and compared using Student's t-test.
Results
1 2
The ADG during the LGP was close to .5 kg/d in G2, G3, and G4 with values
3
respectively of .57, .54, and .44 kg/d. During the fattening period, the ADG was 1.32 kg/d in
4
CG while in the compensating groups, values reached respectively 1.53, 1.43, and 1.53 kg/d.
5
Only G2 showed a higher ADG during the fattening period than CG (P < .05).
6
The average plasma concentrations of metabolites during LGP and RGP are given in
7
Table 1. Figure 1 depicts the modeled evolution of metabolite concentrations during the
8
experiment. The level of glucose was high in CG and decreased linearly with time. In G2,
9
plasma glucose did not vary substantially during LGP, and raised after realimentation before
10
gradual decline. Therefore, mean values over the two periods were not different (824 vs 815
11
mg/L). Initial levels of glucose were close in G3 and G4 and decreased in a similar way
12
during LGP. After realimentation, glucose increased rapidly but to a greater extent in G4
13
where a maximum close to 1000 mg/L was observed about 3 mo after the beginning of
14
realimentation. Only G4 had a lower glucose concentration during LGP than during RGP
15
(720 vs 868 mg/L, P < .01). Glucose level was the lowest in G4 during LGP (719 mg/L, P <
16
.01) and the lowest in G3 during RGP (762 mg/L, P < .01).
17
The level of AAN showed an increase with time in CG and during LGP for the three
18
restricted groups so that mean values increased with the length of the LGP (40.3, 45.8, and
19
51.1 mg/L in G2, G3, and G4 respectively, P < .01). The level of AAN increased also during
20
the RGP for G2 and G3 (52.8 and 65.6 mg/L). However, the pattern of variation of AAN
21
during RGP of G4 was quite different from the other groups. Whereas in G2 and G3 the
22
increase after the transition period was in the line of preceeding values, in G4 RGP was
characterised by an initial sharp decrease followed by an increase . All overall mean
1
concentrations were lower during LGP than during RGP.
2
Plasma urea concentration remained high during the whole fattening period in CG.
3
During LGP in the restricted groups, values were low compared to CG, but similar among
4
groups. Animals from G4 had however higher values (92.4 vs 72.7 and 77.1 mg N/L in G4,
5
G2, and G3 respectively). After realimentation, urea level increased. The pattern of
6
concentration change was different in the three groups. In G2, the increase was continuous, in
7
G3 a plateau was reached rapidly and in G4 the concentration reached a maximum and
8
decreased afterwards. Animals from G2 showed the highest urea level (170.1 mg N/L) and G4
9
the lowest (124 mg N/L) during RGP (P < .01).
10
Levels of NEFA were low during fattening in CG and during RGP in the restricted
11
groups, especially in G4 (129.9 vs about 250 µmol/L in others groups, P < .001), but values
12
were high and close to 330 µmol/L during LGP. In G2 and G4, a sharp decrease of NEFA
13
concentration was observed following the transition period.
14
In CG, the concentration of creatinine was initially low, increased progressively to
15
reach a maximum, and decreased afterwards. During LGP in G2, G3, and G4, plasma
16
creatinine concentration showed a progressive increase (23.9, 26.6, and 27.1 mg N/L in G2,
17
G3, and G4, P < .05) but after realimentation, values decreased rapidly, especially in G4.
18
Table 2 shows the average values of GH plasma parameters calculated by the Munro
19
algorithm and of I concentration over a period of 24h. Individual GH profiles for the different
20
groups are given in Figure 2.
21
During the first period of serial blood sampling, the animals from CG had a profile of
22
GH secretion characterized by a lower pulse number than during periods II and III (P < .001
and P < .05), and a higher pulse interval than during period II (P < .001). The most significant
1
differences appeared in period III: pulse amplitude as well as pulse surface, nadir and overall
2
mean decreased when compared to period II whereas between period I and II, no differences
3
were observed for these parameters.
4
The GH profile during the low growth period in G2 was characterized by many, close
5
and large pulses with high amplitude and a high nadir, resulting in a higher mean
6
concentration than in periods II and III (P < .05). The number, amplitude and area of the
7
pulses, as well as nadir, were numerically higher during period II than during period III, and
8
mean concentration was higher (P < .01). Few differences appeared between periods in G3,
9
number, interval and surface of the pulses being similar. The nadir and mean concentration
10
were however higher during period I than during period II (P < .1) while the amplitude was
11
lower in period II than in period III (P < .05). Although a large variability of response
12
appeared in G4, period III was paradoxically characterized by a greater number of pulses.
13
However, the nadir and the overall mean remained higher in period I than in period II (P <
14
.1).
15
Large variability was associated with measurements of I concentration and the model
16
used to characterise I profile retained only the diet effect among the explanatory variables,
17
together with three harmonics to describe the I daily rhythm (Table 4). Insulin concentration
18
was close to 6 mU/L during LGP and raised from 10 to 20 mU/L when the fattening diet was
19
offered. The length of the period of restricted diet, the season, the weight or the age had no
20
detectable effects on mean I concentration. The modeled profile of I concentration over a 24h
21
period is given in Figure 3. Mean I concentration increased from around 05h00 until 09h00
22
and then declined, a maximum being observed about 3 h after the first meal. A second
increase occurred from 13h00, reaching the maximum at 18h00. From that time, a continuous
1
decrease was observed till 05h00.
2
The mean concentrations of T3, T4, and IGF-1 during fattening or during LGP are
3
given in Table 3. The modeled profiles of IGF I, T3, and T4 are given in Figure 4. The IGF-1
4
concentration was low and close to 140 ng/mL during LGP in G2, G3, and G4. The CG
5
showed high levels of IGF-1 during the whole fattening (mean value: 262 ng/mL). In
6
compensating groups the fattening period was characterized by a continuous increase with the
7
highest levels observed at the end of the period, mean values being close to 280 ng/mL. A
8
quadratic effect with time was observed for the IGF-1 profile in all groups and during both
9
periods when live weight was discarded from the model (Table 4), the response being similar
10
for all compensating groups. When weight was included in the model, the IGF I profile during
11
LGP and during fattening of CG was linear in time, while in G2, G3, and G4 it remained
12
quadratic and similar in all groups.
13
The T4 concentration was constant during LGP and during fattening in CG, but was
14
higher in the latter case. When switching to the fattening diet, T4 increased linearly and
15
independantly from the time spent on the poorer diet (figure 4). The T3 evolution was
16
different. The initial concentration was low and similar in each group. The equations
17
estimating profiles of T3 were quadratic in all groups both during LGP and fattening period.
18
There were no changes in the profile of T3 from LGP to RGP in G4 as opposed to G2, and
19
G3: G2 showed an increase during about 3 mo, reached a maximum and then decreased. G3
20
showed a progressive and continuous increase until slaughter.
Discussion
1 2
Average daily gain was close to .5 kg/d during LGP and a recovery index of 62% was
3
observed in G2. The growth rate increased until about 2 mo after the beginning of RGP,
4
reached a maximum at about 1.8 kg/d and then decreased rapidly (Hornick et al., unpublished
5 results). 6 7 Metabolites. 8 9
The decrease of plasma glucose with age has been reported in cattle (Bide et al., 1973;
10
Blum et al., 1985). In G2, unlike in G3 and G4, the glucose level did not decrease with time
11
during LGP but this may be due to the short length of restriction. The increase of the glucose
12
concentration after realimentation was probably the result of a higher ruminal production of
13
its precursor propionic acid, associated with a larger concentrate intake (Journet et al., 1995).
14
In G4, the large increase of glucose level after refeeding, when compared to G2 and G3,
15
remains unclear.
16
The increasing level of AAN in plasma during LGP and during RGP may result from a
17
higher tissue release or a decrease of tissue catch-up of amino acids from plasma because the
18
muscle protein degradation/muscle protein synthesis ratio varies with age (Simon, 1989).
19
Except in G4, plasma AAN did not vary substantially immediately after refeeding, confirming
20
previous results from Hornick et al. (1996) with Belgian Blue bulls maintained at low growth
21
before refeeding. In G4, the sudden decrease of plasma AAN immediately after the beginning
22
of the RGP suggests a catabolic activity of liver, but this hypothesis does not match with the
corresponding evolution of plasma urea. Amino acid could also be used for protein
1
deposition. However, this statement is speculative because it does not take into account the
2
interconversion of individual amino acids.
3
The increase in plasma urea concentration when turning from LGP to RGP reflected a
4
higher hepatic synthesis resulting from enhanced microbial ammonia production in the rumen
5
or greater amino acid degradation in the liver. Ellenberger et al. (1989) reported an initial
6
decrease in plasma urea after realimentation in steers and postulated that it was due to high
7
nutrient demand for increasing visceral growth. This effect was not observed in the present
8
experiment, possibly because a longer transition period was managed between LGP and RGP.
9
The longer period was necessary because the diets offered during the two periods were quite
10
different, in contrast to the experiment reported by Ellenberger et al. (1989). The slower
11
overall increase of plasma urea during RGP in G4 provided another support to protein
12
deposition, as the G4 animals had the highest nitrogen balance during RGP (Hornick et al.,
13
unpublished results). This high nitrogen deposition could result from an increase of sexual
14
steroids status associated with the age of the animals.
15
The marked higher plasma NEFA concentration during LGP, compared to fattening,
16
indicated a greater fat mobilisation, as reported by Blum et al. (1985) and Ellenberger et al.
17
(1989). This mobilisation resulted probably from endocrine status, especially the low I/GH
18
ratio (Vernon, 1992). Also thyroid hormones are known to be lipolytic, especially in cold
19
exposure (Sasaki and Weekes, 1986). However, in our experiment, T3 and T4 levels were low
20
during LGP, so their contribution to high NEFA levels was presumably not important.
21
Plasma creatinine concentration is known to be weight dependent (Seashore et al, 1981;
22
Schroeder et al., 1990). Surprisingly, it decreased when animals were catching-up weight. The
sudden decrease in the concentration of creatinine after realimentation has been observed
1
previously in our laboratory (unpublished results). Keenan and Allardyce (1986) reported also
2
changes in creatinine levels in sheep under different nutritional status, and ascribed it to
3
changes in creatinine clearance.
4 5
Hormones.
6 7
Considerable variation among GH profiles appeared between animals. The meaning of
8
such differences is not known (Wheaton et al., 1986; Gluckman et al., 1987). Several authors
9
reported that the secretion of GH was increased during a period of nutritional restriction
10
(Breier et al, 1986; Wheaton et al., 1986; Breier et al., 1988b; Ellenberger et al., 1989), or
11
during a period of low growth rate (Wheaton et al., 1986; Dawson et al, 1993). Similar results
12
have been observed in this experiment. The plasma concentration of GH is the balance
13
between pituitary secretion and clearance from the circulation (Van der Walt, 1994). Thus,
14
the lower nadir and mean concentration of GH during the beginning of RGP than during LGP
15
came from either a decrease of the secretion by the pituitary gland or by a higher clearance
16
from the plasma. If a stimulation of the secretion of GH was implicated in the higher mean
17
GH levels, this should be reflected by higher pulse number or higher pulse amplitude in LGP
18
when compared to RGP. This was not observed in our experiment, suggesting that lower
19
clearance was responsible of high mean GH levels during LGP. Lower clearance during LGP
20
could be associated with the low synthesis of high affinity hepatic GH receptor in feed
21
restricted animals (Breier et al., 1988a, 1988b). The decrease of GH levels during RGP could
22
also be explained by the inhibition of GH release following the distension of the rumen
(Tindal et al., 1985), because during RGP, the animals were fed on an ad libitum basis, as
1
opposed to LGP.
2
The high GH levels during LGP could also explain the high NEFA concentration during
3
this period, because GH has a lipolytic activity on adipose tissue (Grichting et al., 1983; Hart
4
et al., 1984), while GH receptor are not negatively regulated by feed restriction, in contrast to
5
liver receptor (Gluckman et al., 1987). This allowed the use of fat as energy source during
6
feed restriction.
7
Feeding conditions and growth rates were similar during LGP in the restricted groups
8
and also during fattening in all groups. However, there were, to some extent, significant
9
decreases in the concentration of GH with live weight and age in both periods (Table 3). Age
10
or live weight alter the sensitivity of the pituitary gland to hypothalamic hormones
(Della-11
Fera et al, 1986; Dubreuil et al, 1987; Schwartz et al., 1992). Plouzek and Trenkle (1991b)
12
and Mears and Schaalje (1993) observed that, as body weight increased, secretion, clearance,
13
and half-life of GH decreased. Similarly, Olbrich-Bludau et al (1993) reported that young
14
bulls responded to a greater extent to feed restriction than mature bulls, by increasing
15
frequency and amplitude of GH peaks. More surprising was the high pulse frequency
16
observed in G4 and the overall higher pulse interval, amplitude, area, nadir, and GH average
17
concentration at the end of the fattening period in compensating groups when compared to
18
CG. This may be due to an effect of the compensatory growth or to the different feeding
19
behaviour at this stage of fattening as animals tended to delay feeding at the end of the RGP,
20
possibly altering their GH secretion profile. The onset of progressive sexual maturity during
21
RGP could also enhance GH secretion (Plouzek and Trenkle, 1991a), especially in G4.
Numerous factors, such as nervous stimulation, plasma glucose, volatile fatty acids and
1
amino acids trigger the secretion of I by the pancreas (Brockman, 1984; Weekes, 1986).
2
Nervous induced stimulation occurred in our experiment because I concentration began to
3
increase before feeding (Figure 3). This phenomenon has been also reported by Ndibualonji et
4
al. (1995) in cows. Concentrates are known to increase the production of propionic and
5
butyric acids in the rumen (Journet et al., 1995) and propionate is particularly efficient in
6
inducing secretion of I (Istasse et al., 1987). The larger intake of protein during fattening
7
when compared to LGP could also enhance the secretion of I as a result of a higher portal
8
plasma amino acids. Insulin is implicated in post-prandial protein synthesis (Preedy and
9
Garlick, 1986)but is mainly lipogenic (Gregory et al., 1982). Thus, the low concentration of I
10
during LGP resulted in lower anabolic processes and higher lipolysis, enhancing lipid
11
mobilisation induced by high GH levels (Blum et al., 1985; Hayden, 1993). Furthermore, the
12
increase in plasma I concentration during the fattening period could have reduced GH levels
13
(Pecile et al., 1971; Oshibe et al., 1994).
14
Higher plasma IGF-1 during RGP was related to nutritional status, especially dietary
15
protein intake (Elsasser et al., 1989), and also to growth rate (Breier et al., 1986; Gluckman et
16
al., 1987; Ellenberger et al., 1989). Our results supported thus the somatomedin hypothesis of
17
Daughaday et al. (1972). Indeed, the opposite change in IGF-1 concentration as compared to
18
GH production is explained by a "receptor blocking system" during LGP, preventing GH to
19
attach to high affinity hepatic receptors, thus breaking off the mediation of GH action by
IGF-20
1. The lower IGF-1 concentration during LGP may also be related to alterations in ratio of
21
high and low affinity IGF-1 binding protein (IGFBP) (Breier and Gluckman, 1991). In
22
addition, Massart et al. (1995) reported that plasma from our bulls contained less high affinity
IGFBP-3 and more low affinity IGFBP-2 during the LGP. These observations suggest that the
1
onset of GH-dependent IGF-1 action would be possible only when feeding conditions are
2
sufficiently favourable (Breier et al., 1988b). The IGF-I concentration increased also with live
3
weight or age. This has been reported several times in bulls (Breier et al., 1988b; Ronge and
4
Blum, 1989; Schwartz et al., 1992). However, plasma IGF-1 increased more rapidly and
5
reached higher maximum values in G2, G3 and G4 than in CG, suggesting an effect of
6
compensatory growth. Both profiles -growth curve and IGF-1 concentration- were similar
7
during the first part of RGP. Afterwards, the IGF-1 concentration remained high at the end of
8
the RGP in G2, G3, and G4, whereas ADG decreased rapidly as animals reached their mature
9
live weight. This decrease ADG should be associated to higher fat deposition. Although the
10
relationship between ADG and the corresponding IGF-1 concentration is weak (Davis et al.,
11
1989; Ronge and Blum, 1989; McKinnon et al, 1993), these observations suggest that other
12
hormonal alterations were responsible for fat deposition during fattening. The ratio I to GH is
13
among the most important of these alterations (Vernon, 1992).
14
According to Kühn et al., 1986 and Cabello and Wrutniak (1989), the synergistic
15
relationship between activities of thyroid and somatotropic axes also has a decisive role in
16
growth control. In hypothyroidic rats, the circulating GH and IGF-1 concentrations are
17
decreased and neither Growth Hormone Releasing Factor (GRF) nor GH are able to restore
18
GH or IGF-1 concentration (Burstein et al., 1979; Dieguez et al., 1986). Hyperthyroidism also
19
affect the function of the somatotropic axis and growth response because it blunts the GH
20
response to GRF (Dieguez et al, 1986) and increases basal metabolism, although results are
21
less clear in cattle (Elsasser et al., 1992). However, in the present experiment, it could be
22
assumed that the animals were euthyroidic, at least during the fattening period.
The lower T3 and T4 concentration during LGP may be ascribed to different
1
phenomena, such as reduced thyroidic stimulating hormone secretion, higher degradation rate,
2
lower conversion of T4 into T3 or a shift in conversion from T3 to inactive reverse T3
3
(Balsam and Ingbar, 1979; Tveit and Almlid, 1980; Wrutniak and Cabello, 1987). These
4
lower levels had probably a role in the uncoupling of GH and IGF-1 concentration during
5
feed restriction (Blum et al., 1980; Blum and Kunz, 1981; Tveit and Larsen, 1983; Hayden et
6
al., 1993).
7
The T3 evolution was quadratic and similar to that of IGF-I in CG and during RGP in
8
G2. By contrast, T4 evolution was stable in CG and increased linearly during RGP of
9
compensating groups. These results suggest that T3 is a better indicator of changes in growth
10
rates and growth composition. However, Ellenberger et al. (1989) observed that T3 levels was
11
unaltered after refeeding. It was possible that their period of blood sampling, about 1 mo, was
12
too short to observe such an increase in T3 levels. The sensibility of T3 to environnemental
13
factors is also suggested by the response of animals from G3 which showed the greatest
14
increase in T3 concentration, as they were fattened during winter. Indeed, T3 is known to be
15
involved in thermogenesis (Scott and Christopherson, 1993). In G4, the lack of a detectable
16
increase of T3 levels after realimentation, associated with the other metabolic alterations
17
reported previously, indicates that in this group, the mechanism of compensatory growth was
18
probably different with respect to G2 or G3.
Implications
1 2
Compensatory growth was characterized by alterations of several hormone
3
concentrations. Presumably, the onset of compensatory growth in Belgian Blue double
4
muscled bulls may be ascribed to large protein deposition associated with a more functionnal
5
somatotropic axis and with increased levels of anabolic hormones such as insulin, IGF-I and
6
thyroid hormones. Afterwards, fat deposition occurs rapidly as a consequence of increase
7
insulin to GH ratio. After a very long period of restricted feeding, the mechanism of
8
compensatory growth seemed different on a metabolic or endocrinologic point of vue. Further
9
experiments are needed to study the effects of severe feed restriction before compensatory
10
growth on plasma metabolites and hormones in double muscled cattle.
11 12
Literature Cited
1 2
Balsam, A., and S. H. Ingbar. 1979. Observations on the factors that control the generation of
3
triiodothyronine from thyroxine in rat liver and the nature of the defect induced by fasting.
4
J. Clin. Invest. 63:1145-1156.
5
Bide, R. W. , W. J. Dorward, and M. E. Tumbleson. 1973. Clinical chemistry of grain-fed
6
cattle. I. A preliminary study of a basic biomedical profile. Can. J. Anim. Sci. 53:697-707.
7
Blum, J. W. , M. Gingins, P. Vitins, and H. Bickel. 1980. Thyroid hormone levels related to
8
energy and nitrogen balance during weight loss and regain in adult sheep. Acta Endocrinol.
9
93:440-447.
10
Blum, J. W., and P. Kunz. 1981. Metabolic effects of fasting in steers. Res. Vet. Sci.
31:127-11
129.
12
Blum, J. W. , W. Schnyder, P. L. Kunz, A. K. Blom, H. Bickel, and A. Schürch. 1985.
13
Reduced and compensatory growth: endocrine and metabolic changes during feed
14
restriction and reffeding in steers. J. Nutr. 115:417-424.
15
Breier, B. H. , J. J. Bass, J. H. Butler, and P. D. Gluckman. 1986. The somatotrophic axis in
16
young steers: influence of nutritional status on pulsatile release of growth hormone and
17
circulating concentrations of insulin-like growth factor 1. J. Endocr. 111:209-215.
18
Breier, B. H. , P. D. Gluckman, and J. J. Bass. 1988a. The somatotrophic axis in young steers:
19
influence of nutritional status and oestradiol-17ß on hepatic high- and low-affinity
20
somatotrophic binding sites. J. Endocr. 116:169-177.
Breier, B. H. , P. D. Gluckman, and J. J. Bass. 1988b. Influence of nutritional status and
1
oestradiol-17ß on plasma growth hormone, insulin-like growth factors-I and -II and the
2
response to exogenous growth hormone in young steers. J. Endocr. 118:243-250.
3
Breier, B. H., and P. D. Gluckman. 1991. The regulation of postnatal growth: nutritional
4
influences on endocrine pathways and function of the somatotrophic axis. Livest. Prod.
5
Sci. 27:77-94.
6
Brockman, R.P. 1984. Pancreatic and adrenal hormonal regulation of metabolism. In: L.P.,
7
Milligan, W.L., Grovum, and A., Dobson. (Ed.) Control of digestion and metabolism in
8
ruminants P 405-419. Prentice-Hall, New Jersey.
9
Burstein, P. J. , B. Draznin, C. J. Johnson, and D. S. Schlach. 1979. The effect of
10
hypothyroidism on growth, serum growth hormone, the growth hormone-dependent
11
somatomedin, insulin-like growth factor, and its carrier protein in rats. Endocrinology
12
104:1107-1111.
13
Cabello, G., and C. Wrutniak. 1989. Thyroid hormone and growth: relationships with growth
14
hormone effedts and regulation. Reprod. Nutr. Develop. 29:387-402.
15
Closset, J., G. Maghuin-Rogister, Tran Quang Minh, O. Lambot, and G. Hennen. 1986.
16
Immunological growth promotion of bulls by a synthetic vaccine inhibiting the
17
endogeneous somatostatin. In: Proc. 32nd Eur. Meeting Meat Res. Workers. p 19. Ghent.
18
Daughaday, W. H. 1972. Somatomedin: proposed designation for sulphation factor. Nature
19
(London) 235:107.
20
Davis, S. R. , V. C. Farr, P. D. Gluckman, and B. H. Breier. 1989. A note on annual variation
21
of plasma insulin-like growth factor-I concentrations and growth rates of Jersey heifers
22
differing in genetic merit for milk production. Anim. Prod. 48:467-470.
Dawson, J. M. , J. Craigon, P. J. Buttery, and D. E. Beever. 1993. Influence of diet and
ß-1
agonist administration on plasma concentrations of growth hormone and insulin-like
2
growth factor-1 in young steers . Br. J. Nutr. 70:93-102.
3
Della-Fera, M. A. , F. C. Buonomo, and C. A. Baile. 1986. Growth hormone secretory
4
responsiveness to multiple injections of growth hormone-releasing factor in sheep.
5
Domest. Anim. Endocrinol. 3:153-164.
6
Dieguez, C. , V. Jordan, P. Harris, S. Foord, M. D. Rodriguez-Arnao, A. Gomez-Pan, R. Hall,
7
and M. F. Scanlon. 1986. Growth hormone responses to growth hormone-releasing factor
8
(1-29) in euthyroid, hypothyroid and hyperthyroid rats. J. Endocr. 109:53-56.
9
Dubreuil, P. , G. Pelletier, D. Petitclerc, H. Lapierre, Y. Couture, P. Brazeau, P. Gaudreau,
10
and J. Morisset. 1987. Influence of age and sex on basal secretion of growth hormone
11
(GH) and on GH-induced release by porcine GH-releasing factor pGRF(1-29NH2) in
12
growing pigs. Domest. Anim. Endocrinol. 4:299-307.
13
Ellenberger, M. A. , D. E. Johnson, G. E. Cartsens, K. L. Hossner, M. D. Holland, T. M. Nett,
14
and C. F. Nockels. 1989. Endocrine and metabolic changes during altered growth rates in
15
beef cattle. J. Anim. Sci. 67:1446-1454.
16
Elsasser, T. H. , T. S. Rumsey, and A. C. Hammond. 1989. Influence of diet on basal and
17
growth hormone-stimulated plasma concentration of IGF-1 in beef cattle. J. Anim. Sci.
18
67:128-141.
19
Elsasser, T. H. , T. S. Rumsey, and S. A. Norton. 1992. Relationships between the thyroid and
20
somatotropic axes in steers . 1. Effects of propylthiouracil-induced hypothyroidism on
21
growth hormone, thyroid stimulating hormone and insulin-like growth factor-I. Domest.
22
Anim. Endocrinol. 9:261-271.
Gluckman, P. D. , B. H. Breier, and S. R. Davis. 1987. Symposium: growth hormone and
1
biotechnology. J. Dairy Sci. 70:442-446.
2
Gregory, N. G. , T. G. Truscott, and J. D. Wood. 1982. Insulin secretion in relation to fatness
3
in cattle. J. Sci. Food Agric. 33:276-282.
4
Grichting, G. , L. K. Levy, and H. M. Goodman. 1983. Relationship between binding and
5
biological effects of human growth hormone in rat adipocytes. Endocrinology
113:1111-6
1120.
7
Hart, C. , M. E. Chadwick, T. C. Boone, K. E. Langley, C. Rudman, and L. M. Souza. 1984.
8
A comparison of the growth-promoting, lipolytic, diabetogenic and immunological
9
properties of pituitary and recombinant-DNA-derived. Biochem. J. 224:93-100.
10
Hayden, J. M. , J. E. Williams, and R. J. Collier. 1993. Plasma growth hormone, insulin-like
11
growth factor, insulin, and thyroid hormone association with body protein and fat accretion
12
in steers undergoing compensatory gain after dietary energy restriction. J. Anim. Sci.
13
71:3327-3338.
14
Henry, R. J., D. C. Cannon, and J. W. Winkelman. 1974a. Clinical chemistry. Principles and
15
technics p 1289. Harper & Row, New York.
16
Henry, R. J., D. C. Cannon, and J. W. Winkelman. 1974b. Clinical chemistry. Principles and
17
technics pp 517. Harper & Row, New York.
18
Hornick, J. L., C. Van Eenaeme, S. Gauthier, P. Baldwin, and L. Istasse. 1996. Glucose,
19
alpha-amino nitrogen, and amino acid exchange across the hindlimb in young
double-20
muscled type bulls maintained at two growth rates. Can. J. Anim. Sci. 74: 193-202.
Istasse, L., F.D.D. Hovell, N.A. Macleod, and E.R. Orskov. 1987. The effects of continuous
1
or intermittent infusion of propionic acid on plasma insulin and milk yield in dairy cows
2
nourished by intragastric infusion of nutrients. Livest. Prod. Sci. 16: 201-214.
3
Journet, M., G. Huntington, and J.L. Peyraud. 1995. Le bilan des produits terminaux de la
4
digestion. In: R. Jarrige, Y. Ruckebusch, C. Demarquilly, M.H. Farce, and M. Journet.
5
(Ed.) Nutrition des ruminants domestiques. Ingestion et digestion. P 671-720. INRA, Paris.
6
Keenan, D.M., and Allardyce, C.J. 1986. Changes in plasma creatinine levels of sheep during
7
submaintenance feeding. Austr. Vet. J. 63:29-30.
8
Kühn, E. R. , P. Van Osselaer, O. Siau, E. Decuypere, and A. Moreels. 1986. Thyroid
9
function in newborn lambs: influence of prolactin and growth hormone. J. Endocr.
10
109:215-219.
11
Lindsay, J. K. , Genicot, B., and Lambert, P. 1994. Dynamic linear models for clinical
12
research veterinary medicine. In: Proceeding XVIII World Buiatrics Congress. p 1501.
13
Bologna, Italy.
14
Massart, S., C. Van Eenaeme, R. Renaville, M. Sneyers, L. Istasse, M. Falaki, A. Clinquart,
15
A. Burny, and D. Portelle. Food restriction and IGFBPs in bulls: effects of increasing
16
starving period lengths. Annual Congress of ASAS. July, 1995. Orlando.
17
Mckinnon, J. J. , R. D. H. Cohen, S. D. Jones, B. Laarveld, and D. A. Christensen. 1993. The
18
effects of dietary energy and crude protein concentration on growth and serum insulin-like
19
growth factor-1 levels of cattle that differ in mature body size. Can. J. Anim. Sci.
73:303-20
313.
21
Mears, G. J., and G. B. Schaalje. 1993. Growth and growth hormone kinetics in holstein steer
22
calves. Can. J. Anim. Sci. 73:277-285.
Müller, H. W., and K. Binz. 1982. Glass capillary gas chromatography of the serum fatty
1
acids fraction via automatic injections of lipid extracts. J. Chromatog. Biomed. Appl. 228:
2
75-93.
3
Ndibualonji, B.B., D. Dehareng, and J.M. Godeau. 1995. La sous-alimentation énergétique
4
et/ou azotée chez la vache tarie. Effets sur les acides gras volatils du rumen, quelques
5
métabolites et hormones du plasma et l'excrétion urinaire de la 3-méthylhistidine. Reprod.
6
Nutr. Dev. 35:137-154.
7
Olbrich-Bludau, A., D. Schams, E. Schallenberger, R. Graml, and F. Pirchner. 1993.
8
Relationship between age, nutritional status and dairy merit with plasma profiles of growth
9
hormone (GH) and free fatty acids (FFA) in bulls. Journal. of Animal. Breeding. and.
10
Genetics -. Zeitschrift. Fur. Tierzuchtung. und. Zuchtungsbiologie. 110:171-181.
11
Oshibe, A. , M. Ishida, S. Ando, S. Oshio, and K. Hodate. 1994. Responses of plasma growth
12
hormone and insulin concentration to intraruminal injections of n-butyrate and acetate in
13
cattle. Anim. Sci. Technol. (Jpn. )65:209-216.
14
Palmer, D. W., and J. T. Peters. 1969. Automated determination of free amino groups in
15
serum and plasma using 2,4,6-trinitrobenzene sulfonate. Clin. Chem. 19: 891-901.
16
Pecile, A. , E. E. Müller, M. Felici, C. Netti, and D. Cocchi. 1971. Influence of insulin
17
injected into the lateral ventricle on pituitary growth-hormone release in the rat. J. Endocr.
18
50:51-58.
19
Plouzek, C. A., and A. Trenkle. 1991a. Insulin-like growth factor-I concentrations in plasma
20
of intact and castrated male and female cattle at four ages. Domest. Anim. Endocrinol.
21
8:73-79.
Plouzek, C. A., and A. Trenkle. 1991b. Growth hormone parameters at four ages in intact and
1
castrated male and female cattle. Domest. Anim. Endocrinol. 8:63-72.
2
Preedy, V.R., and P.J. Garlick. 1986. The response of muscle protein synthesis to nutrient intake
3
in postabsorbtive rats: the role of insulin and amino acids. Biosci.Rep. 6:177-183.
4
Ronge, H., and J. Blum. 1989. Insulin-like growth factor I during growth in bulls. Reprod.
5
Nutr. Develop. 29:105-111.
6
Sasaki, Y., and T.E.C., Weekes. 1986. Metabolic responses to cold. In: L.P., Milligan, W.L.,
7
Grovum, and A., Dobson. (Ed.) Control of digestion and metabolism in ruminants P
326-8
343. Prentice-Hall, New Jersey.
9
Schroeder, A. L. , W. G. Bergen, and R. A. Merkel. 1990. Estimation of lean body mass
10
(LBM), empty body protein (EBP) and skeletal muscle protein (SMP) from urinary
11
creatinine excretion (UCE) in beef steers. J. Anim. Sci. 68 (suppl. 1):311 (abstr. ).
12
Schwartz, F. J. , R. Röpke, D. Schams, and M. Kirchgessner. 1992. Effects of sex and growth
13
on plasma concentration of growth hormone, insulin-like growth factor-I and insulin in
14
fattening simmental cattle. J. Anim. Physiol. a. Anim. Nutr. 68:263-271.
15
Scott, S. L., and R. J. Christopherson. 1993. The effect of cold adaptation on kinetics of
16
insulin and growth hormone in heifers. Can. J. Anim. Sci. 73:33-47.
17
Seashore, J. H. , G. Huszar, and E. M. Davis. 1981. Urinary 3-methylhistidine/Creatine ratio
18
as a clinical tool: correlation between 3-methylhistidine excretion and metabolic and
19
clinical states in healthy and stressed premature infants. Metabolism 30:959-969.
20
Simon, O. 1989. Metabolism of proteins and amino acids. In: H.D. Bock, B.O. Eggum, A.G.
21
Low, O. Simon, and T. Zebrowska T. (Ed.). Protein metabolism in farm animals. p 273.
22
Oxford Sci Publ-Deutscher Landwirtsschaftsverlag Berlin.
Tindal, J. S. , L. A. Blake, A. D. Simmonds, and I. C. Hart. 1985. Inhibition of growth
1
hormone release by rumen distension in female goats. J. Endocr. 104:159-163.
2
Tveit, B., and T. Almlid. 1980. T4 degradation rate and plasma levels of TSH and thyroid
3
hormones in ten young bulls during feeding conditions and 48 h of starvation. Acta
4
Endocrinol. 93:435-439.
5
Tveit, B., and F. Larsen. 1983. Suppression and stimulation of TSH and thyroid hormones in
6
bulls during starvation and refeeding. Acta Endocrinol. 103:223-226.
7
Van der Walt, J. G. 1994. Somatotropin physiology - a review. S. Afr. J. Anim. Sci. 24:1-9.
8
Van Eenaeme, C., L. Istasse, P. Baldwin, A. Gabriel, V. De Haan, and J. M. Bienfait. 1989.
9
Muscle protein turnover in young bulls in relation to breed and hormonal status. As. Austr.
10
J. An. Sci. 2:200-201.
11
Vernon, R.G. 1992. Control of lipogenesis and lipolysis. In: P.J., Buttery, K.N., Boorman, D.B.,
12
and D.B. Lindsay (Ed.). The control of fat and lean deposition, P. 59-77.
Butterworth-13
Heinemann, Oxford.
14
Weekes, T.E.C. 1986. Insulin and growth. In: P.J., Buttery, D.B., Lindsay, and N.B. Haynes
15
(Ed.) Control and manipulation of animal growth P 187-206. Butterworths, Boston.
16
Wheaton, J. E. , S. N. Al-Raheem, Y. G. Massri, and J. M. Marcek. 1986. Twenty-four-hour
17
growth hormone profiles in Angus steers. J. Anim. Sci. 62:1267-1272.
18
Wilson, P. N., and D. F. Osbourn. 1960. Compensatory growth after undernutrition in
19
mammals and birds. Biol. Rev. 35:324-363.
20
Wrutniak, C., and G. Cabello. 1987. Effects of food restriction on cortisol, TSH and
21
iodothyronin concentrations in the plasma of newborn lamb. Reprod. Nutr. Develop.
22
27:721-732.
Table 1. Mean concentration of α-amino nitrogen, urea nitrogen, non esterified fatty acids and creatinine during fattening (CG) or during low growth periods (LGP) lasting for 4, 8, or 14 mo (G2, G3, G4) before a fattening period (RGP) in Belgian Blue double muscled bulls.
Group
Items CG G2 G3 G4 Levels SEM
Glucose, mg/L LGP 824.3a 774.2ab 719.7bx + 15.6 RGP 845.9a 815.4a 762.3b 867.5ay + 17.8 AAN, mg N/L LGP #40.3ax #45.8bx #51.1ax + 1.5 RGP #49.3c #52.8byc #65.6ay #53.7by + 1.7 Urea, mg N/L LGP #72.7x #77.1x #92.4x NS 5.7 RGP 161.7a 170.1ay 151.1ay 124.0by + 6.3 NEFA, µmol/L LGP 342.4x 335.8 318.7x NS 23.8 RGP 261.7a 294.4ay 254.9a 129.9by * 20.7 Creatinine, mg N/L LGP #23.9 #26.6x #27.1x NS 0.8 RGP #21.6a #22.9b #24.3ayb #23.6by + 0.7 a,b,c
Effect of group. Means with different superscript within a row differed at P < .1 (+) or .05 (*). NS: not significant.
x,y,z Effect of period. Means within a column for each metabolite and with different
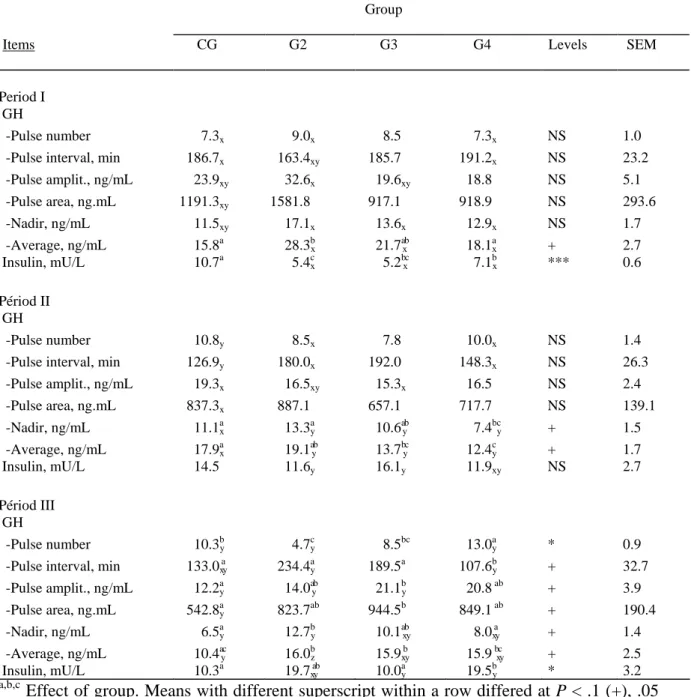
Table 2: Characteristics of GH profiles calculated by the Munro algorithm and mean insulin concentration, at the beginning, in the middle and at the end of the fattening period (CG), in the middle of the low growth period lasting for 4, 8 or 14 mo (G2, G3, G4) and at the beginning and the end of the subsequent fattening period in Belgian Blue double muscled bulls.
Group
Items CG G2 G3 G4 Levels SEM
Period I GH
-Pulse number ###7.3x ###9.0x ###8.5 ###7.3x NS 1.0
-Pulse interval, min #186.7x #163.4xy #185.7 #191.2x NS 23.2
-Pulse amplit., ng/mL ##23.9xy ##32.6x ##19.6xy ##18.8 NS 5.1 -Pulse area, ng.mL 1191.3xy 1581.8 #917.1 #918.9 NS 293.6 -Nadir, ng/mL ##11.5xy ##17.1x ##13.6x ##12.9x NS 1.7 -Average, ng/mL ##15.8a ##28.3bx ##21.7 axb ##18.1ax + 2.7 Insulin, mU/L #10.7a ##5.4cx #5.2bxc ##7.1bx *** 0.6 Périod II GH -Pulse number ##10.8y ###8.5x ###7.8 ##10.0x NS 1.4
-Pulse interval, min #126.9y #180.0x #192.0 #148.3x NS 26.3
-Pulse amplit., ng/mL ##19.3x ##16.5xy ##15.3x ##16.5 NS 2.4 -Pulse area, ng.mL #837.3x #887.1 #657.1 #717.7 NS 139.1 -Nadir, ng/mL ##11.1 ax ##13.3ay ##10.6 ayb ###7.4bcy + 1.5 -Average, ng/mL ##17.9 ax ##19.1 ayb ##13.7 byc ##12.4cy + 1.7 Insulin, mU/L 14.5 11.6y 16.1y #11.9xy NS 2.7 Périod III GH -Pulse number ##10.3by ###4.7cy ###8.5bc ##13.0ay * 0.9
-Pulse interval, min #133.0xay #234.4ya #189.5a #107.6 by + 32.7
-Pulse amplit., ng/mL ##12.2ay ##14.0 ayb ##21.1by ##20.8 ab + 3.9 -Pulse area, ng.mL #542.8 ay #823.7ab #944.5b #849.1 ab + 190.4 -Nadir, ng/mL ###6.5 ay ##12.7by ##10.1 axby ###8.0 xay + 1.4 -Average, ng/mL ##10.4ayc ##16.0bz ##15.9xby ##15.9 bxcy + 2.5 Insulin, mU/L #10.3a ##19.7xayb ##10.0ay #19.5 by * 3.2 a,b,c
Effect of group. Means with different superscript within a row differed at P < .1 (+), .05 (*), or .001 (***). NS: not significant.
x,y,z Effect of period. Means referring to similar items and with different lowerscript within a
Table 3. Mean concentration of T3, T4, and IGF-1 during fattening (CG) or during low growth periods (LGP) lasting for 4, 8, or 14 mo (G2, G3, G4) before a fattening period (RGP) in Belgian Blue double muscled bulls.
Group Items CG G2 G3 G4 SEM T3, nmol/mL LGP 0.67x 0.80 x 0.74 x 0.13 RGP 1.15 0.91y 1.02 y 1.05 y 0.16 T4, nmol/mL LGP 36.6 x #48.1 x 42.2 x 6.2 RGP 61.8a 47.9by 58.5ayb 52.1 ayb 7.6 IGF-1, ng/mL LGP 135.3 x 158.4 x 119.0 x 17.1 RGP 262.3 267.4 y 306.7 y 260.1 y 38.5 a,b
Effect of group. Means with different superscript within a row differed at P < .1
x,y Effect of period. Means within a column for each metabolite and with different lowerscript
Table 4. Equations describing the modeled profile of insulin concentration on 24h period and of T3, T4 and IGF-1 concentration on biweekly blood samples.
Hormone Insulin SEM: 4.7 LGP (a) y = 6.02+.1437cos(wt)-2.014sin(wt)-.8692cos(2wt)-.7966sin(2wt)+.7219cos(3wt)+.8087sin(3wt) RGP (b) y = 13.38+.1437cos(wt)-2.014sin(wt)-.8692cos(2wt)-T4 SEM: 11.2 CG (c) y = 24.92+.6868.X. LGP (d) y = 16.45+.6865.X. RGP (e) y = 16.45+.6865.X +.1470trg. T3 SEM: 0.32 CG (f) y = .507+.00571.tf+.0000178.tf²+.408.X0 LGP (G2, G3) (g) y = .586-.00189.tlg+.0000048.tlg²+.408.X0 RGP (G2) (h) y = .586-.00189tlg+.0000048.tlg²+.408.X0+.0111.trg-.0000622.trg² RGP (G3) (i) y = .586-.00189tlg+.0000048.tlg²+.408.X0+.00323.trg-.0000757.trg² G4 (j) y = .586-.00189.tlg+.0000048.tlg²+.408.X0 IGF1 SEM: 53.5 CG (k) y = 18.14+1.584trg-.005225trg²+.6704X0 LGP (l) y = 50.03+0.2621tlg+.0002155tlg²+.6704X0 RGP (m) y = 50.03+.2621tlg +.0002155tlg²+.6704X0+2.433trg-.01054trg²
w=2∏/24;t=clock time in hours; tlg and trg denote the time elapse since the beginning of the Low Growth or the Rapid Growth Period respectively; X0 denotes the value at tlg = 0.
Figure 1: Modeled profile of daily concentration of glucose, alpha amino nitrogen, urea, non esterified fatty acids and creatinine during fattening (CG) or during low growth periods lasting for 4, 8, or 14 mo before a fattening period (G2, G3, G4) in Belgian Blue bulls double muscled. Arrows indicate the beginning of the fattening period. The bars indicate the standard error of the mean.
Creatinine 16 18 20 22 24 26 28 30 0 100 200 300 400 500 600 Days m g /L CG G2 G3 G4 NEFA 0 100 200 300 400 500 600 µ m o l/ L Urea N 0 50 100 150 200 250 300 m g N /L alpha-amino N 35 45 55 65 75 85 m g N /L Glucose 600 700 800 900 1000 m g /L
Figure 2: Individual plasma profiles of GH from blood sampled during 24h periods, at the beginning, in the middle and at the end of the fattening period (CG), in the middle of the low growth period lasting for 4, 8 or 14 mo and at the beginning and the end of the subsequent fattening period (G2, G3, G4) in Belgian Blue bulls double muscled.
0 10 20 30 40 50 60 70 80 90 n g /m l CG 0 10 20 30 40 50 60 70 80 90 n g /m l G2 0 10 20 30 40 50 60 70 80 90 n g /m l G3 0 10 20 30 40 50 60 70 80 90 n g /m l G4 24 h profiles
Figure 3: Modeled profile of insulin secretion during a 24h period in fattening bulls or in bulls maintained at low growth rate for periods lasting 4, 8 or 14 mo. Arrows indicate feeding time. The bar indicates the standard error of the mean.
0 5 10 15 20 6 7 8 9 10 11 12 13 14 15 16 17 18 19 20 21 22 23 24 1 2 3 4 5 6 Hours m U /L
Figure 4: Modeled profile of daily concentration of T3, T4, and IGF-1 during fattening (CG) or during low growth periods lasting for 4, 8, or 14 mo before a fattening period (G2, G3, G4) in Belgian Blue bulls double muscled. Arrows indicate the beginning of the fattening period. The bars indicate the standard error of the mean.
T3 0 1 2 n m o l/ m L T4 30 40 50 60 70 n m o l/ m L IGF-1 0 100 200 300 400 0 100 200 300 400 500 600 Days n g /m L CG G2 G3 G4