E
ffects of porosity on emergent synthetic spectra of
massive stars in the X-ray domain
Anthony Herv´e and Gregor Rauw
GAPHE, AGO, Universit´e de Li`ege, All´ee du 6 Aoˆut 17, Bˆat. B5c, 4000 Li`ege, Belgium
Abstract: Massive stars possess powerful stellar winds. Studies over the last decade, including the analyses of X-ray emission-line profiles, revealed the importance of wind fragmentation and clumping and led to a downwards revision of the mass-loss rates. We present the first results of our code that allows to compare two models of wind fragmentation, and their consequences on the emergent X-ray spectra of massive stars.
1
Introduction
The concept of fragmentation of stellar winds is now widely admitted (Eversberg, L´epine & Moffat 1998, Bouret et al. 2005). Different formalisms exist to describe the absorption of X-rays by frag-mented winds. We have developed a code to simulate X-ray spectra in order to compare the porosity formalism involving spherical clumps (Owocki & Cohen 2006) with the fragmentation frequency theory where the clumps are oblate (Oskinova et al. 2006) and allowing for any clump optical depth in both cases. In this contribution, we present a brief overview of some of our results. More details will be given in a forthcoming paper (Herv´e et al. 2011, submitted). After a brief description of our method, we show the impact of anisotropy on line profiles and, finally, we explore the impact of a presence of a tenuous interclump medium.
2
Physics and geometry of the model
We adopt the ATOMDB1 model for the X-ray emissivity as a function of plasma temperature and composition. For the absorption by clumped stellar winds, we compare two different formalisms. We consider the X-ray emitting plasma, defined by an inner and outer radius to be embedded in the wind and moving outwards along with the latter. We discretize the plasma into small cells and analyse the absorption of the photons by the wind along the direction towards the observer. We assume that the wind is homogeneous close to the star and becomes fully fragmented due to the hydrodynamical instabilities at around 1.5 R∗. Optionally, we can add a tenuous smooth interclump medium. Finally
we sum up the emission of all the cells accounting for their Doppler shift due to the line-of-sight velocity of the emitting matter as well as for their absorption by the cool wind material (see Sect. 2.1 and 2.2) and we construct the synthetic X-ray spectrum (Herv´e et al. 2011).
κe f f =
mc
= τ
c
(1) with τc = κhρilf and where l is the size of the clump, mc its mass, hρi the mean density of the stellar
wind, f the volume filling factor, and κ the mass absorption coefficient.
The generalisation of the effective opacity accounting for the optically thin and thick limit and the hypothesis that the effective clump absorption in the optically thick limit is given by the geometric cross section lead to a simplified scaled effective opacity:
κe f f
κ = 1 1+ τc
(2) Using this result in a steady state (i.e. non variable) wind, Owocki & Cohen (2006) obtain the wind optical depth: τ(p, z) = τ∗ Z ∞ z R∗dz0 r0(r0− R ∗)+ τ∗h(r0) (3) where r0 = pp2+ z02, τ ∗≡ 4πvκ ˙M
∞R∗ is a typical measure of the optical depth of the wind, ˙Mis the mass
loss rate, v∞is the terminal velocity of the wind, R∗is the radius of the star and h(r0) ≡ lf the so-called
porosity length (Owocki & Cohen 2006). In the following we adopt h(r0)= h × r0.
2.2
Fragmentation frequency formalism
Alternatively, we now assume that the wind consists of an ensemble of flattened broken-shell-like fragments. Let us consider a flattened fragment of the wind at reference radius r. Its optical depth along the line of sight can be written:
τj = τrad j |µj| = κνM˙ 4π 1 r2 1 n0 1 |µj| (4) with κν the mass absorption coefficient at the frequency ν, τradj the average radial optical depth of a
fragment located at distance r and µ(r) = √z
z2+p2 its orientation (Oskinova et al. 2004). The number
n0 corresponds to the number of fragments passing through some reference radius and is also called
the fragmentation frequency. In the case of an isotropic opacity (i.e. spherically symmetric clumps), as for instance in the Owocki & Cohen (2006) formalism, µ is taken equal to unity (i.e. the line of sight crosses each clump along a radial direction). Generalising the opacity of a flattened fragment to all the clumps of the wind, the wind opacity can be written in the general case for the non-spherical fragments as: τ(p, z) = n0 Z zmax z (1 − e−τj)|µ(r0)| dz 0 v(r0) (5)
(see Oskinova et al. 2004), where v(r) is the velocity at radial position r, which is described by a so-called β-law, v(r)= v∞(1 − Rr∗)β with β= 1.
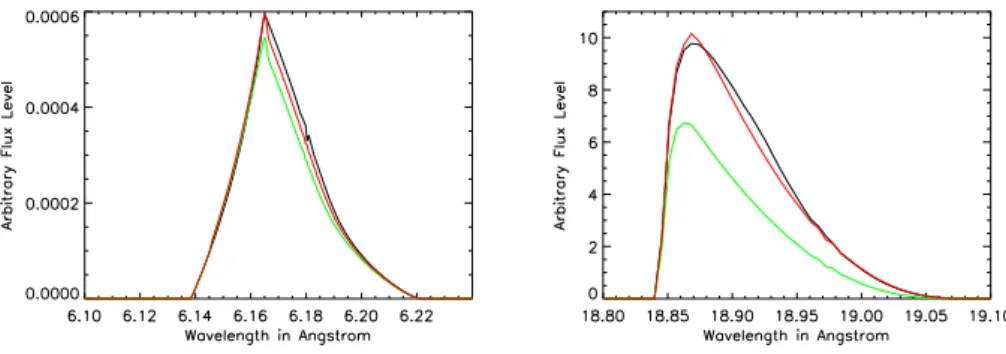
Figure 1: Impact of porosity (h = 0.07 in red) on the profiles of two representative X-ray lines, (see Table 1 & 2). The profiles are compared with those computed in the fragmentation formalism for n0 = 1.7 × 10⁻⁴s−1(in black) and for a homogeneous wind model (in green).
Table 1: Lines considered in this study and associated wind opacity corresponding to the model parameters listed in Table 2.
Line Wavelength (Å) τ∗
Si 6.18 1.8
O 18.97 21.89
Table 2: Stellar and wind parameters used in our model corresponding to the wind parameters of ζPup as in Oskinova et al. (2006)
R∗ Rinner Router v∞ M˙ n0 kT
18.6 R 1.5 R∗ 10 R∗ 2250 km s−1 4.2 × 10⁻⁶M yr−1 1.7 × 10⁻⁴s−1 0.287 keV
3
Results
To begin, we present the differences between the two formalisms by comparing single X-ray lines with different τ∗in the case of an isotropic opacity (µ = 1 in the fragmentation frequency theory, see
Fig.1). As can be seen on Fig. 1, in the case of isotropic fragments, it is possible to find a value of h that yields line profiles that match those for a given value of n0 rather well, although the value of h
is not constant over the entire spectrum, but rather depends on wavelength, especially if we consider lines from a wider wavelength range than illustrated in Fig. 1 (see Herv´e et al. 2011). Next, we show the impact of the anisotropy of opacity in the case of flattened clumps (µ , 1) on the line profiles (Fig. 2). As can be seen from this example, assuming flattened fragments leads to a lower effective wind opacity and hence a less depressed red shoulder of the X-ray line profiles. We then present the impact of porosity on emergent flux spectra (Fig. 3). Finally, we explore the impact of a tenuous interclump medium on the line profiles (Fig. 4) and global spectra (Fig. 5). More details will be given in a forthcoming paper (Herv´e et al. 2011, submitted).
4
Conclusions
In general, the observable flux of X-rays is higher in a fragmented stellar wind than in an homoge-neous one. An anisotropic opacity further reduces the absorption by the stellar wind compared to an isotropic one. The profiles of X-ray lines are also modified compared with an homogeneous model. We can find a porosity length to reproduce the X-ray profile simulated in the fragmentation frequency
Figure 2: Impact of the anisotropy of the opacity (in black) (fragmented shells seen under a direction cosine µ) on the emergent line profile for two representative X-ray lines lines, (see Table 1 & 2), compared with the line profiles computed for an isotropic opacity (µ = 1; in red) with n0 = 1.7 ×
10−4s−1.
Figure 3: Effect of porosity on the global spectrum. In red, the results for a homogeneous wind, in green, blue and black the spectra for different porosity lengths (0.01, 0.05 and 0.15 respectively).
Figure 4: Impact of the presence of an interclump medium. The black line profiles correspond to a fully porous wind (with h = 0.10), whilst the red profiles yield the results for a fully homogeneous wind. The blue, yellow and green profiles display the situation for three different mixed models with respectively 97%, 95% and 90% of the wind material in clumps.
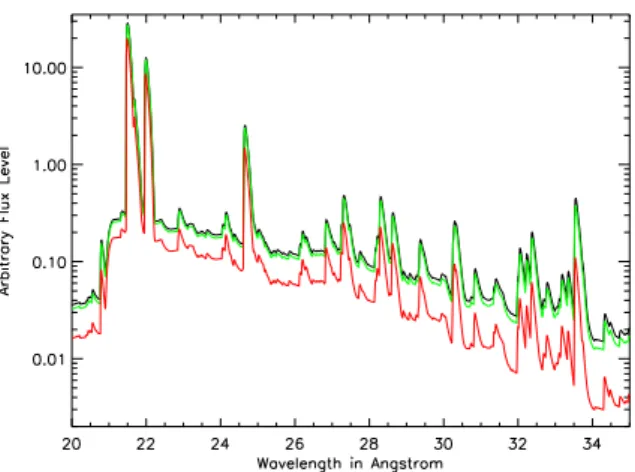
Figure 5: Impact of the presence of an interclump medium on the spectrum between 20 and 35 Å. The black line profiles correspond to a fully porous wind (with h= 0.10), whilst the red profiles yield the results for a fully homogeneous wind. The green spectrum displays the situation for a mixed model with 90% of the wind material in clumps.
formalism in the case of an isotropic opacity. However, in general, the porosity length parameter needed to match the profiles computed for a given value of n0varies with wavelength. The strongest
impact on the global X-ray spectra is expected in the low energy band where the stellar wind opac-ity is the largest (see Figs. 3 and 5). A mixed model (clumps with a tenuous interclump medium) has a lower emerging X-ray flux than a totally clumped model with the same porosity length, but is equivalent to a less porous model.
Acknowledgements
This research is supported by the FNRS (Belgium) and by the Communaut´e Franc¸aise de Belgique -Action de recherche concert´ee (ARC) - Acad´emie Wallonie–Europe and XMM+INTEGRAL PRODEX contracts.
References
Bouret, J.-C., Lanz, T., & Hillier, D.J. 2005, A&A 438, 301 Eversberg, T., L´epine, S., & Moffat, A.F.J. 1998, ApJ 494, 799 Herv´e, A., Rauw, G., Forster, A., & Naz´e,Y. 2011, A&A submitted Oskinova, L.M., Feldmeier, A., & Hamann, W.-R. 2006, MNRAS 372, 313 Oskinova, L.M., Feldmeier, A., & Hamann, W.-R. 2004, A&A 422, 675 Owocki, S.P., & Cohen, D.H. 2006, ApJ 648, 565