1
The physics of single-side fluorination of graphene: DFT and DFT+U studies
F Marsusi1*, N D Drummond2, M J Verstraete3
1Department of Energy Engineering and Physics, Amirkabir University of Technology, PO Box 15875-4413, Tehran, Iran
2Department of Physics, Lancaster University, Lancaster LA1 4YB, United Kingdom E-mail: [email protected]
3nanomat/QMAT/CESAM and European Theoretical Spectroscopy Facility, Université de Liège, B-4000 Sart Tilman, Belgium E-mail: [email protected]
We present density functional theory (DFT) calculations of the electronic and magnetic properties of fluorine adatoms on a single side of a graphene monolayer. By extrapolating the results, the binding energy of a single fluorine adatom on graphene in the dilute limit is calculated. Results confirm that the finite-size error in the binding energy scales inversely with the cube of the linear size of the simulation cell. We establish relationships between stability and C–F bond nature, diffusion of fluorine adatoms and total magnetization in different configurations of adatoms. For single-side fluorination, sp2.33 is the maximum p-content re-hybridization found in the C–F bond. We show that semilocal DFT cannot predict correctly the magnetic properties of FG and a higher level theory, such as DFT+U is needed. The results indicate a tendency of graphene to reduce the imbalance between adsorption on the two sublattices, and therefore total magnetization, through low-energy-barrier pathways on a time scale of ~10 ps at room temperature. The thermodynamically favored arrangements are those with the smallest total magnetization. Indeed, the electronic structure is intimately related to the magnetic properties and changes from semi-metallic to p-type half-semi-metallic or semiconducting features, depending on the adatoms arrangement.
1. Introduction
1*
2
Functionalizing graphene with adatoms and admolecules is of significant interest in developing graphene-based electronics [1-2]. Doping can strongly perturb the electronic structure, leading to the formation of mid-gap states in semiconductors and the extreme modification of the optoelectronic and transport properties of graphene, which may be tuned through the type and concentration of dopant atoms. Electron or hole doping is achieved through charge-transfer and interaction with electron-donor molecules such as aniline and tetrathiafulvalene (n-type doping) and electron-acceptor molecules such as nitrobenzene, tetracyanoethylene, chlorosulfonic acid (p-type doping). These change the electronic structure and vibrational properties of graphene, as characterized by Raman shifts of the peak and width of the G band [3-6]. N-type graphene was also obtained by depositing CdSe quantum dots on the graphene surface [7]. Graphene doped substitutionally with boron and nitrogen displays p- and n-type electronic properties, respectively [8-9]. On the other hand, halogen atoms (F, Cl, Br and I), which have high electronegativity, are good candidates as external (as opposed to substitutional) dopants. The strength of carbon-halogen bonds decreases from fluorine to iodine, and the bond length increases. It is found that triiodide (I3−) and pentaiodide (I
5−) are able to tune the electronic behavior of graphene from semi-metallic
to p-type metallic with increasing concentration [10-12]. Within the framework of the density functional theory, Tran et al. [13] have investigated the structure and electronic properties of halogenated graphene and found great differences between fluorine and other halogens: strong hybridization of C and F atoms leads to a buckled structure and significant change in π-bonding, and a distortion of the Dirac cone [13], while other halogen adatoms bind to C only through the pz orbitals. Therefore, the planarity, Dirac cone and π-bonding are not destroyed by other halogen adatoms, which simply produce p-type metals [13]. Compared to other graphene derivatives, fluorinated graphene (FG) exhibits outstanding thermal and electronic properties [14]. The thermal stability of FG is even higher than that of pristine graphene [15]. The binding energy of fluorine on graphene is significantly larger than that of many other adatoms [16-17]. While this is essential as a measure of the stability of FG, many physical properties depend on the geometry and arrangement of multiple fluorine adatoms. Experimentally, there are two main methods to produce fluorographene [14]. In one method the fluorographene can be prepared by fluorinating existing graphene from one or both sides. In this approach, graphene is exposed to atomic F formed by decomposition of an appropriate fluorinating agent like as XeF2, CF4 or SF6 [15, 18, 19]. The degree of fluorinations is monitored by the Raman spectra. For fully FG all Raman features of
3
pristine graphene disappear [15], which indicates significant changes are induced by fluorination. In the second method, FG is prepared by chemical or mechanical exfoliation of graphite fluoride [14, 20]. Synthesizing FG from the first approach is easier than extracting individual monolayers by mechanical exfoliation of graphite fluoride [15]. In addition to the two main approaches above, the successful selective patterning of single-sided FG (C4F) was reported [21] by laser irradiating a fluoropolymer on graphene.
In this work, we present first-principles density functional theory (DFT) calculations to investigate the stability of single-side adsorption of fluorine on a graphene monolayer, against desorption or repulsion of adatoms. The single-side fluorination model can help us to understand the underlying physics of FG deposited on a substrate. As a first step, we inspect the stability of a single adatom on a graphene surface. To this end, we extrapolate our data to the infinitely dilute limit. Our leading finite-size error stems from the repulsive interactions between the image dipole moments along the C–F bonds, and varies as L-3, where L is the linear size of the supercell.
Next, to capture the relationships between stability and nature of C–F bonds, we perform calculations of the adsorption of fluorine adatoms, addimers, adtrimers and admolecules on a 5×5 supercell of graphene in different configurations. These models are representative of low coverage FG (CFx: x=nF/nC, 0.02, 0.04, 0.06, where nF and nC are the numbers of F adatoms and C atoms in the unit cell, respectively). The Stability of fluorine adatoms on graphene has often been studied through the binding and formation energies [16, 22-26]. In our discussion we will also consider the effect of partial negative charges on fluorine adatoms. These may destroy the stability of small clusters of fluorine adatoms, by increasing atomic repulsion. To our knowledge this has not been considered in previous investigations. To investigate this point, we introduce another stability criterion: the energy ΔUB required to separate two or more fluorine adatoms to an infinite distance from each other on the graphene surface. We find that, while a given configuration of adatoms may be stable based on its binding and formation energies, according to this new criterion, it may be unstable against repulsive interactions.
Quantum computational methods have frequently been employed to investigate the stability, electronic and vibrational properties of FG [14, 27, 28]. However, limited efforts have been devoted to a detailed investigation of the C–F bond nature at lower fluorine concentration. Here,
4
we use the π-orbital axis vector (POAV) analysis, as described in Refs [29] and [30]. We present a discussion based on the relationship between local defects around the C–F bond and the stability of the structure, then we examine how C–F chemical bonds behave at low density. Interestingly, POAV yields a central carbon rehybridization of sp2.33 for CF0.02 structure. This means the carbon atom is closer to sp3 hybridization than in a fullerene molecule, C60, with sp2.28 rehybridization under surface curvature [31-32]. In two-side fluorination, the covalency is almost fully sp3, but it increases less in single-sided highly FG.
The stability of FG is directly related to the total magnetic moment M. For single hydrogen adatom on a graphene 5×5 unit cell, DFT reports agree on M=1 µB [33-35], where µB is Bohr magnetic moment. However, different DFT values for the magnetic moment of a fluorine adatom are reported in the literature, and the results are functional dependent. DFT within the generalized gradient approximation (GGA) predicts a nonmagnetic structure for a lower concentration of fluorine adatoms on graphene [24, 36-38]. Conversely, hybrid functionals predict M=1 µB for the same concentration [39]. In this work, we apply DFT+U to resolve this discrepancy. In agreement with hybrid functionals, DFT+U shows that a single fluorine adatom induces a magnetic moment of M=1 µB on graphene, and the magnetic properties have a close relationship with the stability of the structure. We will show that since graphene favors keeping the balance between two sublattices, spins are arranged with the lowest possible total magnetic moment, via exchange interactions. This finding is in agreement with the experimental observation that the measured number of paramagnetic centers is three orders of magnitude less than the number of fluorine adatoms in FG samples [40]. We show that fluorine adatom shifts down the Fermi level of graphene into the valence cone. In addition, when adatom numbers and configurations destroy the balance between the two sublattices of graphene, spin up and down channels in the electronic structures are split. Therefore, semi-metallic graphene changes to a p-type half-metal in CF0.02, (intrinsic or p-type depending on the configuration) or a semiconductor in CF0.04 and CF0.06. The information presented in this work will allow the further investigations of the bond nature, total magnetization, and thermodynamics of the fluorination process.
5
The optimized geometries and binding energies of fluorine adatoms on graphene monolayers were obtained within the plane-wave pseudopotential DFT framework using the ABINIT code [41]. The cutoff energy on the plane-wave basis was set to 40 Ha. The PBE+U calculations were done within PAW spheres, while the convergence in PAW kinetic energy cutoff was found around 28 Ha. All atomic positions and in-plane lattice vectors were relaxed until the atomic forces were less than 6 meV/A°. A relatively large vacuum region of between 20-25 A° along the z-axis, was imposed to guarantee a vanishing interaction between the periodic images of the graphene layer.
To study the thermal stability of the F bonds to graphene, we performed molecular dynamics (MD) simulations using the LAMMPS program [42] and the reactive force-field ReaxFF [43], which can give a good description of bond breaking and bond formation during chemical reactions. The ReaxFF parameters for fluorographene were introduced in Refs. [44] and [45].
We then proceed to analyze the magnetic moment of each configuration in the PBE+U framework [46] within PAW spheres, as implemented in the Quantum Espresso (QE) code [47], which allows the application of the repulsive U in all space and not just in PAW spheres: this is more consistent for delocalized p orbitals in C or F. Norm-conserving Troullier-Martins pseudopotentials were used to represent the atomic cores [48]. Our criterion for the optimum value of parameter U is the minimal one that restores the system of a single adatom absorbed on graphene to the expected magnetic moment near to M=1 µB. The partial occupancy of states was evaluated after a careful convergence test, with a small value of 0.001 eV Gaussian smearing. After thorough scanning, we obtain the optimum value of U=2.5 eV.
For all DFT calculations we use the Perdew-Burke-Ernzerhof (PBE) [49] exchange-correlation functional. The binding energies of a single fluorine adatom were calculated in supercells of different size, to allow extrapolation of data to the infinite dilute limit. A 5×5×1 Monkhorst-Pack k-point mesh was used to sample the Brillouin zone [50]. A finer sampling for smaller supercells was used to ensure the same k-point density was employed in all cases.
To study the stability of different FG structures, we calculated the binding energy and formation energy of different configurations within a 5×5 supercell. The average binding energy per adatom is defined by 𝛥𝐸,= [𝐸 𝐺) + 𝑛2𝐸(𝐹 − 𝐸 𝐺 + 𝑛2𝐹 ]/ 𝑛2. Here E(G) and E(F) are
6
the total energies of the graphene and fluorine ground states, respectively. E(G+nF) is the ground-state total energy of the graphene with nF fluorine adatoms. The formation energy per adatom, 𝛥𝐸2, of FG relative to pristine graphene and the free F2 molecule is an additional quantity that we
use to characterize the stability of the configuration [22, 51]. 𝛥𝐸2 is defined by 𝐸 𝐺 +;<= 𝐸 𝐹= − 𝐸 𝐺 + 𝑛2𝐹 𝑛2, where E(F2) is the ground-state total energy of an isolated fluorine molecule.
We use another important stability criterion 𝛥𝑈,: the energy needed to separate fluorine adatoms to an infinite distance from each other on the graphene sheet, defined as 𝛥𝑈, = 𝐸 𝐺 + 𝑛2𝐸 𝐹 − 𝑛2𝛥𝐸,@ABCDE − 𝐸 𝐺 + 𝑛2𝐹 = 𝑛2 𝛥𝐸,− 𝛥𝐸,@ABCDE , where 𝛥𝐸,@ABCDE represents the binding energy of a single adatom on graphene. A negative value for 𝛥𝐸, or 𝛥𝐸2 indicates that the fluorine adatoms on graphene are energetically unbound and will tend to leave the graphene surface. On the other hand, a negative 𝛥𝑈,indicates that the cluster of adatoms on the graphene surface would prefer to dissociate into isolated adatoms.
We have further compared the binding energy of F2 admolecules on graphene in different configurations using 𝛥𝐸, = 𝐸 𝐺) + 𝐸(𝐹= − 𝐸 𝐺 + 𝐹= , where E(G+F2) represents the total energy of the admolecule on graphene. Van der Waals (vdW) interactions are required to describe the interaction between a molecule and a surface. Therefore, we apply the DFT-D2 nonlocal functional to modify the dispersion part of the PBE functional [52] in both relaxation and energy calculations including F2.
PBE activation energies for the diffusion of fluorine adatoms were calculated using the nudged elastic band (NEB) method [53], as implemented in the QE code. The numbers of successful thermally activated jumping processes per second is controlled by the energy barrier height 𝛥𝐸Ffrom one site to a neighboring site. Due to the relatively large size of the cell, the NEB calculations were limited to five intermediate images between the initial and final structures of the path. The jumping rate to overcome the barrier height 𝛥𝐸F is 𝛤 = 𝛤H𝑒𝑥𝑝 LMNO
PQR , where the 𝛤H is the ratio of the vibrational frequencies at the initial configuration to the frequencies at the saddle point. The parameters kB and T show the Boltzmann constant and temperature, respectively. All of our calculations were performed with spin-polarized wave functions unless otherwise stated.
7
3. Results and discussion
3.1 Binding energy of a single adatom in the infinitely dilute limit
We have tried several different positions to adsorb F on graphene, as shown in Fig. 1(b). Our results show that in a 3×3 supercell the top position is more stable than the center and bridge positions by 0.49 eV and 0.30 eV, respectively. The fluorine in the middle points will migrate spontaneously to the top position after relaxation. The top position, with a vertical C–F bond, with a covalent bond of sp3 hybridization, is energetically the most favorable position, as previously reported for structures with a higher fluorine concentration (C2F and C4F) [16, 54]. However, one should notice that at higher concentration the interactions between fluorine atoms lead to C–F bonds which are not perpendicular to the graphene plane. MD calculations using an NVT ensemble in a 7×7 graphene supercell with temperatures up to 400 K show that the fluorine atoms stay at the top position above a carbon atom even at high temperatures. The root-mean-square horizontal thermal fluctuations of the fluorine are less than 0.047 A°.
Before analyzing the parameters that affect the stability of FG, we extrapolate the binding energy of a fluorine adatom to the infinitely dilute limit. Computationally, the infinitely dilute limit can be described by a very large periodic supercell (L→∞, where L is the linear size of the cell) to avoid interactions between periodic images of the adatom. Such calculations can be extremely expensive for sizes beyond a few hundred atoms. Therefore, we estimate ΔEB by calculating the binding energy in a series of supercells with different sizes, and extrapolating the results to the infinite-size limit. We list in Table 1 the cell size and the spurious interactions between the periodic images (finite-size errors), which influence the binding energy. Our analysis shows that the interactions between periodic dipole moments induced by the fluorine adatom is the main origin of this error, and converges slowly with respect to system size, as seen in Table 1. Löwdin population analysis [55] confirms that the charge on F is mostly transferred from the central carbon atom beneath it, C(F): see Fig. 1(c). This causes the defect to have a nonzero electric dipole moment.
8
Fig. 1: (a): Different configurations for fluorine adatoms on a 5×5 supercell of graphene corresponding to CF0.02, CF0.04, and CF0.06. Adsorption sites of sublattices A and B are specified with red (A) and blue (B) circles, respectively. (b): Different possible positions are shown for a single adatom: top (T), bridge (B), middle (M), and center (C). (c): Representations of typical C(F) and C(NN) carbon atoms.
A AA AB1 AB2 AB3
AAA1 AAA2 AAA3 ABA1 ABA2
ABA3 Binding energy and nature of the orbitals in fluorinated graphene: a DFT study 3
Figure 1. (a) Single fluorine adatom on graphene. (b) Two fluorine adatoms (dimer) on graphene.
The cuto↵ energy on the plane-wave basis set was 40 Ha, and all atomic positions and in-plane lattice vectors were relaxed until the atomic forces were less than 6 meV/˚A. A vacuum region of about 19 ˚A along the z axis was imposed to guarantee a vanishing interaction between the periodically repeated images of the graphene layer. The binding energies of a single fluorine adatom and a pair of fluorine adatoms on graphene were calculated in supercells of di↵erent size, to allow extrapolation to the dilute limit. A 5⇥ 5 ⇥ 1 Monkhorst–Pack k-point mesh was used to sample the Brillouin zone [12] in the largest supercells, with a finer sampling for smaller supercells. Norm-conserving Troullier–Martins pseudopotentials were used to represent the atomic cores [13, 14]. All our calculations were performed with spin-polarised wave functions, unless otherwise stated.
3. Results and discussion
3.1. Optimised geometries and nature of the orbitals
The LDA- and PBE-optimised geometrical parameters of a single fluorine adatom and a pair of fluorine adatoms on di↵erent supercells of graphene are shown in tables 1, 2 and 3. The atomic structure models are illustrated in figure 1.
After full relaxation, a single fluorine adatom remains exactly on top of a carbon atom, as expected. However, the repulsive force between two fluorine adatoms on top of neighbouring carbon atoms makes them relocate from their initial positions, as shown in figure 1(b). The geometry around the fluorine adatom appears to be converged with respect to size in a 7⇥ 7 supercell. Let C(F) denote the carbon atom to which the fluorine adatom is bonded. In a single adatom on graphene, the C(F)–F bond length is predicted to be about 1.55 ˚A, which is larger than the typical C–F sp3 bond length
(about 1.37 ˚A), and is in good agreement with a previous PBE prediction [15]. Other geometric information, including the distance between C(F) and its nearest neighbours C(NN), is presented in tables 1, 2 and 3. As a consequence of the attractive interaction between the carbon and fluorine atoms, C(F) is pulled out of the plane by about 0.33 ˚A
A AA AB1 AB2 AB3
AAA1 AAA2 AAA3 ABA1 ABA2
ABA3 Binding energy and nature of the orbitals in fluorinated graphene: a DFT study 3
Figure 1. (a) Single fluorine adatom on graphene. (b) Two fluorine adatoms (dimer) on graphene.
The cuto↵ energy on the plane-wave basis set was 40 Ha, and all atomic positions and in-plane lattice vectors were relaxed until the atomic forces were less than 6 meV/˚A. A vacuum region of about 19 ˚A along the z axis was imposed to guarantee a vanishing interaction between the periodically repeated images of the graphene layer. The binding energies of a single fluorine adatom and a pair of fluorine adatoms on graphene were calculated in supercells of di↵erent size, to allow extrapolation to the dilute limit. A 5⇥ 5 ⇥ 1 Monkhorst–Pack k-point mesh was used to sample the Brillouin zone [12] in the largest supercells, with a finer sampling for smaller supercells. Norm-conserving Troullier–Martins pseudopotentials were used to represent the atomic cores [13, 14]. All our calculations were performed with spin-polarised wave functions, unless otherwise stated.
3. Results and discussion
3.1. Optimised geometries and nature of the orbitals
The LDA- and PBE-optimised geometrical parameters of a single fluorine adatom and a pair of fluorine adatoms on di↵erent supercells of graphene are shown in tables 1, 2 and 3. The atomic structure models are illustrated in figure 1.
After full relaxation, a single fluorine adatom remains exactly on top of a carbon atom, as expected. However, the repulsive force between two fluorine adatoms on top of neighbouring carbon atoms makes them relocate from their initial positions, as shown in figure 1(b). The geometry around the fluorine adatom appears to be converged with respect to size in a 7⇥ 7 supercell. Let C(F) denote the carbon atom to which the fluorine adatom is bonded. In a single adatom on graphene, the C(F)–F bond length is predicted to be about 1.55 ˚A, which is larger than the typical C–F sp3bond length
(about 1.37 ˚A), and is in good agreement with a previous PBE prediction [15]. Other geometric information, including the distance between C(F) and its nearest neighbours C(NN), is presented in tables 1, 2 and 3. As a consequence of the attractive interaction between the carbon and fluorine atoms, C(F) is pulled out of the plane by about 0.33 ˚A
A AA AB1 AB2 AB3
AAA1 AAA2 AAA3 ABA1 ABA2
ABA3 Binding energy and nature of the orbitals in fluorinated graphene: a DFT study 3
Figure 1. (a) Single fluorine adatom on graphene. (b) Two fluorine adatoms (dimer) on graphene.
The cuto↵ energy on the plane-wave basis set was 40 Ha, and all atomic positions and in-plane lattice vectors were relaxed until the atomic forces were less than 6 meV/˚A. A vacuum region of about 19 ˚A along the z axis was imposed to guarantee a vanishing interaction between the periodically repeated images of the graphene layer. The binding energies of a single fluorine adatom and a pair of fluorine adatoms on graphene were calculated in supercells of di↵erent size, to allow extrapolation to the dilute limit. A 5⇥ 5 ⇥ 1 Monkhorst–Pack k-point mesh was used to sample the Brillouin zone [12] in the largest supercells, with a finer sampling for smaller supercells. Norm-conserving Troullier–Martins pseudopotentials were used to represent the atomic cores [13, 14]. All our calculations were performed with spin-polarised wave functions, unless otherwise stated.
3. Results and discussion
3.1. Optimised geometries and nature of the orbitals
The LDA- and PBE-optimised geometrical parameters of a single fluorine adatom and a pair of fluorine adatoms on di↵erent supercells of graphene are shown in tables 1, 2 and 3. The atomic structure models are illustrated in figure 1.
After full relaxation, a single fluorine adatom remains exactly on top of a carbon atom, as expected. However, the repulsive force between two fluorine adatoms on top of neighbouring carbon atoms makes them relocate from their initial positions, as shown in figure 1(b). The geometry around the fluorine adatom appears to be converged with respect to size in a 7⇥ 7 supercell. Let C(F) denote the carbon atom to which the fluorine adatom is bonded. In a single adatom on graphene, the C(F)–F bond length is predicted to be about 1.55 ˚A, which is larger than the typical C–F sp3 bond length
(about 1.37 ˚A), and is in good agreement with a previous PBE prediction [15]. Other geometric information, including the distance between C(F) and its nearest neighbours C(NN), is presented in tables 1, 2 and 3. As a consequence of the attractive interaction between the carbon and fluorine atoms, C(F) is pulled out of the plane by about 0.33 ˚A
A AA AB1 AB2 AB3
AAA1 AAA2 AAA3 ABA1 ABA2
ABA3 Binding energy and nature of the orbitals in fluorinated graphene: a DFT study 3
Figure 1. (a) Single fluorine adatom on graphene. (b) Two fluorine adatoms (dimer) on graphene.
The cuto↵ energy on the plane-wave basis set was 40 Ha, and all atomic positions and in-plane lattice vectors were relaxed until the atomic forces were less than 6 meV/˚A. A vacuum region of about 19 ˚A along the z axis was imposed to guarantee a vanishing interaction between the periodically repeated images of the graphene layer. The binding energies of a single fluorine adatom and a pair of fluorine adatoms on graphene were calculated in supercells of di↵erent size, to allow extrapolation to the dilute limit. A 5⇥ 5 ⇥ 1 Monkhorst–Pack k-point mesh was used to sample the Brillouin zone [12] in the largest supercells, with a finer sampling for smaller supercells. Norm-conserving Troullier–Martins pseudopotentials were used to represent the atomic cores [13, 14]. All our calculations were performed with spin-polarised wave functions, unless otherwise stated.
3. Results and discussion
3.1. Optimised geometries and nature of the orbitals
The LDA- and PBE-optimised geometrical parameters of a single fluorine adatom and a pair of fluorine adatoms on di↵erent supercells of graphene are shown in tables 1, 2 and 3. The atomic structure models are illustrated in figure 1.
After full relaxation, a single fluorine adatom remains exactly on top of a carbon atom, as expected. However, the repulsive force between two fluorine adatoms on top of neighbouring carbon atoms makes them relocate from their initial positions, as shown in figure 1(b). The geometry around the fluorine adatom appears to be converged with respect to size in a 7⇥ 7 supercell. Let C(F) denote the carbon atom to which the fluorine adatom is bonded. In a single adatom on graphene, the C(F)–F bond length is predicted to be about 1.55 ˚A, which is larger than the typical C–F sp3bond length
(about 1.37 ˚A), and is in good agreement with a previous PBE prediction [15]. Other geometric information, including the distance between C(F) and its nearest neighbours C(NN), is presented in tables 1, 2 and 3. As a consequence of the attractive interaction between the carbon and fluorine atoms, C(F) is pulled out of the plane by about 0.33 ˚A
(a)
Fig. 1: Different configurations of fluorine adatom positions on a 5´5 unit cell of graphene
corresponding to CF0.02, CF0.04, CF0.06. Adsorption sites of sublattices A and B are specified with
red (A) and blue (B) circles, respectively. Different possible positions are shown for a single adatom adatom: top (T), bridge (B), middle (M), center (C). Representation of a typical C(F) and C(NN) carbon atoms.
A AA AB1 AB2 AB3
AAA1 AAA2 AAA3 ABA1 ABA2
ABA3
Formatted: Font:(Default) +Theme Headings CS (Times
New Roman), Font color: Text 1, Complex Script Font: +Theme Headings CS (Times New Roman)
9 Supercell ΔEB (eV) C(F)z (A°) C(NN)z (A°) C(F)z-C(NN)z (A°) dC-F (A°) 3×3 1.87 0.33 0.015 0.32 1.55 4×4 1.93 0.40 0.08 0.32 1.55 6×6 1.94 0.48 0.14 0.32 1.56
Table 1. PBE predicted binding energy per adatom (ΔEB). C(F)z and C(NN)z show the vertical displacement of the carbon atom C(F) to which the fluorine adatom is bonded and the nearest-neighbour carbon atoms C(NN) bonded to C(F), respectively after adatom adsorption from the initial graphene plane at z=0. C(F)z-C(NN)z is the vertical displacement of C(F) relative to the vertical displacement of its nearest neighbor C(NN). dC-F is the C(F)–F bond length for a single fluorine adatom adsorbed on graphene. All energies are in eV and distances in A°.
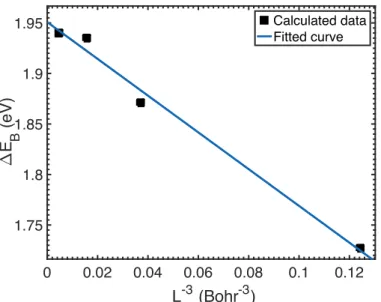
If one models the graphene layer crudely as a perfect metal, then the interaction between fluorine adatoms (including the response of the graphene layer) can be calculated by the method of images. In this model, an isolated fluorine adatom above the free-standing graphene layer with a partial charge qF is replaced by a charge qF above the graphene layer and an image charge -qF on equal distance below the layer. This then gives an unscreened Coulomb dipole-dipole repulsion between fluorine adatoms at long range (but with the dipole moment being twice the naive value). The corresponding electrostatic energy of a 2D lattice of identical dipole moments is positive and falls off as L-3 [56]. We investigated different finite-size extrapolation formulas and found the best-fit function, which gives the smallest root-mean-square error of 0.02 eV, reads as 𝛥𝐸, 𝐿 = 𝛥𝐸, ∞ + 𝑐𝐿L` with c = -1.82 eV Bohr3: see Fig. 2. Note that the positive error stemming from repulsive dipole-dipole contribution to the total energy, E(G+F), results in “c” being negative for the binding energy. Finally, the finite-size-corrected binding energy of a single fluorine adatom on a graphene surface is predicted to be 1.95 eV by the PBE functional.
10
Fig. 2. (Color online) PBE binding energy of a single fluorine adatom on an m×m (m = 2, 3, 4 and 6) periodic supercell of graphene (black squares). The binding energy is extrapolated to the dilute limit of infinite cell size (L→∞). The fitted parameter values are ΔEB(∞) = 1.95 eV and c = -1.82 eV.Bohr3, with the root-mean-square error being 0.02 eV.
3.2 Stability and nature of C–F bonds.
To reveal the underlying physics of adsorption of fluorine atoms on graphene, we have studied the stabilities of the different configurations shown in Fig. 1(a). Results from this work and Refs. [16] and [22] are listed in Table 2 and display a correlated relationship between the stability and C–F bond nature. To understand this connection, we start with the adsorption of a single adatom on a 5×5 supercell of graphene monolayer which mimics the low concentration CF0.02.
Within PBE-PAW, the 𝛥𝐸, and 𝛥𝐸2 of CF0.02 are predicted to be 1.85 eV and 0.65 eV, respectively, much higher than room temperature (∼26 meV). When compared with the same coverage of hydrogen adsorption on graphene, a clear distinction is observed. We obtain a negative formation energy of -0.95 eV for a single hydrogen adatom on graphene. The formation energy is a measure of stability against molecular desorption from the graphene surface. Therefore, in contrast to FG, hydrogenated graphene may readily dissociate into graphene and H2 molecules. This distinctive behavior is the result of the substantial difference in the F–F and H–H bond energies. The experimental F–F bond energy (1.61 eV) is considerably smaller than the C–F bond energy (5.03 eV); in contrast, the H–H bond energy (4.48 eV) is larger than the value for C–H (4.26 eV) [57]. 0 0.02 0.04 0.06 0.08 0.1 0.12 L-3 (Bohr-3) 1.75 1.8 1.85 1.9 1.95 " E B (eV) Calculated data Fitted curve
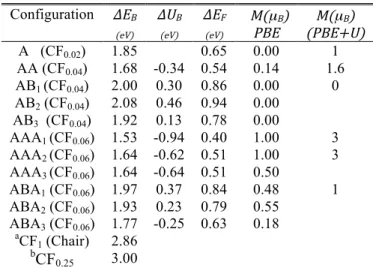
11 Configuration ΔEB (eV) ΔUB (eV) ΔEF (eV) M(µB) PBE (PBE+U)M(µB) A (CF0.02) 1.85 0.65 0.00 1 AA (CF0.04) 1.68 -0.34 0.54 0.14 1.6 AB1 (CF0.04) 2.00 0.30 0.86 0.00 0 AB2 (CF0.04) 2.08 0.46 0.94 0.00 AB3 (CF0.04) 1.92 0.13 0.78 0.00 AAA1 (CF0.06) 1.53 -0.94 0.40 1.00 3 AAA2 (CF0.06) 1.64 -0.62 0.51 1.00 3 AAA3 (CF0.06) 1.64 -0.64 0.51 0.50 ABA1 (CF0.06) 1.97 0.37 0.84 0.48 1 ABA2 (CF0.06) 1.93 0.23 0.79 0.55 ABA3 (CF0.06) 1.77 -0.25 0.63 0.18 aCF 1 (Chair) 2.86 bCF 0.25 3.00
Table 2. PBE-PAW predicted binding energy per adatom (ΔEB), formation energy (ΔEF) and ΔUB. The Calculated total magnetic moment M within PBE-PAW and PBE+U (for some configurations) are shown in µB. a Data are taken from Ref. [22]. b Data are taken from Ref. [16].
Significant electronegativity differences between carbon and fluorine atoms lead to an ionic character for the C–F bond. Two parameters determine the degree of ionic character in the C–F bond: (i) the amount of charge transferred from graphene to fluorine and (ii) the local distortion about C(F) on graphene, which the corresponding parameters are introduced in Table 3. Löwdin analysis results show a significant charge of about -0.38 |e|, which is transferred mostly to the fluorine pz orbital, accompanied by a charge depletion of +0.27 |e|, mainly on the pz orbital of the C(F) atom. In addition, C(F) puckers out of the plane by about 0.46 A° and forms a local geometrical defect. A fully ionic bond would not disturb the planarity of graphene, since it involves predominantly the pz orbital of C(F) atom, which is perpendicular to the graphene plane [58].
Hence, the calculated 0.46 A° puckering of C(F) atom out of the plane is a sign of a (partly) covalent bond. Graphene has a strong sp2 network, and a strong oxidant like fluorine is needed to bond to it [58], leaving carbon in a new hybrid state. The calculated ∠C(NN)C(F)F and ∠C(NN)C(F)C(NN) angles (θCCF and θCCC) are 102.51º and 115.45º, respectively, meaning hybridization falls between sp2 and sp3. The C–F bond length is 1.57 A° smaller than a typical ionic C–F bond length of 3 A°, and larger than the typical covalent C–F bond length of 1.43 Å [59].
Likewise, the three C(NN)–C(F) σ-bond lengths are 1.47 A°, larger than the corresponding values of sp2 bonds in graphene (1.42 A°), however smaller than sp3 bond lengths in diamond (1.54 Å). We have performed MD calculations to study the effect of temperature on the C–F bond length.
12
The mean value of the C–F bond length predicted by MD calculations increases slightly from 1.48 A° at T=0 K to 1.50 A° at T=300 K.
Now we inspect the degree of p content in σ-orbitals by performing a POAV analysis, based on the orthogonality relationships between hybrid orbitals and the geometry of σ-bonds. From the mean values of the three θCCF angles, POAV1 predicts sp2.33hybridizations for the C–F bond, which proves a semi-ionic character. At the same time, POAV2 predicts a deviation from sp2 into sp2.33hybridization for the three σ-bonds between the C(F) central atom pointing towards the three carbon nearest neighbors [C(NN)]. The binding energy of 1.85 eV is relatively close to typical values for a semi-ionic C–F bond strength (2.08-2.38 eV). The typical covalent and ionic C–F bond strengths are 2.67-2.88 eV and 1.08-1.56 eV, respectively [59]. Here it is noteworthy to compare these results with the bond nature of carbon in the most stable two-sided chair configuration of FG. We applied POAV analysis to the geometry parameters of the CF1 chair configuration, reported in Ref. [22] with a binding energy of 2.86 eV. Our results show the highly dominant covalent character of C–F bonds with sp2.82 hybridization of carbon atoms corresponding to 108.1º tetrahedral θCCF angles and geometrical modification of the hexagonal θCCC angles from 120º to 110.8º.
Next, we consider adsorption of two adatoms on a 5×5 supercell, which models CF0.04. With two adatoms, different configurations are possible. Here we discuss the configurations shown in Fig. 1(a). First, we try a second adsorption on the next nearest neighbor site. We name this configuration AA, since the first and second adatoms are bonded to carbon atoms belonging to the same sublattice. The data in Table 3 show a slightly larger covalent nature for C–F bonds, along with a smaller charge on fluorine, compared to adsorption of a single adatom. The mean values of θCCF and θCCC about each central carbon are slightly closer to the characteristic value of sp3 hybridization. In spite of the increasingly covalent nature, both the binding and formation energies are reduced, due to the repulsive interaction of the two fluorine atoms. Both energies are still positive and the system will not desorb the F atoms. However, we note that the negative charge on the two fluorine atoms may destroy the stability of the structure. We quantify the role of the repulsive interaction by calculating ∆UB, as described in Section 2, yielding a negative value of -0.34 eV; see Table 2. This indicates the AA configuration is not stable with respect to the repulsive interaction. Instead, when the second adatom adsorbs on the nearest neighbor site, belonging to
13
the opposite sublattice (AB1 arrangement in Fig.1(a)), all stability criteria are positive and the system is fully stable. Changing the position of the second adatom to the AB2 and AB3 configurations shown in Fig. 1(a), we have checked that all of these combinations are stable. Therefore, the stability depends on the symmetry of two adsorption sites. In the next section, we will see that the imbalanced binding of adatoms on the two graphene sublattices causes the unpaired electrons of the broken bonds to move across the graphene surface. Also, an imbalance between the two sublattices of graphene decreases the stability of the structure, since the number of broken π-bonds in the graphenenetwork is equal to the number of defects minus the number of paired sites. As an example, in the AA and AB configurations two (2-0) and one (2-1) conjugated bonds are broken, respectively, making AB the more stable configuration. The absence of unpaired electrons in the AB arrangement makes the charge transfer to fluorine smaller, compared to the AA configuration. Therefore, the C–F bonds in all of the AB configurations show less ionic character and more pz-content hybridization (sp2.38-sp2.42). The stability also depends on the position of the adatoms in an AB arrangement. Since the adatoms are further from each other, the geometrical distortion around the central carbon is smaller in the AB3 configuration, leading to less covalent nature for C–F bonds, and a smaller binding energy, compared to AB1 and AB2. The two fluorine adatoms have a smaller separation in the AB1 configuration than in the AB2 configuration. The larger repulsive interaction does not allow each fluorine atom in the AB1 configuration to attract more charges than 0.28 |e|. Because the adatoms are further from each other, in spite of attracting more significant charge, AB2 is a more stable configuration than AB1 and experiences a smaller repulsive energy, while the orientation of the C–F bonds is closer to the geometry of sp3 structure. Table 3 reveals that changing the hybridization of C–F results in C(F) puckering out of the graphene plane, and induces a local distortion about the C(F) in the σ-bond network. Therefore, the C–C bond length increases from 1.42 Å in pristine graphene towards 1.54 A° in sp3 diamond. In the case of AB1, F–F repulsive interactions increase this phenomenon. The F–F distance, even in AB1, is much larger than the 1.42 Å interatomic bond length in F2: the fluorine atoms prefer to bind covalently to carbon, instead of to nearby negatively charged fluorine atoms.
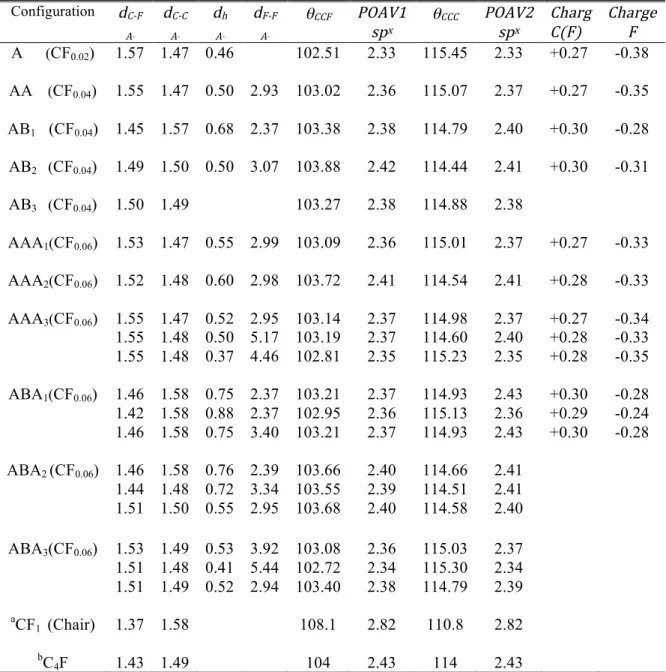
14 Configuration dC-F A° dC-C A° dh A° dF-F A° θCCF POAV1 spx θCCC POAV2 spx Charg C(F) ChargeF A (CF0.02) 1.57 1.47 0.46 102.51 2.33 115.45 2.33 +0.27 -0.38 AA (CF0.04) 1.55 1.47 0.50 2.93 103.02 2.36 115.07 2.37 +0.27 -0.35 AB1 (CF0.04) 1.45 1.57 0.68 2.37 103.38 2.38 114.79 2.40 +0.30 -0.28 AB2 (CF0.04) 1.49 1.50 0.50 3.07 103.88 2.42 114.44 2.41 +0.30 -0.31 AB3 (CF0.04) 1.50 1.49 103.27 2.38 114.88 2.38 AAA1(CF0.06) 1.53 1.47 0.55 2.99 103.09 2.36 115.01 2.37 +0.27 -0.33 AAA2(CF0.06) 1.52 1.48 0.60 2.98 103.72 2.41 114.54 2.41 +0.28 -0.33 AAA3(CF0.06) 1.55 1.55 1.55 1.47 1.48 1.48 0.52 0.50 0.37 2.95 5.17 4.46 103.14 103.19 102.81 2.37 2.37 2.35 114.98 114.60 115.23 2.37 2.40 2.35 +0.27 +0.28 +0.28 -0.34 -0.33 -0.35 ABA1(CF0.06) 1.46 1.42 1.46 1.58 1.58 1.58 0.75 0.88 0.75 2.37 2.37 3.40 103.21 102.95 103.21 2.37 2.36 2.37 114.93 115.13 114.93 2.43 2.36 2.43 +0.30 +0.29 +0.30 -0.28 -0.24 -0.28 ABA2 (CF0.06) 1.46 1.44 1.51 1.58 1.48 1.50 0.76 0.72 0.55 2.39 3.34 2.95 103.66 103.55 103.68 2.40 2.39 2.40 114.66 114.51 114.58 2.41 2.41 2.40 ABA3(CF0.06) 1.53 1.51 1.51 1.49 1.48 1.49 0.53 0.41 0.52 3.92 5.44 2.94 103.08 102.72 103.40 2.36 2.34 2.38 115.03 115.30 114.79 2.37 2.34 2.39 aCF 1 (Chair) 1.37 1.58 108.1 2.82 110.8 2.82 bC 4F 1.43 1.49 104 2.43 114 2.43
Table 3. PBE-PAW predicted C(F)–F (dC-F) and C(F)–C(NN) bond lengths (dC-C), puckering distance of C(F) atoms with respect to the initial position of graphene plane (dh) in the z direction and the distance between two fluorine adatoms (dF-F) are listed. The mean value of θCCF and the rehybridization (spx) predicted by POAV1 for the carbon atom C(F) in the C–F bond are also shown. θCCC is the mean value of the internal hexagonal angle around C(F). Rehybridization (spx) for the carbon atom C(F) in the C–C bonds is predicted by POAV2. The charges on the C(F) and F atoms predicted by Löwdin analysis are given in units of electron charge e. All distances are in Å and angles in degrees. a Structural data are taken from Ref. [22]. b Structural data are taken from Ref. [16]
More configurations are possible with a third adatom, for which our 5×5 supercell models CF0.06. AAA and ABA configurations leave three and one broken π-bonds in the graphene network,
15
respectively, which are not low-energy configurations for graphene. The result is that all AAA configurations shown in Fig. 1(a) are unstable with respect to 𝛥𝑈,. For ABA configurations the situation is much better. In the more stable ABA1 and ABA2 mixed configurations the C–F bond length becomes shorter, with slightly higher covalent nature. Due to repulsive interactions between partial charges on the central carbon atoms on opposite sites (nearest neighbors) C(F)–C(NN), bond lengths increase and the configuration stabilizes. ABA1 is the most stable three-adatom structure among all mixed configurations, while ABA3 is not a stable structure, with a negative 𝛥𝑈,. The stability criteria, including 𝛥𝑈,, are comparable to those with two adatoms, in spite of the fact that the three adatoms are not distributed evenly in the mixed sublattices. Hence, one expects the stability and covalent nature to increase and the C–F bond lengths to decrease with the number of adatoms distributed evenly in the mixed sublattices. Contrary to two-side fluorination, full adsorption of F atoms over the same side of graphene plane (CFx=1) is not stable due to the repulsion between F atoms, and also topological frustration of the single side sp3 bonds, which should yield a curved surface. Among the highly concentrated single-side FG configurations, both C2F (CF0.5), C4F (CF0.25) have been found previously to be stable, with C4F being the most stable structure [16]. While the maximum attainable covalent nature can be sp2.82 for two-side full fluorination (FG chair structure), according to the geometries given in Ref. [16], it cannot exceed sp2.43 for single-side fluorination. F adatoms in the corresponding unit cell of C
4F are arranged in a configuration similar to AB2 in Fig. 1(a). Therefore, fluorination can most likely proceed from the opposite vertex or nearest sites (AB2 and AB1 configuration). The stability increases with the concentration of fluorine adatoms, and the covalent nature tends towards the maximum attainable limit of sp2.43.
3.3 Stability of the F2 admolecule on graphene
Previously, binding energies of F2 admolecules on graphene have been studied using two different geometrical optimization strategies: (i) In Ref. [60], it is assumed that the molecular bond length of the isolated molecule cannot be significantly changed during the adsorption process, since the intramolecular binding should be much stronger than the molecule surface interaction. Therefore, the equilibrium distance was found from a set of energy calculations for different heights of the F2 molecules (with fixed F–F bond length) above the graphene surface. (ii) On the other hand, in Ref. [61] full relaxation has been carried out for an F2 molecule initially placed 1.8
16
A° above the graphene surface, while interatomic F–F distances were inferred according to C(F) –C(F) separation for each configuration.
Since the geometry of the molecule near the surface may severely affect the binding energy of the compound, we have tried both initialization strategies, which favor one or the other of the geometrical analyses in Refs [60] and [61].
In the first approach, we relax an isolated F2 molecule. The PBE F–F bond length is found to be 1.42 A°, which agrees with experiment. We then bring it to a distance of 1.8 A° from the graphene surface in the middle of a C–C bond. According to Ref. [60], the parallel direction is more stable than the perpendicular one. In contrast to Ref. [60], we let the whole compound fully relax with rigorous convergence parameters. In the second approach, we use the strategy introduced in Ref. [61], but since the inter-fluorine atom distances in some of configurations are much larger than in isolated F2, we have placed the molecule initially at 3 A° (the limit between physisorption and chemisorption) from the graphene surface, and again fully relaxed the combined structure. At small initial distances from graphene and large F–F separations, the molecule simply dissociates and adsorbs atomically on the surface, as happens for most compounds in Ref. [61], with the notable exception of the AB1 configuration.
From the two approaches, we obtain the same final geometry for AA, AB1 and AB2 configurations. From the first approach the interatomic distance in the fluorine molecule after full relaxation increases from 1.417 A° to more than 1.8 A°. As a result, the binding energies shown in Table 4 are about three times larger than those obtained in Ref. [60]. In addition, contrary to Ref. [61], the fluorine molecules in AA, AB1 and AB2 configurations do not dissociate, relaxing to a different stable distance from the graphene surface for each configuration: see Table 4. For the AB3 configuration the C(F)–C(F) distance is much larger than the isolated F2 bond length (3.75 A°), so we applied the first approach. The interatomic distance of an F2 isolated molecule increases from 1.417 A° into 1.948 A°, while the F2 molecule is pushed up to a height of 2.544 A°, parallel to the initial graphene plane.
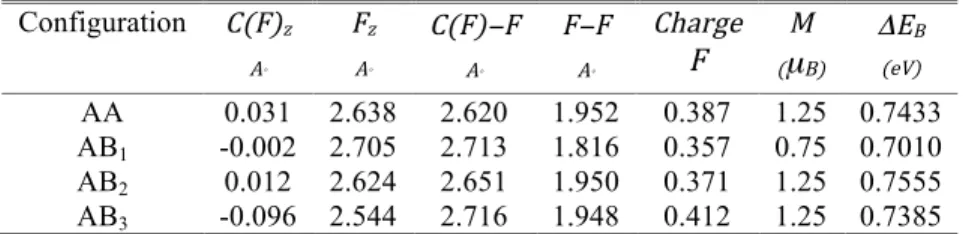
17 Configuration C(F)z A° Fz A° C(F)−F A° F−F A° Charge F (µM B) ΔEB (eV) AA 0.031 2.638 2.620 1.952 0.387 1.25 0.7433 AB1 -0.002 2.705 2.713 1.816 0.357 0.75 0.7010 AB2 0.012 2.624 2.651 1.950 0.371 1.25 0.7555 AB3 -0.096 2.544 2.716 1.948 0.412 1.25 0.7385
Table 4. Characterization of the ground state of an F2 admolecule above different positions on graphene (see Fig. 1). C(F)z and Fz are the z-coordinates of the atoms after relaxation (initially the graphene layer lies in the plane z=0). C(F)−F is the final bond length between the C(F) and fluorine atoms. F−F is the final interatomic distance of the F2 molecule. The charge on each fluorine atom is given in units of electron charge e. M is the total magnetic moment of the supercell in units of µB. The binding energy ΔEB of the molecule on the surface is given in eV. All distances are in A°.
According to our comparison of the two approaches, the equilibrium position of the F2 molecule is around 2.7 A° above the graphene surface, as shown in Table 4. The most stable configuration features F2 in the AB2 arrangement. Here AA is intermediate, and AB1 shows the smallest F–F distance (1.816 Å), leading to the weakest binding between the molecule and the surface (0.70 eV). For an isolated F2 molecule and graphene we have a magnetic moment M=0. For F2 close to graphene M increases, due to the weakened fluorine bond and hybridization. The smallest value of M=0.75 µB appears for AB1, at the largest distance from the surface.
In agreement with Ref. [60], the C–F bond length and the charges on each F atom show an ionic contribution to the binding energy, due to the charge transfer from graphene to the molecule: see Table 4. Although the two approaches give the same result, one should note that with increasing temperature T the molecule may come closer to the surface. If the initial interatomic F–F distance is larger than in the isolated molecule, dissociation and atomic adsorption is possible, as our MD results confirm at T=100 K. Overall, we find the first approach to tracking molecular dissociation to be more reliable than the second one.
3.4 Stability and diffusion of fluorine adatoms on graphene
In the previous section the stabilities of FG were studied at lower coverages of fluorine. Now, we will see how the less stable configurations may transform to more stable ones through diffusion of F atoms. Previously, a barrier height of 290 meV for migration of a single fluorine adatom to the nearest site has been found in calculations performed in a 4×4 supercell [54]. A barrier height of 356 meV obtained in a 2×2 supercell using vdW-DF calculations has also been
18
reported [23]. We obtain a smaller barrier height of 249 meV to the diffusion of a single adatom to its nearest site on a 5×5 supercell. The residual difference with the previous results of [54], at the same theoretical level and functional, is probably the result of finite size effects.
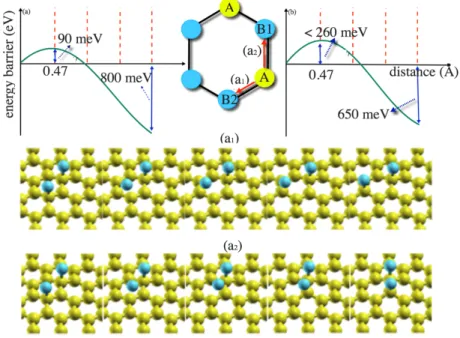
There are different scenarios for the two-adatom case, depending on the position of the second adatom compared to the first one. Due to the computational cost of NEB calculations in a 5×5 supercell, we only consider diffusion to transform the AA into the AB2 and AB1 configurations. Transforming from AA to either AB1 or AB2 happens through the first nearest neighbor: see Fig. 3. The corresponding barrier height in a 2×2 supercell is 47 meV in [23]. The energy barriers per equal distance are shown in the same figure. NEB calculations show that diffusion completes only thanks to temporary local defects forming on the substrate along the path of the adatom. The transition of an F atom to its first nearest neighbor from an A to a B site takes place predominantly along a pathway forming an AB2 arrangement with an activation energy of 96 meV, which is 153 meV smaller than the diffusion barrier for a single adatom. The energy gain is 804 meV and FG will quickly adopt the most stable configuration.
Fig. 3. (Color online) PBE-PAW predicted potential energy profiles and energy gains of the AA to (a) AB2 and (b) AB1 ad-dimer diffusion pathways. Selected NEB images along the corresponding pathways are shown in the bottom insets.
19
By using the Arrhenius law, the equivalent activation temperature is T= MNO
PQn;opo . The factor 𝛤H is simply approximated by a typical phonon frequency of C–F stretching mode (1000-1400 cm -1), i.e., ~10 THz. That means 1013 attempts are performed per second by a fluorine adatom to jump from one site in sublattice A into the nearest site from sublattice B. The equivalent estimated activation temperature of a successful jumping per second (Γ=1 s-1) is found to be about 40 K and the diffusion can readily happen at room temperature at a rate of ~1011 s-1 or time scale of ~10 ps. The reverse path from AB2 into an AA dimer requires a large activation energy, 900 meV, of the order of ΔΕΒ.
We find that the energy barrier to diffuse an adatom to its first nearest neighbor (from AA to AB1) is about three times larger than from AA to AB2, with a time scale of ~10 ns: see Fig. 3. Therefore, diffusion along a path using AB1 configurations is much less probable than through AB2. The same result has been reported for a small 2×2 supercell, using a vdW-DF functional [23]. The binding energies per adatom, given in Table 2, are much higher than the diffusion barrier. Therefore, the adatom cannot leave the surface during the diffusion. We note that a negative 𝛥𝑈, controls the barrier heightsin diffusion.
It is worth noting that hydrogen atoms experience an energy barrier of 0.50 eV [35], twice as high as fluorine, to diffuse in a path from AA into AB1. The more ionic nature of the C–F bond is responsible for the distinct features of fluorine on graphene. Two unpaired electrons of AA configuration are delocalized through the B sublattice, and interact with the charge on fluorine atoms. During diffusion of fluorine from AA to each AB configuration, the electron spins will be paired, and the repulsive interaction reduced. On the other hand, larger charge depletion will occur around the C(F) atom, increasing the attractive interaction. These distinct features result in a smaller barrier height for diffusion of fluorine from the AA to the AB configuration on graphene compared to hydrogen.
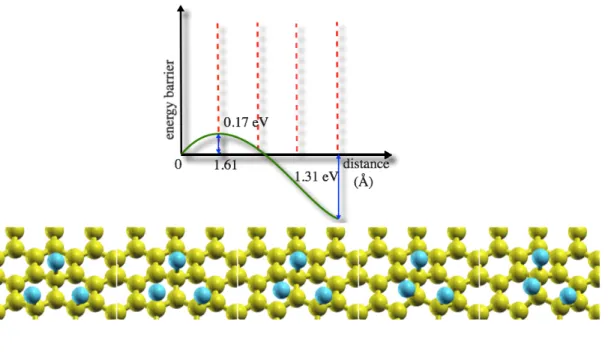
We employ NEB calculations to study diffusion of fluorine atoms to transform an AAA1 configuration of three adatoms into the more stable ABA1 configuration. We find an energy barrier of 170 meV, smaller than for transforming AA to AB1, see Fig. 4, while the energy gain is 1.31 eV. The corresponding activation temperature is 61 K and diffusion happens on a time scale of ~100 ps at room temperature.
20
Fig. 4. (Color online) PBE-PAW predicted potential energy profile and energy gain of the AAA1 to ABA1 ad-trimer diffusion pathway. Selected NEB images along the pathway are shown in the bottom insets.
The diffusion process to reach the most stable configuration follows the ΔUB parameter. As seen in Table 2, ΔUB decreases considerably from AA into AAA configurations. ΔUB is influenced by the ionic character of the C–F bond and therefore, we expect to be able to decrease the diffusion barrier height by adding adatoms on the same sublattice.
3.5 Stability and total magnetic moment
Fluorine has an unpaired electron, which carries a spin moment of 1 µB, and one expects that the breaking of a π bond from the graphene network by a fluorine adatom will induce 1 µB magnetization on the structure. Experimental evidence shows that fluorine adatoms do indeed carry spin ½ magnetic moments. However, no magnetic ordering could be identified down to liquid helium temperature, and the maximum measured magnetic response is limited to one moment per approximately 1,000 carbon atoms [40].
While theoretical studies of the magnetic properties of hydrogenated graphene show compatible results, the magnetic properties of FG in lower fluorine concentrations are a subject of debate and the issue is not fully understood. Based on GGA-DFT outcomes, due to the absence of the exchange splitting of impurity states, single F adatoms adsorbed on n×n supercells of
21
graphene with n ≥ 3 (concentration equal or less than CF0.056) are predicted to be non-magnetic [24, 36-38]. In Ref. [24], This result has been attributed to the large F–F distance and short-range magnetic coupling, which may prevent adatoms from coupling even through the bulk π states of graphene. On the other hand, in Ref. [36] the DFT-predicted M=0 state was justified by a model that includes the interactions for only F, C(F), and C(NN) atoms leading to an effective Anderson impurity, in which the absence of magnetism can be explained in terms of its effective parameters. The above assertions are based on DFT predictions, while it has been shown previously that, owing to self-interaction error (SIE), DFT local and semilocal exchange-correlation (xc) potentials cannot predict the correct spin state of an H adatom adsorbed on a flat graphene surface [62]. SIE is associated with the improper long-range asymptotic behavior of xc functionals and it plays a decisive role in charge-transfer systems and heteronuclear diatomic molecules (XY), when the lowest unoccupied molecular orbital (LUMO) energy of atom Y lies below the highest molecular orbital (HOMO) of atom X [63-64]. C–H bonding, when one constrains the surface to be flat, is a reminiscent of ionic bonding. In such a situation, the energies of the occupied and unoccupied hydrogen s orbitals have been shown to converge when approaching the graphene surface. Below a certain distance they become degenerate and approach the Fermi energy [62]. At this point, these orbitals are equally occupied by a fractional number of electrons, leading to spin quenching [62]. In contrast to hydrogen, the LUMO of a fluorine atom lies below the Fermi level of graphene. For semi-ionic C–F bonds, the DFT prediction of partial occupation of spin up and down near the Fermi energy, yielding M=0, is dubious. Hybrid functionals can cure the SIE, but at great computational cost. M≈1 µB has been reported from HSE hybrid functional for a single fluorine adsorbed on a graphene supercell of 3 3×3 3𝑅30°, CF0.019 [39]. PBE+U is a less expensive remedy (described in detail in Ref. [65]) to predict correctly the magnetic response of the FG structure. We employ PBE+U and investigate the relationship between the stability and magnetic response of the configurations shown in Fig. 1(a).
Total magnetizations are computed by integrating the components of the spin density, which are summed over all bands and k-points. The predicted M values for configurations that have one or more broken π bonds with imbalance between the number of sites of the two sublattices are not the same within the PBE and PBE+U methods, as can be seen in Table 2. PBE+U predicted partial density of states (pDOS) of CF0.02 show that the pz orbitals of fluorine and carbon atoms determine
22
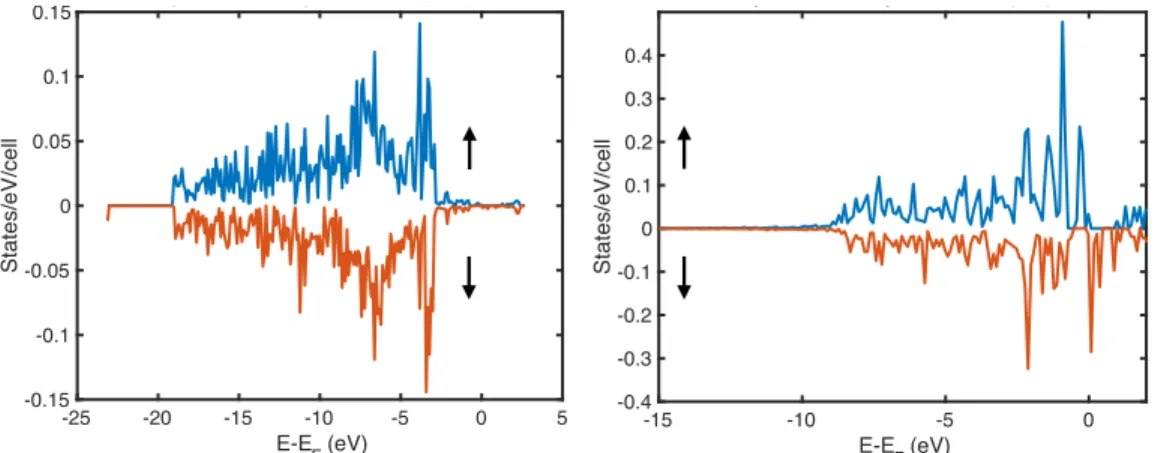
the magnetic response of FG. The pDOS of px and pz orbitals are shown in Fig. 5. No spin
polarization is observed for px orbitals. Instead, a clear splitting of pz spin up and down orbitals are observed, which induces magnetism in the structure via exchange interaction between itinerant pz electrons, which makes them semilocalized. The exchange splitting ΔEx is about 0.43 eV, larger than kBT at T=300 K, and satisfies the Stoner criterion with ferromagnetic ordering for the same-sublattice sites (ferrimagnetic in general). Therefore, one may expect a Curie TC above room
temperature at this concentration, according to the Stoner criterion.
Fig. 5. (Color online) PBE+U predicted partial density of states (pDOS) of the majority (blue color) and minority (red color) electrons of px (left panel) and pz orbitals (right panel). Almost no polarization for px orbitals is observed. Comparing pDOS of occupied pz and px orbitals of majority and minority electrons shows the magnetic properties of FG mostly stem from pz orbitals for structures with an imbalance in number of adatoms between two sublattices. Fermi energies EF are set to zero.
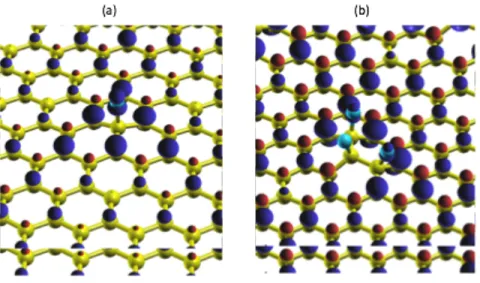
In Fig. 6(a), we report an isosurface of the spin density distribution predicted by PBE+U for CF0.02. Assuming the fluorine is adsorbed on a carbon belonging to the A sublattice, we observe that most of the 1 µB of magnetization, previously carried by a fluorine atom, is now distributed symmetrically with long-range polarization on carbon atoms of opposite sublattice B. The highest spin density comes from C(NN) atoms and gradually decays with the distance from adsorption site. Small negative magnetization is observed on carbons from the A sublattice, which has spins antiparallel to the fluorine atom. The resulting total magnetization predicted by PBE+U is M=1µB. For adsorption of a fluorine dimer on a 5×5 supercell of graphene, CF0.04, two different ground
-15 -10 -5 0 E-EF (eV) -0.4 -0.3 -0.2 -0.1 0 0.1 0.2 0.3 0.4 States/eV/cell pDOS z-component of C(NN) -25 -20 -15 -10 -5 0 5 E-EF (eV) -0.15 -0.1 -0.05 0 0.05 0.1 0.15 States/eV/cell pDOS x-component of C(NN)
23
states with singlet (↑↓) and triplet (↑↑) spin arrangements are possible. In FG with the AB1 configuration, the C(NN)–C(F) bond length of the singlet state is closer to the carbon sp3 characteristic bond length (1.49 Å against 1.47Å). In addition, ∆UB takes a negative value for an “unpaired” triplet spin arrangement. In the triplet case, the two parallel spins further avoid each other through exchange interactions and the stability of the triplet state is reduced by another 1.5 eV. Accordingly, clustering can only be made from singlet state and both DFT and DFT+U predicts AB1 and AB2 are non-magnetic structures. Here no antiferromagnetic coupling is even observed between adjacent sites, instead M=0 µB is a result of nearly zero magnetic dipole on each site which resembles the magnetic feature of pristine graphene.
Fig. 6. (Color online) (a) Spin density isosurface of a single F adatom on graphene. Carbon atoms are shown in yellow and fluorine atoms in blue. If the fluorine atom binds to a carbon atom C(F) on an A site, the up excess (dark blue bubbles) is observed on the B sublattice and the spin-down excess (red bubbles) is found on the A sublattice. The largest contribution is from the nearest neighbors C(NN) to the C(F) atom. (b) Spin density isosurface of an ABA1 ad-trimer on graphene. Two F adatoms are coupled ferromagnetically with each other and antiferomagneticaly with the third adatom bonded to the B sublattice.
In an AA configuration two adatoms are unevenly distributed between the two sublattices (|NA-NB |=2, where NA and NB are the numbers of defects on sublattices A and B, respectively). According to Lieb’s theorem [66] (with a pictorial explanation in Fig. 7), total spin of the FG is equal to half the imbalanced in the numbers of adatoms on each sublattice: S = |NA-NB |=2. Therefore, in contrast to the AB configuration, ferromagnetic ordering with S=1 is the only
24
possible choice for the magnetism originating from two fluorines bonding to the same sublattice. M=2 µB has been shown for AA hydrogen configuration [33-34]. PBE-GGA predicts a small non-zero M for the AA FG configuration, while PBE+U predicts a total magnetization of less than M=1.6 µB (smaller than the expected M=2 µB). It is probable that the semi-ionic nature of the C– F bond makes electrons on the impurity states less localized and gives rise to smaller M, compared to the AA hydrogen configuration. This point should be examined in more detail in the future, with SIE corrected functionals. In any event, AA with about M≈2 µB is not a favorable configuration according to the ΔUBstability criterion. Therefore, non-magnetic structure is the most likely configuration during the fluorination process.
Fig. 7. (Color online) Resonating valence bond model of the itinerant electron in a 5×5 unit cell of graphene for AA and AB1 ad-dimer. Adatoms are shown in blue circles and nonbonded electrons with black dots. The two sublattices A and B are distinguished from each other by the green color for sublattice A and red for sublattice B. There are two and one broken π bonds, respectively, in panels (a) and (b).
We select three different configurations (ABA1, AAA1 and AAA2) to inspect the magnetic response of three fluorine adatoms adsorbed on a 5×5 cell of graphene, modeling CF0.06, with constrained atomic magnetizations. PBE-GGA calculations for the ABA1 configuration predicts that the ↑↓↑ spin arrangement is preferred over ↑↑↑ by about 0.75 eV per adatom and gives a total magnetization of M=0.48 µB. PBE+U predicts that two adatoms in the A sublattice are coupled ferromagnetically with each other, and antiferromagnetically with the third adatom in B sublattice, see Fig. 6(b), resulting in M=1 µB. Spin-up excess is distributed with the same pattern around two adatoms bounded to carbon atoms on the B sublattice, whereas spin-down excess is distributed on the A sublattice. While PBE-GGA predicts M=1 µB for the AAA1 and AAA2
25
configurations, PBE+U predicts that three adatoms are coupled ferromagnetically, resulting in
M=3 µB.
Consequently, the magnetic response of graphene is influenced by its bipartite nature and follows the symmetry of the defect sites. For each adatom on one sublattice, an electron of the opposite sublattice will be unpaired, which breaks the equivalence between the two sublattices. According to the bipartite symmetry only electrons of two opposite sublattices can be paired. By using a pictorial sketch of resonant valence bond model (Kekulé) structures, shown in Fig. 7, one can explain simply the bipartite magnetic response of graphene. As an example, when two fluorine atoms are bound to two carbon atoms on the same sublattice A, two pz electrons with the same spin alignments are left on the B sublattice. Instead, there is no unpaired electron in Fig. 7(b). When two adatoms are bonded to opposite sublattices, only one π bond is broken in the graphene network.
Therefore, evenly mixed sublattice binding configurations have higher stability and M ~ 0 with non-magnetic feature. Our model explains why the maximum detected magnetic response has been limited to approximately one moment per 1,000 carbon atoms [40]: fluorination will develop geometrically from a central carbon, and additional fluorine adatoms will bind to the nearest neighbor atoms (and so on) to avoid the imbalance between two sublattices, leading to the minimum possible total magnetization.
3.6 Electronic properties of adatoms on graphene
The electronic behavior of FG is severely influenced by the type (single- or double-side
fluorination), density and arrangement of fluorine adatoms on the surface. Our study of single-sided FG shows different electronic behavior from published results on double-single-sided FG. The experimental reported double-sided fully FG band gap is 3 eV [15] and is in agreement with the theoretical prediction of 2.96 eV [16, 67].
Single-sided C2F chair was predicted as a gapless metal, but the C2F boat arrangement is a semiconductor with a band gap of 1.57 eV. A theoretical band gap of 2.93 eV is predicted for single-sided CF0.25 in C4F arrangement [16], while experimental evidence confirm that C4F is optically transparent (which implies a band gap of about 3 eV) and is over six order of magnitude
26 more resistive than graphene [19].
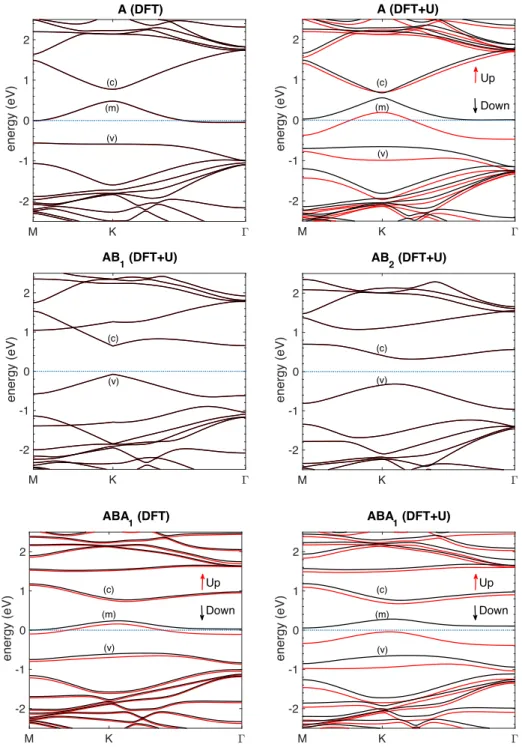
Fig. 8. DFT and DFT+U band structures of different configurations of single-sided FG. The energies are plotted relative to the Fermi level (blue dotted line). For AB1 and AB2 DFT and DFT+U give the same result.
On the other hand, large area few layer graphene, subjected to plasma-induced fluorination M K ! -2 -1 0 1 2 energy (eV) A (DFT) (c) (m) (v) M K ! -2 -1 0 1 2 energy (eV) A (DFT+U) (m) (c) (v) Up Down M K ! -2 -1 0 1 2 energy (eV) AB 1 (DFT+U) (c) (v) M K ! -2 -1 0 1 2 energy (eV) AB 2 (DFT+U) (v) (c) M K ! -2 -1 0 1 2 energy (eV) ABA 1 (DFT) (c) (m) (v) Up Down M K ! -2 -1 0 1 2 energy (eV) ABA 1 (DFT+U) (c) (m) Up Down (v)