THE DISSOCIATIVE ELECTROIONIZATION OF AMMONIA AND
AMMONIA-d
3.
III. THE N
+DISSOCIATION CHANNEL.
GENERAL CONCLUSIONS ABOUT THE DISSOCIATION OF NH
3+
R. LOCHT and J. MOMIGNY
Département de Chimie Générale et de Chimie Physique, Institut de Chimie, Université de Liège, Bâtiment B6, Sart-Tilman par B-4000 Liège 1, Belgium
Abstract
The dissociative ionization of NH3 is investigated in its N +
dissociation channel in the 20-50 eV electron energy range. Both the translational energy distribution and the appearance energies are measured. The kinetic energy versus appearance energy plot reveals seven N+ producing processes. Near the onset (22.5-24.0 eV) dissociative autoionization occurs whereas direct dissociative ionization produces N+ in the 24.5-30 eV range. Above 35 eV mainly N+/H+ ion pairs are formed at the expense of doubly ionized states. The dissociative electroionization work on NH3 being completed, a review of the results is presented.
1. Introduction
In the recent past, the dissociative electroionization of NH3 into its NH2+, NH+, [1] and H2+, H+ [2]
dissociation channels has been reported. Translational energy distributions at different electron impact energies and appearance energies of these fragment ions were discussed in detail. Both papers include the discussion of the dissociation of NH3 doubly ionized states in the corresponding channels.
The dissociation of NH3 leading to the production of N+ has mainly been investigated by
electroionization by several groups [3-6]. However none of these provided any data about the translational energy carried away by N+ at the numerous reported threshold energies.
The dissociation of NH3 has also been investigated by electron energy-loss spectroscopy [7] and
electron-electron coincidence experiments [8]. Branching ratios and the fragmentation patterns of the three valence ionic states were derived.
Besides dissociative electroionization, dissociative excitation work on NH3, into N and N +
, has been reported. Bδse and Sroka [9] investigated the emission intensity of N(3s 4P→2p3 4S;2p4 4P→2p3 4S) and N+ ( 2p3
3
D→ 2p2 3P ) as a function of the electron-impact energy. Carnahan et al. [10] measured the excitation function of "high Rydberg" excited N atoms. The former investigation being performed without translational energy analysis, the latter provided some informations about this quantity. Nevertheless these data can be related to dissociative electroionization through the "core ion" model [11,12].
In this paper the dissociative electroionization results on NH3, in the N +
producing channel, are reported. This work includes a detailed N+ ion translational energy analysis. The 15-50 eV electron energy being covered, the dissociation of NH3 doubly ionized states will be considered. Preliminary results on this particular
aspect were already published elsewhere [13]. Furthermore all the dissociation channels of NH3 +
being investigated, the opportunity will also be taken to draw general conclusions about the dissociative ionization of NH3.
2. Experimental method
The experimental setup used in the present work has already been described in detail elsewhere [14,15]. Only the most salient features will be repeated here.
The ions produced in a Nier-type ion source by the impact of energy-controlled electrons on the target gas, are allowed to drift out of the ion source exit hole, energy-analyzed with a retarding lens and mass-selected in a quadrupole filter. The ion current, collected on a 17-stage Cu-Be electron multiplier, is continuously scanned as a function of either the electron energy at fixed retarding potential VR (electroionization efficiency curve) or
the retarding potential at fixed electron energy Ee (retarding potential curve). Both signals are electronically
differentiated. The experiment is almost completely computer-controlled.
For each series of measurements on N+/NH3, special care is taken to keep the N2 +
background as low as possible by prolongated baking-out of the vacuum chamber. The experimental conditions are identical to those described previously [1]. Ammonia (Air Liquide, 99.5%) samples, distilled under vacuum, are introduced at 10-7 Torr as measured in the vacuum vessel.
The maximum of the NH3 +
ion energy distribution is used as zero energy calibration point of the trans-lational energy scale. The appearance energy of NH2
+
at 15.72 ±0.1 eV is used to calibrate the electron energy scale [1]. At each retarding potential or electron energy setting, the first derivative of the ionization efficiency curve or of the retarding potential curve is scanned 100-800 times.
As usually this procedure has been repeated five times. However because of the suspected presence of traces of N+/N2 in the background spectrum the series of measurements have been repeated twice and spread
over a period of one year. By this way exact reproducibility of any detail in the first differentiated ionization efficiency could be controlled. The energies quoted in the next section are average values of ten independent measurements and are very probably free of N+/N2. The quoted errors and drawn error bars are given by the
standard deviation. In the diagrams, linear regressions are fitted to the experimental data.
3. Experimental results
As a preliminary remark, it has to be pointed out that notwithstanding all the abovementioned precautions, N+/N2 can interfere with N
+
/NH3 especially for low intensity contributions at high ion energies. If
so, detailed measurements on N+/N2 are available [16] and comparison can be done when necessary.
Fig. 1. First differentiated retarding potential curves of N+/NH3 as recorded at indicated electron impact
The translational energy distribution curve of N+/ NH3, as recorded at several electron impact energies,
is shown in fig. 1. The N+/NH3 kinetic energy distribution spectrum extends up to 1.5 eV ion energy at 40 eV
electron energy and to 0.3 eV near the onset at 22.6 eV. At high electron energies slope changes are observed around 0.45 and 0.7 eV ion energies. The main peak is broad and has its maximum at 0.0 eV throughout the prospected electron energy range.
Typical first differentiated ionization efficiency curves of N+/NH3 as observed at different retarding
potential settings VR are shown in fig. 2 over the electron energy range of 19-40 eV. Six onsets are measured
over the 19-50 eV range covered in this work: 22.5 ± 0.2, 24.1 ± 0.3, 26.7 ± 0.3, 28.4 ± 0.3, 36.9 ± 0.4 and 46.5 ± 0.4 eV. This latter onset was measured from separate recordings (not shown in fig. 2) in the 30-50 eV electron energy range.
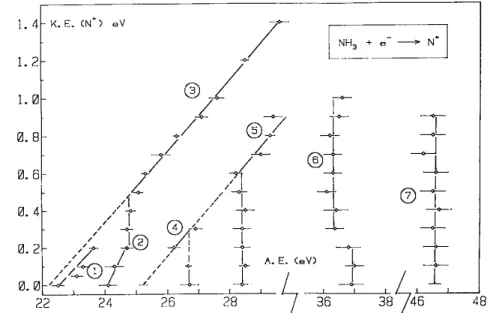
The kinetic energy (KE) versus appearance energy (AE) plot, resulting from these measurements is shown in fig. 3.
Fig. 2. First differentiated ionization efficiency curves of N+/ NH3 as recorded at indicated retarding potential
settings. Vertical bars locate the average appearance energies.
4. Discussion
For sake of clarity in the following discussion, the results obtained in the present work are summarized in table 1. In table 2 are listed all the data used in the present work to calculate the onset energies for the various processes invoked for the N+ formation from NH3.
Fig. 3. The kinetic energy (KE) versus appearance energy (AE) diagram for N+ /NH3.
The lowest onset for N + production from NH3 (see fig. 2) is observed at 22.5 ± 0.2 eV. This value is in
very good agreement with the earlier measurements of Reed and Snedden [4], i.e. 22.6 ± 0.1 eV and the most recent value reported by Morrison and Traeger [5]. The largest discrepancy is found with the onset determined by Mark et al. [6] at 29.5 ± 0.5 eV. It has to be pointed out that these authors measured systematically higher onset energies compared to other published values. The earliest determination of Mann et al. [3] locates the first onset at 24.9 ± 0.5 eV.
Energetically, the lowest threshold for N+ formation from NH3 would be ascribed to the process
for which an onset at 22.17 ± 0.2 eV is calculated using the data in table 2. Though lower, this value compares very well with the experimental onset energy.
The kinetic energy versus appearance energy diagram related to this process is shown in fig. 3 and corresponds to the straight line (1). This diagram shows that at the onset of 22.5 eV the N+ ions are produced carrying 0.0-0.2 eV translational energy. The straight line (1) is characterized by a slope of 0.18 and a correlation coefficient of 0.8. The extrapolated value AE(N+)KE=0=22.5eV. The expected slope is evaluated from the ratio
Table 1. The kinetic energy distribution (KED) and appearance energies (AE) of N+/NH3 measured in this work
and compared to previously reported AE values
KED (eV) AE (eV)
this work ref. [3] ref. [4] ref. [5] ref. [6]
0.0 22.5 ± 0.2 - 22.6 ± 0.1 22.5 - ≈0.45 24.1 ± 0.3 24.9 ± 0.5 24.1 ± 0.1 24.1 - ≈0.7 26.7 ± 0.3 - 26.6 ± 0.1 - - 28.4 ± 0.3 28.0 ± 0:5 28.6 ± 0.1 - 29.5± 0.5 36.9 ± 0.4 - - - - 46.5 ± 0.4 - - - -
3mH/mNH3 = 3/17 = 0.176. The agreement between both slope values, taking into account the rather poor
correlation coefficient, indicates that no excess energy conversion into translational and internal energy, e.g. by H2, is involved in the dissociation process. However the slight discrepancy between calculated and observed
onset could proceed from vibrationally excited H2, involved in the dissociation process.
The production of N+ through a two-step mechanism e.g.,
as suggested by Morrison and Traeger [5] could probably be discarded. The kinetic energy versus appearance energy slope would be 2mH/mNH2 = 2/16=0.125.
The abovementioned dissociation process takes place in an energy range where no ionization cross section is found in the photoelectron spectrum of NH3 [21]. Therefore this dissociation has to take place through
a dissociative autoionization mechanism involving a neutral NH3* state as an intermediate.
In the study of NH2 +
, NH+ [1] and H+ and H2 +
[2] formation, where an appearance energy near 22.6 eV is observed, it has already been pointed out that a neutral excited (very likely a Rydberg) state has to play a role.
However while for these ions large translational energies are involved [1,2], for N+ only 0.2 eV kinetic energy is carried away and this ion is produced without translational energy at the onset.
If the intermediate NH3 *
state is a Rydberg state, it is a member of a series converging to the highest valence ionized NH3
+
( 2A1 ) state, which is fully dissociated along all the dissociation coordinates. The
Rydberg state observed in the energy range of 22.5-22.6 eV has the same property.
Table 2. Dissociation (D), ionization (IE) and excitation (EE) energies (eV) used in this work a) D(NH2-H) = 4.51 ±0.09 b) EE(H2)-c 3 Πu=l 1.882 e) D(NH-H) = 3.90±0.09b) EE(H)-2s= 10.198 d) D(N-H) = 3.69c) EE(N+)-3P = 0.0d) D(H-H) =4.476 c) EE(N+)-1D=1.899d) EE(N+)-1S=4.052d) IE(H2) = 15.496 c) EE(N+)-3D=l 1.436 d) IE(H) = 13.595d) IE(N) = 14.549 d) a) l eV=23.060kcal mol-1 = 8065.73 cm-1. b)
Ref. [17]. c) Ref. [18]. d) Ref. [19]. e) Ref. [20].
The second onset of N+/NH3 is determined at 24.1 ± 0.3 eV. This appearance energy is in very good
agreement with previously reported threshold energies, e.g. 24.1 ± 0.1 eV [4], 24.1 eV [5] and24.9 ± 0.5 eV[3].
The energy difference between the two first appearance energies is 1.6 ± 0.5 eV. This amount of energy fits fairly well the excitation energy of N+ to its 1D level, i.e. 1.899 eV above the ground level (see table 2). The calculated threshold for the process
lies at 22.17+1.899 = 24.07 eV, close to the experimental onset.
Though defined by only three points, the least square fit applied to these provides a straight line (2) (see fig. 3) with a slope of 0.32 extrapolating at 24.05 eV. Even if its significance is rather limited, the correlation
coefficient is 0.98. Most surprising is the slope of 0.32 instead of the expected 0.176 value. Such a deviation is unaccountable by the production of N+ from NH3, e.g., through the decomposition of NH2
+
or NH+. The expected slope would be given by the ratios 2/16 = 0.125 or 1/15=0.067 respectively. Furthermore if N+ is produced from N2 the slope would be 14/28 = 0.5.
As it has been experienced earlier [2], free molecular H2 is known to be formed by thermolysis of NH3
on the electron emitting filament. The formation of N2 could be expected. Notwithstanding the above-mentioned
precautions, N2 from the background can still not be excluded. However, the onset for N +
/N2 is found at 24.3 eV
[16] and the kinetic energy versus appearance energy diagram is a straight line with the expected slope of 0.5 [16]. It seems to be very likely that the N+ ion current observed between 24.1 and 24.8 eV is a mixture of N+/NH3 and N
+
/N2 and the observed slope "s" would be 0.176 < s < 0.5.
Up from 24.8 eV a straight line (3) rises from 0.5 to 1.4 eV kinetic energy, i.e. 2.8-7.9 eV total transla-tional energy. A least-squares fit on eight experimental points provides a straight line extrapolating to 22.24 eV with a slope of 0.18. The correlation coefficient is 0.996.
The slope of the straight line (3) is close to the expected value of 0.176 and obviously the process giving rise to these N+ ions is
It is rather tempting to ascribe both above discussed dissociation processes to the decomposition of the same electronic state. The intermediate state could be the highest-valence NH3
+
( 2A1) state. From
photoelectron spectroscopy the adiabatic ionization energy of this state is known to be 24.5 eV [21]. The corresponding photoelectron band is structureless, indicating this state being fully dissociative in the Franck-Condon region.
However, and though they are close in energy, the two dissociation mechanisms leading to N+ are quite different not only with respect to the species produced but also and particularly with respect to the amount of translational energy involved in both reactions.
It is therefore very likely that at 24.1 eV, i.e. below the ionization energy of the 2A1 state,
dissociation occurs through dissociative autoionization, while at 24.8 eV direct dissociative ionization is involved by decomposition of the ionic 2A1 state.
Two threshold energies are determined in the electron energy range of 26-29 eV, i.e. 26.7 ± 0.3 and 28.4 ± 0.1 eV. These critical energies are in very good agreement with previously reported onset values: 26.65 ± 0.1 and 28.6 ± 0.1 eV by Reed and Snedden [4]. Mann et al. [3] determined their second onset for N+ at 28.0 ± 0.5 eV. All these appearance energy determinations were performed without ion translational energy analysis.
The energy differences between these onsets and the threshold at 22.5 eV are 4.2 ± 0.5 and 5.9 ± 0.3 eV respectively. The energy difference between the two abovementioned onsets is 1.7 ± 0.4 eV. Without translational energy analysis, these two onsets were previously interpreted by respectively
for which an appearance energy of 26.64 ±0.2 and 28.54 ± 0.2 eV respectively is calculated (see data in table 2). Though the excellent agreement between calculated and measured onsets, these interpretations do not fit the present experimental data.
The kinetic energy versus appearance energy plot related to both onsets are shown in fig. 3 by the diagrams (4) and (5). The former being only defined by two points, a least-squares fit has been applied to both diagrams. By this way one straight line is obtained with a slope of 0.19 extrapolating to AE (N+)KE=0=25.22 eV.
The rather good correlation coefficient of 0.995 clearly indicates that the two first experimental points also fit this straight line. Furthermore the slope of 0.19, which is still comparable to the expected value of 0.176, indicates that the N+ ion current measured at these energies is directly produced from dissociative ionization of NH3. Consequently an important feature resulting from the present measurements is that the N
+
ion formed at 26.7 eV and 28.4 eV carries respectively 0.2 eV and 0.6 eV translational energy at the onset. These quantities correspond to 1.1 and 3.4 eV in terms of total translational energy.
The least-squares fit providing an extrapolated value of AE(N+)KE=0=25.22 eV, the energy difference
between the lowest onset and the extrapolation is 3.0 eV. This energy does fit neither the dissociation energy of H2 nor the excitation energy of N
+
into its 1S level (see table 2). The energy difference 25.2-24.1 = 1.1 eV does not fit the energy N+(1S)→N+(1D)= 4.052-1.899 = 2.153 eV.
To account for all the experimental results obtained in this work the only dissociative ionization mechanism which gives rise to N+ at both 26.7 and 28.4 eV would be
where the N+ ion is produced in its ground or first excited level and molecular H2 appears vibrationally excited in
one specific level v. The slope of 0.19 indicates total excess energy (with respect to 25.2 eV) conversion into translational energy during this dissociation.
The only previous work which probably confirms at least partially the present results has been reported by Carnahan et al. [10]. These authors measured the excitation function of high-Rydberg N atoms from NH3 and
obtained a first onset at 27.0 eV. The translational energy at the onset is estimated by the minimum arrival time of N(Rydb) from time-of-flight spectra. The total kinetic energy release yielded by this procedure is about 4.2 eV. This latter result led to interprete the threshold at 27.0 eV to the dissociative excitation process
In the energy range where mainly double ionization is observed [13], i.e. above 35 eV, two onsets are measured for the production of N+/NH3. These are well separated in energy, at 36.9 ± 0.4 and 46.5 ± 0.4 eV. No
comparison can be made with previous measurements in this energy range, no data being available yet.
For the lowest onset at 36.9 eV, the kinetic energy versus appearance energy diagram is given by the vertical line (6) in fig. 3. Such a diagram is mainly observed when (i) a narrow translational energy distribution is involved in the dissociation or (ii) excess internal energy is completely converted into kinetic energy. When dissociation of doubly ionized states is involved, the former case has to be considered.
The first dissociation limit for the production of N+ through a NH3 doubly ionized state would be
and would level at 35.9 ± 0.2 eV as calculated by using the data listed in table 2. This energy is about 1 eV lower than the experimental onset. This energy difference has to be ascribed to translational energy of the fragments.
As shown in fig. 3, the vertical line (6) is made of two branches. The former extending up to 0.2 eV kinetic energy carried away by N+, is measured at 36.9 ± 0.1 eV as averaged over three times five measurements.
The latter is located at 36.3 ±0.15 eV, averaged over eight times five measurements, and extends from 0.3 to 1.0 eV translational energy.
The first branch extending up to 0.2 eV kinetic energy carried by N+ corresponds to 0.2 x 17/3 = 1.1 eV total translational energy. The energy balance leads to an experimental dissociation limit evaluated at 36.9 - 1.1 = 35.8 ± 0.1 eV in good agreement with the expected one at 35.9 ± 0.2 eV. The H+ ion being produced simultaneously has to appear at the same energy. As reported [2], an appearance energy of D+/ ND3 has been
measured at 36.3 ± 0.3 eV and has been ascribed to
The translational energy range where D+ is observed covers 0.0-4.0 eV. However a contribution of D+ provided by another process superposed to this latter is very likely but indistinguishable.
The second branch located at 36.3 ±0.1 eV extends to 1.0 eV kinetic energy carried by N+ or 5.6 eV in terms of total translational energy. The dissociation limit giving rise to N+ would lie at 36.3 — 5.6 = 30.7 eV. This energy does not correspond to any dissociation process which would produce N+ together with another
ionized fragment H+ or H2+. At this energy the dissociation involves very probably highly excited species, e.g.,
N+*, H* and/or H2*.
As shown in table 2, the first excited H2 (c 3
Πu ) state lies at 11.8 eV above the ground state and the
dissociation limit would be at 22.2 +11.8 = 34.0 eV. By the same way, the third excited level of N+(2p3 3D) lies at 11.4 eV above the 3P ground level. The corresponding dissociation limit lies at 22.4+11.4=33.8 eV. Both these energies are too high compared to the experimental 30.7 eV limit.
Böse and Sroka [9] were able to detect N+ emission lines and measured their excitation function. An onset for 3D→3P emission is reported at 46.5 ± 1.5 eV. For another line, i.e. 3P°(2p3)→3P(2p2) no onset has been measured.
Emission lines from highly excited H atoms have been studied [10,22]. Carnahan et al. [10] and Kurawaki and Ogawa [22] observed H (2s) emission with an onset at 35.4 ± 1.0 eV carrying 4-7 eV translational energy. This onset as well as the translational energy involved are close to the values for N+ measured in this work.
The probable dissociation process at 36.3 eV would be
where this reaction would occur through a highly excited NH3 +*
state (perhaps a Rydberg state) lying close in energy (or converging) to the NH3
2+
(2E) state.
The second vertical line (7) in the diagram displayed in fig. 3 is at 46.5 ±0.4 eV and extends up to 0.9 eV kinetic energy, i.e. 5.1 eV in terms of total translational energy. At this energy doubly ionized NH3 states can
still be involved. Even when not detected by electroionization [13], Winkoun and Dujardin [23] measured photoion-photoion coincidence signals at 44.5 ±0.5 eV. However, time-of-flight differences between NH+ and N+ were not resolved.
The atomization of NH3 and ionization of N and H atoms through, e.g.,
energy measured in this work for N+, the threshold for the abovementioned processes has to be observed at 40.25(42.15)+5.1=45.3(47.2)±0.2 eV. These energies are fairly close to the threshold measured at 46.5 ± 0.1 eV.
From previous measurements on H+ (D+) from NH3 (ND3) an appearance energy of 45.7 ±0.4 eV has
been measured [2]. However, for intensity reasons this onset could only be measured for retarding potential settings up to 0.9 eV. As these protons were ascribed to
another contribution would come from the dissociation of the same doubly ionized state to produce N+. Böse and Sroka [9] determined an onset at 46.4 ± 1.5 eV for 3D(2p3)→3P(2p2) emission. These authors ascribed this threshold to the dissociative ionization process
However the onset calculated for this process is at 38.1 eV. Consequently, about 8 eV translational energy has to be involved. No kinetic energy has been measured. Furthermore this amount of kinetic energy is much larger than that observed in the present work which is about 5 eV.
Carnahan et al. [10 ] measured a threshold at 47 ± 3 eV for N(Rydb) atoms. These authors were not able to assign any dissociative excitation process "because of lack of dissociative ionization data" in the 30-50 eV electron energy range. The present results would be a possible explanation for these experimental data.
5. Conclusion and general considerations about the dissociative electroionization of ammonia
The detailed investigation of the ionization efficiency as well as the translational energy of N+ enabled to describe the dissociative ionization of NH3 in this dissociation channel.
In the energy range from the onset up to 24 eV, the N+ ion is exclusively produced by dissociative au-toionization. Above 24.5 eV and up to 30 eV N+ ions are formed by the decomposition of the unstable NH3
+
( 2A1) state.
In the double-ionization energy range, i.e. above 35 eV, N+ is produced together with H+ only. Some evidence is brought for the production of N + with H (2s ) species which could be produced through the decomposition of NH3
+*
lying in the NH3 +
ionization continuum.
The completion of the present dissociative ionization study of NH3 in all its five dissociative channels is
the opportunity to summarize results and draw general conclusions. Both the dissociation of singly and doubly ionized states of NH3 were considered. For clarity, they will be reviewed separately.
In NH3, the dissociative ionization events leading to a single ionized fragment occur through three
"turning point" states, as illustrated in fig. 4.
(a) The NH3 +
( 2E) state. Owing to the Jahn-Teller splitting of this state into 2A' + 2A" components, NH2
+
is produced at the onset (15.7 eV) through predissociation, allowed by the 2A"- 2A" conical intersection. At 16.9 eV the NH+ fragment is also very likely produced by vibrational predissociation of one of the 2E components. Beside NH2
+
and NH+ protons are produced at 19.5 eV, corresponding to the dissociation continuum of the 2E state [21]. At their onset these three fragment ions are formed without kinetic energy.
(b) A neutral NH3* state. In all dissociation channels a critical energy is determined around 22.5 eV. No
ionization cross section is measured in the pho-toelectron spectrum of NH3, though at this energy for all
fragment ions the dissociative ionization cross section increases more or less sharply at 22.5 eV. N+ has its lowest onset at 22.5 eV. Furthermore, in all dissociation channels, large amounts of kinetic energy are involved. It is suggested that the NH3* state reached at 22.5 eV is a Rydberg state, member of a series converging to the
In this energy range (at 22.6 eV) the study of H+ (D+) from NH3 (ND3) brought evidence for the
production of H+ (D+) through the dissociation of the NH2 +
(ND2 +
) ion.
Fig. 4. Dissociative ionization diagram of NH3 +
in its five dissociation channels. Dashed-drawn species are unobserved intermediates (onset energies expressed in eV).
(c) The NH3 +
( 2A1) state. Excepting NH2 +
, all fragment ions appear at the expense of this ionic state. The photoelectron band corresponding to this ionic state, spreading over 24.5-30 eV [8], is structureless and fully dissociative in the Franck-Condon region along all the dissociation channels. NH+, N+, H2
+
and H+ are produced with large amounts of kinetic energy. It is also noteworthy to mention the constancy of threshold energies measured within the 2A1 energy range: ≈24.5, ≈26.6 and ≈28.5 eV. These peculiar energies are probably
related to the shape of the 2A1 hypersurface at these energies. The absence of NH2 +
in the 24.5-30 eV range, would find an explanation by its decomposition into H2+.
Using electroionization mass spectrometry, Morrison and Traeger [ 5 ] proposed a dissociation of NH3
as being a cascade of processes, i.e.
This point of view disagrees with the dissociation scheme resulting from the present work. Only NH2 +
gives rise to H+ and H2
+
, fragments not investigated by these authors. The importance of the neutral NH3* state is not
mentioned.
More realistic is the dissociation pathway proposed by Brion et al. [8]. The absence of NH2 +
formation through the 2A1 state agrees with the present results. However, the H2
+
fragment ions were not investigated in that work and the diagram displayed in fig. 4 shows that the 2E state contributes to the H+ ion production. An explanation of the "bump" mentioned by these authors in the 22-34 eV region could be the existence of the neutral NH3* state, found at 22.5 eV in the present work and playing a major role in the dissociation of NH3
+
.
The investigation of doubly ionized NH3 states and their dissociation were included in this work. The
Fig. 5. Dissociative ionization diagram of NH§+ in its five dissociation channels. Brackets show ion pairs (onset energies expressed in eV).
The ion pair NH2 +
/H+ has already been investigated by PIPICO [23] and its production at the expense of the 1A1 and
1
E states are confirmed in the present work. The production of both NH+/H+ and N+/H+ by the decomposition of the 1E(1e-2) state revealed in this work removes the remaining uncertainty [23]. Furthermore onset energies are determined at about 36 eV and these were ascribed to the dissociation of a 3E state not observed by PIPICO.
Acknowledgement
We acknowledge the Fonds de la Recherche Fondamentale Collective (FRFC), the Université de Liège and the Action de Recherches Concertées (ARC) of the Belgian Government for financial support.
References
[1] R. Locht, Ch. Servais, M. Ligot, F. Derwa and J. Momigny, Chem. Phys. 123 (1988) 443.
[2] R. Locht, Ch. Servais, M. Ligot, M. Davister and J. Momigny, Chem. Phys. 125 (1988) 425.
[3] M.M. Mann, A. Hustrulid and J.T. Tate, Phys. Rev. 58 (1940) 340.
[4] R.I. Reed and W. Snedden, J. Chem. Soc. (1959) 4132.
[5] J.D. Morrison and J.C. Traeger, Intern. J. Mass Spectrom. Ion Phys. 11 (1973) 277.
[6] T.D. Märk, F. Egger and M. Cheret, J. Chem. Phys. 67 (1977) 3795.
[7] G.R. Wight, M.J. van der Wiel and C.E. Brion, J. Phys. B 10 (1977) 1863.
[8] C.E. Brion, A. Hamnett, G.R. Wight and M.J. van der Wiel, J. Electron Spectry. 12 (1977) 323.
[9] N. Böse and W. Sroka, Z. Naturforsch. 26a (1971) 1491.
[11] K.C. Smyth, J.A. Schiavone and R.S. Freund, J. Chem. Phys 59 (1973) 5225.
[12] R. Locht, J.L. Olivier and J. Momigny, Chem. Phys. 43 (1979) 425; 49 (1980) 173.
[ 13] R. Locht and J. Momigny, Chem. Phys. Letters 138 (1987) 391.
[14] R. Locht and J. Schopman, Intern. J. Mass Spectrom. Ion Phys. 15 (1974) 361.
[15] Ch. Servais, R. Locht and J. Momigny, Intern. J. Mass Spectrom. Ion Phys. 71 (1986) 179.
[16] R. Locht, J. Schopman, H. Wankenne and J. Momigny, Chem. Phys. 7 (1975) 393.
[17] B. de B. Darwent, Bond dissociation energies in simple molecules, NSRDS-NBS 31 (Natl. Bur. Stds., Washington, 1970).
[18] G. Herzberg, Molecular spectra and molecular structure. Vol. 2. Diatomic molecules (Van Nostrand, Princeton, 1950).
[19] C.E. Moore, Atomic energy levels, Vol. 1, NBS Circular 467 (Natl. Bur. Stds., Washington, 1949).
[20] K.P. Huber and G. Herzberg, Molecular spectra and molecular structure, Vol. 4. Constants of diatomic molecules (Van Nostrand, Princeton, 1979).
[21] G. Bieri, L. Åsbrink and W. von Niessen, J. Electron Spec-try. 27 (1982) 129.
[22] J. Kurawaki and T. Ogawa, Chem. Phys. 86 (1984) 295.