HE4462
Hydrological Performance of Permeable Pavement as an Adaptive Measure in
Urban Areas: Case Studies Near Montreal, Canada
Catherine Vaillancourt
Eau Terre Environnement Research Centre, Institut National de la recherche scientifique, 490 Couronne St, Quebec G1K 9A9, Canada
Present Address: Quebec Ministry of Environment and Fight Against Climate Change, 100 Industriel Blvd, Repentigny, Quebec, J6A 4X6, Canada
Sophie Duchesne, Ph.D. * corresponding author
Eau Terre Environnement Research Centre, Institut National de la recherche scientifique, 490 Couronne St, Quebec G1K 9A9, Canada
Geneviève Pelletier, Ph.D.
Department of Civil and Water Engineering, Laval University, Quebec, Canada
Abstract
The infiltration capacity of permeable interlocking concrete pavement (PICP) was characterized on five sites located in the greater Montreal area (Canada). Surface infiltration rates up to more than 20,000 mm/h were observed, even in winter at sub-zero ºC temperatures. At one of the five monitored sites, rainfall and flow at the outlet were monitored for 12 months. This monitoring
revealed peak flow delays ranging from 4 min to 4 h 42 min and runoff reductions ranging from 26 to 98%, depending on the rainfall event. These rainfall and flow data were used to calibrate a PICP hydrologic model, which was then used to quantify the impact of implementing PICP in four real urban watersheds. For an eight-year rainfall series, simulations showed a reduction in volume (65%) and duration (21 to 48%) of overflows in the two combined sewer systems, a reduction in peak flow (6 to 45%) and volume (mean 30 %) at the outfall of the two separate systems, and a reduction in surface flooding duration (24 to 81 %) for the four sewer systems.
Introduction
The increase in impervious surfaces due to urbanization causes significant changes to the hydrologic cycle in urban areas. These changes include not only increased peak flows and runoff, but also reduced groundwater recharge (Aryal et al. 2016). These impacts can have consequences on drainage system performance, such as more frequent and greater storm sewer backups (Huong and Pathirana 2013), and on the water quality of streams (Hatt et al. 2004), consequences that are exacerbated by changes in precipitation patterns associated with climate change (Neuman et al. 2015). There are various solutions to mitigate the negative impact of urbanization on infrastructure and watercourses, including source control solutions, which contribute to the retention, infiltration and/or evaporation of runoff before it enters the storm sewer system. Among the most common source control systems are raingardens or bioretention systems, vegetative swales, filter strips, vegetated roofs, disconnected roof downspouts, rain barrels, separators (hydrodynamic or other), and permeable pavement and other types of pervious surfaces. These systems are designed to help runoff infiltrate the soil and, in some cases,
temporarily retain it. Permeable pavement can be continuous (pervious concrete, porous asphalt and recycled material surfaces), discontinuous (porous pavers and permeable interlocking concrete pavement), open (flagstones and geogrids) or loose (porous gravel and porous turf). All types of permeable pavement can replace impervious surfaces without sacrificing land use (Drake et al. 2013). They are suitable for public parking lots and residential driveways, and also for low-traffic-volume roads.
Permeable interlocking concrete pavement (PICP) is a particular type of discontinuous permeable pavement consisting of impervious concrete pavers that are designed to interlock. They are separated by joint filling materials that have a sufficiently high porosity to allow water to quickly infiltrate the surface (ICPI 2007). The water then goes into a reservoir layer with a large void volume for collecting and retaining the water. If the soil is too impervious to allow all the water to infiltrate, a perforated underdrain is added to the reservoir layer to help evacuate the excess water toward the storm sewer system (Eisenberg et al. 2015). Keeping the joints filled with granular material, avoiding the input of sediments from adjacent surfaces and cleaning the surfaces regularly can help maintain a high infiltration rate into the PICP reservoir layer. Brushes or street sweepers can be used to restore the infiltration capacity of joints when they are clogged with fine sediments. For more severe clogging, usually due to poor maintenance, interjoint material can be removed by vacuum sweepers and replaced with clean material.
Drake et al. (2013) conducted an exhaustive scientific literature review of the environmental performance of permeable pavement. This review includes a summary of the conclusions on hydrologic performance, impacts on water quality, longevity and functionality and maintenance
needs of permeable pavement systems. With regard to impacts on water quality, the removal rate of suspended solids (SS) and metals through this type of system was studied by Fassman and Blackbourn (2007; 2011), Pratt et al. (1989; 1995); Beecham et al. (2012), Drake et al. (2014b) and Huang et al. (2012). These studies concluded that water quality improved since the permeable pavement captured pollutants. These authors found that the concentration of suspended solids and heavy metals are reduced by at least 50% when stormwater filters through permeable pavement. With regard to hydraulic performance, Abbott and Comino-Mateos (2003), Collins et al. (2008), Fassman and Blackbourn (2010), Pratt et al. (1989; 1995), TRCA (2008), Huang et al. (2012), Drake et al. (2012; 2014a) and Kim et al. (2015) all showed, for various individual cases, that permeable pavement helps reduce peak flow rate and runoff volume in the storm sewer system during rainfall events. Among these authors, only Drake et al. (2014a), Drake et al. (2012), Huang et al. (2012) and TRCA (2008) demonstrated these effects in a harsh winter climate, with winter thaws, such as those occurring in southern parts of Canada. Other permeable pavement benefits mentioned in the literature include reducing the effects of heat islands (Eisenberg et al. 2015) and lowering the temperature of runoff released into the natural environment (Wardynski et al. 2013).
More specifically for PICP, the fact that only the joints, and not the pavers, are permeable increases the PICP’s resistance to cold (Thelen et al. 1978). Furthermore, the highly porous subbase limits frost heave, therefore increasing the pavers’ durability. PICP also allows the surface to continue being used even during intense rainfall events, since water quickly seeps through the pavement and does not form puddles. For this same reason, PICP helps prevent surface ice from forming in winter, which means abrasives and de-icing salt do not need to be
applied. Several recent studies evaluated the reduction in surface runoff volume (Wardynski et al. 2013; Huang et al. 2016; Winston et al. 2018; Braswell et al. 2018; Hu et al. 2018) and peak flow rates (Huang et al. 2016; Hu et al. 2018) when using PICP. In addition to these studies are the many more aimed at assessing the impact of PICP on water quality. In particular, research conducted by Winston et al. (2016), Brown and Borst (2015) and Drake et al. (2014b) involved PICP sites in cold climates. These studies found a significant improvement in water quality by capturing SS and reducing nutrients. All these studies, except that of Hu et al. (2018), were conducted at a site scale. Performances observed suggest that implementing PICP on a larger scale in urban areas would help improve the hydrologic behaviour of systems and reduce the impact of urbanization on the receiving environment. To our knowledge, only Hu et al. (2018) evaluated the impact of PICP at an urban subwatershed scale by using, though the study was limited because the model was not calibrated and a single event was used as input to this model.
In this context, the main objective of this study was to assess the permeable pavement’s performance at an urban watershed scale when it comes to i) protecting receiving bodies of water (peak flow rates and velocities, released volumes); and ii) reducing hydraulic dysfunctions (surface flooding due to surcharges) in storm sewer systems. These assessments were conducted in real urban sectors based on a hydrologic/hydraulic model integrating a calibrated permeable pavement module using rainfall and flow rate observations from a real PICP site.
Methodology
To reach the aforementioned main objective, a five-step method was applied: 1) Characterization of the PICP’s infiltration capacity; 2) Field observations and water balance at an instrumented
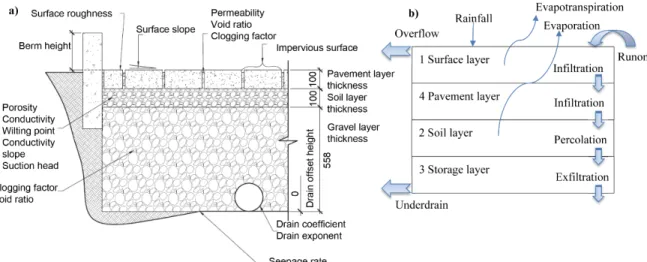
PICP site; 3) Hydrologic modelling of the instrumented site’s operation; 4) Design improvement; and 5) Modelling of real urban areas and impact assessment. In all cases, the permeable pavement used was the Inflo technology from Techo-Bloc, which consists of a PICP layer over a subbase storage layer composed of gravel, as shown in Figure 1a. The cost involved for the construction of this kind of infrastructure varies from site to site, but is in the order of 200 $CAD/m2 (materials and labor) including pavers, bedding layer, foundation, sub-foundation, borders and geotextile. The design of such PICP sites is usually performed in two steps, namely the hydrological design and the structural design. The final dimensions are selected to meet the requirements of both designs. For the structural design, engineers can refer to the manual recently published by ASCE (ASCE, 2018).
Characterization of the PICP’s infiltration capacity
The infiltration capacity was measured at five sites in the greater Montreal area (Quebec, Canada) where the Inflo technology is installed. Site characteristics are briefly described in Table 1. These sites, built between 2011 and 2014, support varying levels of traffic, ranging from light to heavy truck traffic (at the TB site). The infiltration capacity was measured in three different locations at each site, from two to five times between August 2015 and June 2016. The temperature during the tests ranged from -14ºC to 32ºC. The infiltration capacity was assessed according to C1781/C1781M-14a (ASTM 2015), where an infiltration ring was sealed to the surface of the pavement to determine in situ surface infiltration capacity of the permeable pavement with joints.
Field observations and water balance at an instrumented PICP site
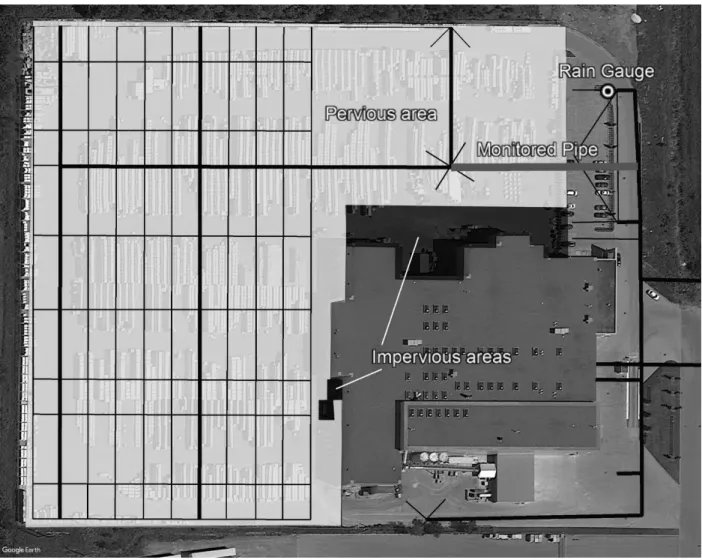
The TB site (Figure 2) was instrumented for three seasons (Sept. 2015 – Jan. 2016; Jun. - Dec. 2016; Apr. - Sept. 2017). The rear storage yard of this site consists of an area of 28,160 m2, of which 1,585 m2 are impervious and 26,575 m2 are permeable (PICP). On Figure 2, the red part, close to the building, is impervious (the pavement joints were sealed to protect the building against water infiltration) whereas the joints are permeable on the green part. The pavers forming the surface are made of impervious concrete, are rectangular (200 mm x 300 mm) and 100-mm thick, and are separated by 13-mm joints, filled with 2.5-10 mm diameter fine aggregate (in the permeable part). Under the layer of pavers is a base consisting of 100 mm of gravel (5-14 mm in diameter), then a subbase of 508 mm of gravel (25-75 mm in diameter). A filtering geotextile separates the subbase from the existing soil subgrade. The gravel base is drained by a dense system of 150-mm diameter perforated HDPE pipes surrounded by porous geotextile and installed directly on the subbase.
A tipping bucket rain gauge, the RG3-M model from Onset with a 0.2 mm resolution, was installed at the front of the site (see Figure 2). The rain gauge recorded the time and date of each bucket tip. These recordings are converted into rainfall depth at one-minute intervals with the filter tool of the HOBOware software supplied with the rain gauge. A MantaRay flowmeter from Greyline was installed in the outlet (monitored pipe) shown in Figure 2. This flowmeter continuously measures water velocity and depth using the Doppler principle in order to estimate flow, either in open channel or surcharge conditions. According to the manufacturer, this device
has an accuracy of 0.25% and a detection limit of 25.4 mm for water depth, along with an accuracy of 2% for velocity. The device was configured to record water velocity and depth every 30 seconds. Since the flowmeter could not withstand temperatures below -20°C, it was removed from the site between January 1 and March 31 each year.
Technical issues sometimes made it impossible to communicate with the rain gauge data logger, resulting in the loss of some precipitation data. Similarly, the difficulties related to the flowmeter’s accuracy and electrical supply prevented flow rates to be measured at the outlet during certain periods. Despite of these difficulties, data were collected for 17 rainfall events (see Table 2). These measurements were used to calculate, for each rainfall event, the proportion of runoff volume leaving the site and the peak flow delay, and to build a model describing the hydrology of the site, as described in the following section.
Hydrologic modelling of the instrumented site’s operation
The PCSWMM Low Impact Development (LID) module (CHI 2018), which is identical to the EPA SWMM5 LID module (Rossman and Huber 2016), was used to model the site as a succession of horizontal layers between which water transfers are calculated according to continuity equations specific to each type of stormwater management installation. The permeable pavement sites are represented as four layers, as shown in Figure 1b. On this Figure, the blue arrows represent water transfers which are calculated for every time step according to equations given in Rossman and Huber (2016). Figure 1 also shows the correspondence between the TB
site design and modelling parameters (Figure 1a) and the representation in the LID model in SWMM (Figure 1b).
The LID model parameters for the permeable pavement were divided into three categories: known, negligible and calibration (see Table 3). The known parameters are those whose value comes from site observations, plans or specifications. The only parameter considered as negligible was the clogging factor (due to the short duration of simulations). The parameters for model calibration are: field capacity, wilting point, saturated hydraulic conductivity and conductivity slope for the soil layer, exfiltration rate and drain coefficient.
The model was calibrated in three steps: i) preliminary calibration of parameters with an impact on runoff volume; ii) sensitivity analysis; and iii) final calibration. Firstly, values for the exfiltration rate, field capacity and wilting point parameters were adjusted so as to minimize the square of the relative error between the simulated and observed volume losses (i.e. rainfall volume subtracted from the volume passing through the outlet) for rainfall events #1, #2, #3, #12 and #14 (see Table 2), for which the flowmeter readings are the most reliable.
Secondly, a sensitivity analysis was conducted using 125 simulations varying the value of each calibration parameter. Parameters were changed one at a time and independently, and their effect on hydrographs was observed. Lastly, the value of all calibration parameters was adjusted in order to maximize the Nash-Sutcliffe model efficiency coefficient (Nash and Sutcliffe 1970) between simulated and observed flows, and to minimize the relative error between the total
simulated and observed volumes at the site’s outlet for events #1 and #13 (see Table 2). These two events were chosen since their duration and total depth were sufficient for presenting a hydrograph curve suitable for calibration purposes, in addition to having different average and maximum rainfall intensities. For this last calibration step, preliminary calibration values were used as a start value for the exfiltration rate, field capacity and wilting point. Sensitivity analysis results guided the adjustments.
Finally, the calibration results were validated by quantifying the difference between the observed and simulated flows at the site’s outfall (Nash-Sutcliffe coefficient and relative error on the total volume) for event #10, for which the 5-minute rainfall intensity is the greatest.
Design improvement
To improve the hydrologic performance of a PICP site compared with that observed at the TB site, the exfiltration rate, drain offset height and drain coefficient were modified. The calibration results along with those of previous surveys confirmed that the soil subgrade of the permeable pavement has very low permeability at the TB site, and therefore a low exfiltration rate. In the improved design model, the exfiltration rate was set at 0.12 mm/h, which remains low, even for soils containing clay (which varies from 0.3 to 2.2 mm/h according to MDDEP and MAMROT, 2011). At the TB site, the drains were installed directly at the bottom of the structure subbase. Increasing the drain offset height could conceivably result in a longer peak flow delay, and possibly increase the amount of water infiltrating the soil by extending retention (Collins et al. 2008). The drain was therefore raised by 50 mm in the improved design. Lastly, as shown in Figure 2, drain density in the foundation is very high at the TB site. The drain coefficient is a
parameter that combines several drain characteristics and dictates the speed at which the water is evacuated from the permeable pavement’s storage layer. In the improved design model, the drain coefficient was reduced by 50% compared with the calibration value, which is equivalent to reducing the drain density by a factor of 2. Note that this modification as well as raising the drain by 50 mm are feasible, and encouraged by the pavers manufacturer, since the TB site has been shown to be overdrained. The only drawback would be a longer emptying time for the storage layer after rain events, but this feature is usually expected from stormwater source control infrastructure such as PICP sites.
The impact of these three modifications (increase in exfiltration rate, increase in drain offset height and reduction in drain coefficient) on the total volume and peak flow at the outfall of the TB site, along with the peak flow delay, were evaluated by a SWMM simulation for the calibration and validation rainfalls, namely events #1, #10, #13 (see Table 2).
Modelling of actual urban areas and impact assessment
Permeable pavement cells were modelled in four watersheds of a Quebec municipality: two watersheds drained by combined sewer systems and two watersheds drained by separate systems. SWMM simulations were then performed for various rainfall scenarios in order to quantify the impact of implementing permeable pavement in an urban area. Figure 3 shows the location and SWMM models of the sectors involved. The SWMM models for these sectors had been previously calibrated, for the current situation without PICP, by the City where this sewer network is located, who provided the four SWMM models and the rainfall data. In all cases, the permeable pavement was modelled with the LID module using the improved values of the TB
site parameters. Table 4 provides a description of the modelled watersheds. For each of the watersheds, SWMM simulations were performed with the following input:
• Rainfall series measured at one-minute time steps from May 1 to November 30, for the years 2004 to 2011, with a rain gauge some 5 km from the modelled sectors;
• Synthetic rainfalls of the modified Chicago type with a three-hour duration and return periods of 2 and 10 years (used for design purposes in the case study municipality); • Events #1, #10 and #13 observed at the TB site (see Table 2).
The following indicators were then calculated:
• For the two watersheds drained by a combined sewer system: reduction of number, duration and volume of overflows for scenarios with and without permeable pavement; • For the two watersheds drained by a separate sewer system: reduction of peak flows and
volumes released at the outfall for scenarios with and without permeable pavement; and • For the four watersheds: reduction of duration and frequency of surface flooding for
scenarios with and without permeable pavement.
Results and Discussion
Characterization of PICP infiltration capacity
Infiltration rates were measured at different times during the year, on three occasions for each of the five sites (August 2015; October or November 2015; May or June 2016), and one additional time at the TB site (February 2016). Test results are presented in Table 1. All results, except one, show an infiltration rate ranging between 698 mm/h and 23,121 mm/h (average of 4,044 mm/h,
standard deviation of 4,200 mm/h). The only value outside this range (121 mm/h) was a measurement taken at the TB site, very close to a raised border, in an area where the permeable joints may have become clogged (see discussion below). However, high-traffic areas showed a high infiltration capacity (e.g. TB2 and TB3, from 1,490 to 3,775 mm/h). It was not possible to correlate the values obtained with the season. Infiltration capacities remained very high even in winter at sub-zero temperatures (e.g. from -3 to -5ºC in November 2015 and -14ºC in February 2016). In addition, due to the similar age of the sites (ranging from 2 to 5 years), it was not possible to study the impact of site age on infiltration capacity or clogging over time.
The infiltration capacities measured are similar to those referred to in previous studies for PICP sites, for example from 600 to 20,000 mm/h in Bean et al. (2004 and 2007); 4,000 mm/h in CIRIA (2007; cited in Hess and Ibe 2011); and more than 1,000 mm/h after 9 years without maintenance in Pratt et al. (1995). In addition, they are all above 250 mm/h (except the first measurement at TB1), which is the minimum value recommended by the Interlocking Concrete Pavement Institute and the National Concrete Ready Mix Association (Eisenberg et al. 2015). Contrary to what was observed at the five sites in this study, Huang et al. (2016) had observed a significant reduction of the infiltration capacity in winter at a PICP site in Calgary (Alberta, Canada). However, the reduction was caused by sand spread on the pavement surface for road maintenance. At the five sites monitored as part of this study, it was observed that spreading sand in winter at the PICP sites would be of little use since the pavement quickly drains the snowmelt and therefore ice build-up in winter is very rare.
The low infiltration capacity measured in August 2015 at TB1 (121 mm/h), which borders the PICP site, confirmed the previous results of Braswell et al. (2018), whereby the external contribution in sediments can clog PICP joints. Braswell et al. (2018) evaluated the hydrologic impact of a PICP site installed in series with a biofiltration box (Filterra® Bioretention), in North Carolina (United States) for 22 months. Due to the high ratio of impervious area drained to the PICP area (2.6:1), the authors observed significant clogging of the permeable pavement surface in this study. These results show the importance of preventing sediments from outside the PICP site from reaching permeable pavement surfaces. The use of efficient curbs is recommended.
Field observations and water balance at the TB site
Despite difficulties with measuring flow rates, data was collected for 17 rainfall events. Characteristics of these events are given in Table 2. In this table, Runoff/Rain corresponds to the runoff volume (integration of the flow measured at the outlet throughout the event) divided by the rainfall volume. Peak flow delay corresponds to the time interval between the occurrence of the maximum rainfall value recorded and the occurrence of the maximum flow rate. For a few of the rainfall events, no peak flow delay was observed since these events were relatively constant.
Results shown in Table 2 reveal that event duration ranged from 0.1 to 35 h, total depth ranged from 1 to 65.2 mm, peak flow delay ranged from 4 min to 4 h 42 min, and percentage of runoff ranged from 2 to 74%. The unrealistic runoff value (108%) of event #13 is explained by the fact that flow rate data for this event contained several reading errors that were corrected by replacing missing or atypical values by a linear interpolation between the available values.
The hydrologic monitoring results for the TB site were similar to those of previous studies. Wardynski et al. (2013) measured rainfall for three different PICP cells in the North Carolina Mountains along with the flow rate from these cells over a 7-month period in 2011. Out of the 54 rainfall events with over 2.5 mm of rain recorded during this period, an average runoff reduction from 78 to 100% was observed depending on the cells, with the greatest reduction for cells where the underdrain was raised in relation to the bottom of the storage layer. Huang et al. (2016) evaluated the storm runoff reduction of three types of permeable pavement, including PICP, in Calgary (Alberta, Canada). The runoff reduction was evaluated during tests where 4,500 L of water were released in 20 minutes on permeable pavement using tanks, to simulate an 80 mm/h rainfall. The authors observed peak flow reductions ranging from 19 to 64% for PICP and a runoff reduction of 10 to 15% for all types of permeable pavement; these low runoff reduction values are most likely related to the very intense simulated rainfall (i.e. the equivalent of 80 mm/h during 20 min). Winston et al. (2018), for their part, monitored rainfall and outlet flow rates during a year and a half at four permeable pavement sites, including three PICP sites, in northern Ohio (United States). The four sites were built on low permeability soils. Out of the 87 rainfall events recorded during the monitoring period, runoff reduction ranged from 16 to 100% for the PICP sites. No flow rate at the outlets of the sites was recorded for 4 to 78% of events, for a field capacity ranging from 3.0 to 25.2 mm, depending on the site.
Sensitivity analysis, calibration and validation of the TB site hydrologic model
The main observations from the sensitivity analysis conducted with the LID module on the TB site were: i) when the conductivity slope is low (< 18.75; for a 5 to 60 range), the hydraulic conductivity and the drain coefficient have virtually no effect on outlet flow rates; ii) the drain
coefficient is the parameter with the greatest impact on the shape of the hydrograph; and iii) several different combinations of values give practically the same hydrograph (equifinality).
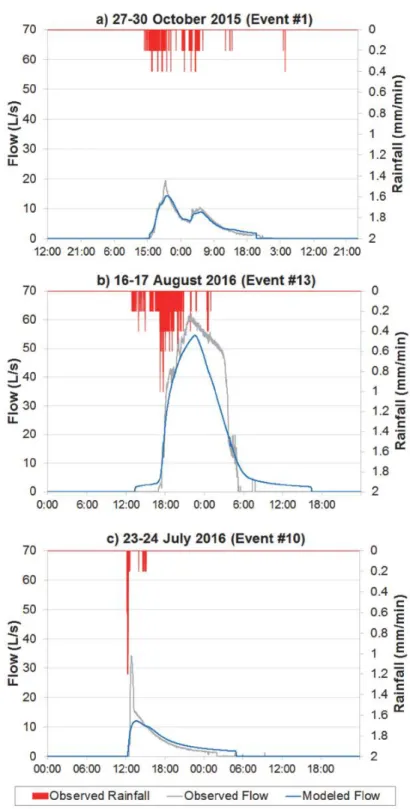
The value of parameters estimated during the calibration is given in Table 3. As mentioned previously, the values for the known parameters came from site observations, construction plans or specifications. The permeability of the pavement layer corresponds to the infiltration capacity that was measured previously. The observed infiltration capacities at the TB site were all higher than 1000 mm/h, which means that a rainfall of up to 1000 mm/h would infiltrate rapidly into the joints without creating any runoff. An arbitrary value of 150 mm/h was entered in the model, since no observed and/or simulated rain events showed a maximal rainfall intensity higher than 150 mm/h. This mean that using a value of 150 mm/h or higher for the permeability of the pavement layer would result exactly in the same simulated flow at the outlet. The Nash-Sutcliffe coefficient for events #1 (calibration), #13 (calibration) and #10 (validation) are respectively 0.97, 0.93 and 0.65, whereas the squared relative errors on volumes at the outlet are respectively -2.0%, -8.1% and 4.7% for the same events. Figure 4 shows the flow rates observed and simulated for events #1, #10 and #13.
The Nash-Sutcliffe coefficient values are greater than 0.90 for the two calibration events, which shows excellent concordance between simulated and observed flows rates. The Nash-Sutcliffe coefficient is also very high (0.65) in validation considering that this value was calculated using data observed and simulated at a one-minute time step. The relative error values on the volumes are also low. The simulated flow curves closely follow the rise and fall of the hydrographs
observed, except for the peak flow of event #10, which was underestimated by the model. This discrepancy could result from the very high maximum intensity of rainfall event #10 (62.4 mm/h over 5 min), which could have caused the flow rate to suddenly rise at the site outlet. Hydrographs in Figure 4 show that the calibrated model underestimates peak flows.The model should thus be used with caution when estimating the impact of PICP on peak flows and pipe surcharges. However, it is not the main objective of permeable pavement to reduce peak flows significantly and this underestimation would not have a significant impact on the runoff volume, especially for long rainfall series. Also, it should be recalled that difficulties with the measurements of flows at the outlet of the site were encountered for event #13. But since, for this event, the main measurement errors occurred during lower flows, it should not have an important impact on the calibration results. Finally, since the primary objective of calibrating the LID module at the TB site was to reproduce the average behaviour of a permeable pavement unit, the calibration results were deemed appropriate.
Improved design model
The hydrologic performance of the improved design model at the TB site, compared with the calibrated model, is shown in Figure 5. The results identified as “Combination” on this figure are those obtained when the exfiltration rate, the drain offset height and the drain coefficient are modified simultaneously. Figure 5 shows that simultaneously modifying these three parameters results in a reduction in outfall volume of 27 to 100%, depending on the events, a reduction in peak flow of 42 to 100%, and a peak flow delay that can reach more than 10 h. It should be noted that these improvements were made possible by very conservatively modifying these three parameters, in the sense that increasing drain offset height by 50 mm, reducing the number of
drains by half compared with the TB site, and installing the pavement’s foundation on soil with an infiltration rate of 0.12 mm/h, are conditions that can be commonly achieved in practice.
Modelling of actual urban area and impact assessment
Figure 6 summarizes the results regarding: i) reduction in overflows (for combined sewer systems), ii) reduction in flow/volume at the outfall (for separate sewer systems) and iii) reduction in surface flooding duration (for all systems), after adding PICP sites in the four sectors as modelled by SWMM for various rainfall scenarios. The reductions identified as “2004-2011” represent the mean reduction for the eight simulated years.
Results in Figure 6 show a significant reduction in the number, duration and volume of overflows, after adding PICP, for the two combined sewer systems and for all modelled rainfall scenarios. Particularly for the 2004 to 2011 rainfall series, a reduction of 21 to 48% of the duration and 26 to 65% of the total volume of overflows was noted, for each of the combined sewer systems. In the separate sewer systems, the reduction in volume at the outfall for the 2004-2011 series is 30%, whereas the reduction in peak flow for individual events ranges from 6 to 45%, depending on the sector and simulated rainfalls. Lastly, the surface flooding duration for the 2004-2011 series was reduced by 24 to 81%, depending on the sector. Despite the two sectors with a separate sewer system having similar overall characteristics (see Table 4), the fact that they have different configurations (see Figure 3) causes them to have a different hydrologic response.
These results are similar to those of the only other study found on the hydrologic performance of PICP at the subwatershed scale. Hu et al. (2018) evaluated flood risk mitigation by three types of permeable pavement, including PICP, on a 0.58 km2 and 74% impervious urban watershed. However, in their study they used a non-calibrated model (default parameters were applied) with only one intense rainfall event (113.8 mm in 12 h, including 83 mm in 2 h). For PICP, they simulated four scenarios (pavement in good or poor condition combined with two storage capacity levels). According to their simulations, these four scenarios led to a reduction in peak flow ranging from 12 to 32%.
Conclusion
The main objective of this study was to quantify the impact of implementing PICP in an urban area on the reduction of runoff to watercourses and the reduction of hydraulic malfunctions in storm sewer systems. At the site level, very high surface infiltration rates, up to more than 20,000 mm/h, were observed at five sites in the greater Montreal area (Quebec, Canada), even in winter at sub-zero ºC temperatures. These infiltration rates were sufficient to avoid surface runoff for the vast majority of rainfall events. The water that seeps through the pavement joints infiltrates a granular material foundation then leaves the site either by exfiltration in the soil subgrade or through underdrains to the municipal system. At one of the five monitored sites, the water flow in the drains and the rainfall were monitored for 12 months. This monitoring revealed peak flow delays ranging from 4 min to 4 h 42 min, and a runoff reduction ranging from 26 to 98%, depending on the rainfall event. It should be noted that the instrumented site was implemented on low permeability soil with a densely drained foundation. The site’s performance would possibly
have been better if it were on more permeable soil, or even with the same soil but with fewer drains and increased drain offset height, which was tested through simulations. Rainfall and flow data helped calibrate a PICP hydrologic model, which was used to quantify the impact of implementing PICP in four real urban watersheds.
The simulations showed a reduction in volume, duration and number of overflows in the two combined sewer systems, a reduction in peak flows and runoff for the two separate sewer systems along with a reduction in surface flooding duration for the four sectors studied. All results show the benefits of implementing PICP in urban areas. However, the impact of site age on the infiltration capacity of PICP could not be studied since the tested sites were all about the same age (no more than 5 years). Future work should allow the testing of infiltration rates over several years in order to monitor potential joint clogging and assess how various methods could either prevent clogging or re-establish initial infiltration rates. Technical problems with monitoring equipment also altered the quality of data and the number of rainfall events that could be properly monitored in this study. In the future, monitoring rainfall and flow at various sites would make it possible to assess the impact of different site characteristics (density and position of drains, foundation material, etc.) and therefore guide future designs. More generally, future research should focus on ways to integrate permeable pavement into a global sustainable urban stormwater management strategy that aims to mitigate the impacts of urbanization on receiving bodies of water.
The authors gratefully acknowledge the support of Lincoln Paiva from Techo-Bloc and of engineers working for the City that provided the SWMM model and rainfall data that were used for the simulations at the watershed scale. This study was funded by research grants from the Natural Sciences and Engineering Research Council of Canada and from Techo-Bloc. The authors are grateful to Computational Hydraulics Int. for the academic PCSWMM software license.
References
Abbott C. L., and Comino-Mateos, L. (2003). “In-situ hydraulic performance on a permeable pavement sustainable urban drainage system.” Water Environment J, 7(13), 187-190.
Aryal, S. K., Ashbolt, S., McIntosh, B.S., Petrone, K.P., Maheepala, S., Chowdhury, R.K., Gardener, T. and Gardiner, R. (2016). “Assessing and mitigating the hydrological impacts of urbanisation in semi-urban catchments using the storm water management model.” Water
Resour Manag, 30(14), 5437-5454.
ASCE (American Society of Civil Engineers). (2018). Permeable Interlocking Concrete Pavement. American Society of Civil Engineers, Reston, VA, USA.
ASTM (American Society for Testing and Materials). (2015). “Standard Test Method for Surface Infiltration Rate of Permeable Unit Pavement Systems”. ASTM International, West Conshohocken, PA, USA, 6 p.
Bean, E. Z., Hunt, W. F., and Bidelspach, D. A. (2007). “Field survey of permeable pavement surface infiltration rates.” J Irrig Drain Eng, 133(3), 249-255.
Bean, E. Z., Hunt, W.F., Bidelspach, D. A., and Burak, R. J. (2004). “Study on the surface infiltration rate of permeable pavements.” 1st Water and Environment Specialty Conference of the Canadian Society for Civil Engineering, 2-5 June 2004, Saskatoon, Canada.
Beecham, S., Pezzaniti, D., and Kandasamy, J. (2012). “Stormwater treatment using permeable pavements.” P I Civil Eng-Wat M, 165(3), 161-170.
Braswell, A.S., Anderson, A.R., and Hunt, W.F. (2018). “Hydrologic and water quality evaluation of a permeable pavement and biofiltration device in series.” Water, 10(1), 33. Brown, R., and Borst, M. (2015). “Nutrient infiltrate concentrations from three permeable
pavement types.” J Environ Manage, 164(1), 74-85.
CHI (2018). “PCSWMM - Advanced modeling software for stormwater, wastewater, watershed and water distribution systems.” 〈https://www.pcswmm.com〉 (Sept. 13, 2018).
CIRIA (Construction Industry Research and Information Association). (2007). The SUDS
Manual. CIRIA, London, UK, 937 p.
Collins, K., Hunt, W., and Hataway, J. (2008). “Hydrologic comparison of four types of permeable pavement and standard asphalt in Eastern North Carolina.” J Hydrol Eng, 13(12), 1146-1157.
Drake, J., Bradford, A., and Van Seters, T. (2014a). “Hydrologic performance of three partial-infiltration permeable pavements in a cold climate over low permeability soil.” J Hydrol Eng, 19(9), 04014016.
Drake, J., Bradford, A., and Van Seters, T. (2014b). “Stormwater quality of spring-summer-fall effluent from three partial-infiltration permeable pavement systems and conventional asphalt pavement.” J Environ Manage, 139, 69-79.
Drake, J., Bradford, A., and Marsalek, J. (2013). “Review of environmental performance of permeable pavement systems: state of the knowledge.” Water Qual Res J Can, 48(3), 203-222.
Drake, J., Bradford, A., Van Seters, T., and MacMillan, G. (2012). Evaluation of Permeable
Pavements in Cold Climates. Toronto and Region Conservation Authority (TRCA), Toronto,
Canada, 92 p.
Eisenberg, B., Collins, K., and Smith, D. (2015). Permeable Pavements. American Society of Civil Engineers, Reston, VA, USA, 262 p.
Fassman, E., and Blackbourn, S. (2011). “Road runoff water-quality mitigation by permeable modular concrete pavers.” J Irrig Drain Eng, 137(11), 720-729.
Fassman, E., and Blackbourn, S. (2010). “Urban runoff mitigation by a permeable pavement system over impermeable soils.” J Hydrol Eng, 15(6), 475-485.
Fassman, E., and Blackbourne, S. (2007). “Permeable pavement performance for use in active roadways in Auckland, New Zealand.” Second Low Impact Development Conference, Wilmington, NC, USA, p. 290-306.
Hatt, B. E., Fletcher, T. D., Walsh, C. J., and Taylor, S. L. (2004). “The influence of urban density and drainage infrastructure on the concentrations and loads of pollutants in small streams.” Environ Manage, 34(1), 112–124.
Hess, T. M., and Ibe, C. (2011). Evaluation of the Performance of Permeable Pavement at Lamb
Drove - Final. Department of Environmental Science and Technology, Cranfield University,
Cranfield, UK.
Hu, M., Zhang, X., Siu, Y., Li, Y., Tanaka, K., Yang, H., and Xu, Y. (2018). “Flood mitigation by permeable pavement in Chinese sponge city construction.” Water, 10(2), 172.
Huang, J., Valeo, C., He, J., and Chu, A. (2016). “Three types of permeable pavements in cold climates: Hydraulic and environmental performance.” J Hydrol Eng, 142(6): 04016025. Huang, J., Valeo, C., He, J., and Chu, A. (2012). “Winter performance of inter-locking pavers -
Stormwater quantity and quality.” Water, 4(4), 995-1008.
Huong, H. T. L., and Pathirana, A. (2013). “Urbanization and climate change impacts on future urban flooding in Can Tho city, Vietnam.”Hydrol Earth Syst Sc, 17, 379-394.
ICPI (2007). “The role of joint filling materials in permeable interlocking concrete pavements.”
Interlocking Concrete Pavement Magazine, May 2007, 16-18.
Kim, H., Jung, M., Mallari, K. J. B., Pak, G., Kim, S., Kim, S., Kim, L., and Yoon, J. (2015). “Assessment of porous pavement effectiveness on runoff reduction under climate change scenarios.” Desalin Water Treat,53 (11), 3142-3147.
MDDEP and MAMROT (2011). Guide de gestion des eaux pluviales. (in French) Ministère du Développement durable, de l'Environnement et des Parcs et Ministère des Affaires municipales, des Régions et de l'Occupation du territoire, Québec, Canada, 386 p.
Nash, J. E., and Sutcliffe, J. V. (1970). “River flow forecasting through conceptual models Part I - A discussion of principles.” J Hydrol, 10(3), 282-290.
Neumann, J. E., Price, J., Chinowsky, P., Wright, L., Ludwig, L., Streeter, R., Jones, R., Smith, J. B., Perkins, W., Jantarasami, L., and Martinich, J. (2015). “Climate change risks to US infrastructure: impacts on roads, bridges, coastal development, and urban drainage.” Climatic
Change, 131(1), 97-109.
Pratt, C.J., Mantle, D.G., and Schofield, P.A. (1995). “Research into the performance of permeable pavement, reservoir structures in controlling stormwater discharge quantity and quality.” Water Sci Technol, 32(1), 63-69.
Pratt, C.J., Mantle, D.G., and Schofield, P.A. (1989). “Urban stormwater reduction and quality improvement through the use of permeable pavements.” Water Sci Technol, 21(8-9), 769-778. Rossman, L. A., and Huber, W. C. (2016). Storm Water Management Model Reference Manual
Volume III – Water Quality. US Environmental Protection Agency, Office of Research and
Development, Cincinnati, OH, USA, 161 p.
Thelen, E., and Howe, L. F. (1978). Porous Pavement. The Franklin Institute Press, Philadelphia, PA, USA, 98 p.
TRCA (2008). Performance Evaluation of Permeable Pavement and a Bioretension Swale. Toronto and Region Conservation Authority, Toronto, Canada, 120 p.
Wardynski, B., Winston, R., and Hunt, W. (2013). “Internal water storage enhances exfiltration and thermal load reduction from permeable pavement in the North Carolina Mountains.” J
Hydrol Eng, 139(2), 187-195.
Winston, R., Dorsey, J., Smolek, A., and Hunt, W. (2018). “Hydrologic performance of four permeable pavement systems constructed over low-permeability soils in Northeast Ohio.” J
Hydrol Eng, 23(4), 04018007.
Winston, R., Dorsey, J. D., and Hunt, W. (2016). “Quantifying volume reduction and peak flow mitigation for three bioretention cells in clay soils in northeast Ohio.” Sci Total Environ, 553, 83-95.
Figure 1. a) PICP design and modelling parameters; and b) Representation in the LID module in SWMM (adapted from Rossman and Huber 2016).
Figure 4. Flow calibration results (a) Event #1, Oct. 27-30, 2015; and b) Event #13, Aug. 16-17, 2016; and c) validation results, Event #10 July 23-24, 2016
Figure 5. Results from the improved model at the TB site: a) reduction in outfall volume; b) reduction in peak flow; and c) peak flow delay
Figure 6. Results from the improved model: a) reduction in overflows; b) reduction in flow/volume at the outfall; and c) reduction in surface flooding
T able 1. Site characteristics and infiltration capacity (mm/h) Site * Constru ction Land use Surface area (m2) Sampl e Augus t 2015 Octobe r 2015 Novembe r 2015 Februar y 2016 May -June 2016 TB 2011 Industri al: road access for trucks and storage 28160 TB 1 121 698 1056 2101 1027 TB 2 2176 2104 1385 1335 1490 TB 3 1654 2739 1338 3775 n. a. PP 2012 Parking ≈ 2000 PP 1 5098 3746 5166 n. a. 1648 PP 2 5460 5808 3460 n. a. 5645 PP 3 4907 7939 4695 n. a. 7974 SM 2013 Emerge ncy road: infreque nt use; snow removed in winter ≈ 800 SM 1 2369 7383 1382 (snow) n. a. n. a. SM 2 1258 770 697 (snow) n. a. n. a. SM 3 3485 1532 Too cold to seal ring n. a. n. a. RV 2014 Parking ≈ 400 RV 1 5586 6052 3308 (snow) n. a. 2327 RV 2 1454 2324 1591 (snow) n. a. 2950 RV 3 7603 9471 Too cold to seal ring n. a. 9043 UD 2013 Access road to school parking ≈ 150 UD 1 n. a. n. a. n. a. n. a. 2014 UD 2 n. a. n. a. n. a. n. a. 2184 UD 3 23121 18065 Too cold to seal ring n. a. 1687
* TB = Techo-Bloc; PP = Patriots Park; SM = Saint-Martin; RV = Residences Vimont; and UD = Ulric-Debien
33
T able 2. R ainfall event and runoff characteristics
Event Date Total depth (mm) Duration (h) Mean intensity (mm/h) Max. 5 min intensity (mm/h) Runoff/ Rain
Peak flow delay (h:min) #1 2015-10-28 28.0 23.7 1.2 9.6 78% 2:45 - 2:20 (2 peaks) #2 2015-11-01 8.2 9.7 0.8 26.4 24% 0:10 #3 2015-11-06 3.2 1.3 2.5 0.8 4.5% 0:04 #4 2015-11-12 20.6 35.0 0.6 12.0 38% 0:17 #5 2015-11-27 13.2 13.3 1.0 7.2 26% 3:00 #6 2015-12-21 11.8 32.5 0.4 9.6 6% - #7 2015-12-23 6.8 3.9 1.7 9.6 14% - #8 2016-07-02 4.6 1.0 4.6 9.6 13% 0:13 #9 2016-07-22 5.0 0.5 10.1 19.2 10% 0:25 #10 2016-07-23 14.2 3.0 4.8 62.4 68% 0:36 #11 2016-07-25 3.0 7.1 0.4 12.0 3% 0:21 #12 2016-07-28 1.0 0.1 10.3 9.6 5% 0:24 #13* 2016-08-16 65.2 12.1 5.4 3.8 108% 4:42 #14 2016-08-31 1.4 0.4 3.2 4.8 78% 0:27 #15 2016-09-26 4.6 22.5 0.2 0.6 2% 0:29 #16 2017-06-12 2.2 0.2 13.2 14.4 4% 0:04 #17 2017-08-18 25.8 5.9 4.4 13.0 70% 0:51
34
T able 3. L I D parameter s for the T B site
Parameter Type Value
Limits (for calibration parameters) Surface layer
Berm height Known 150 mm
Roughness coefficient (Manning n) Known 0.013
Surface slope Known 1.14 %
Pavement layer
Thickness Known 100 mm
Void ratio Known 0.4
Impervious surface Known 0.9
Permeability Known 150 mm/h
Clogging factor Negligible 0
Soil layer
Thickness Known 100 mm
Porosity Known 0.3
Field capacity Calibration 0.110 0.100 – 0.250
Wilting point Calibration 0.10 0.01 – 0.10
Saturated hydraulic conductivity Calibration 9 mm/h 0 – 800 mm/h
Conductivity slope Calibration 19 5 - 60
Storage layer
Thickness Known 508 mm
Void ratio Known 0.4
Exfiltration rate Calibration 0.1 mm/h 0.0 – 1.3 mm/h
Clogging factor Negligible 0
Underdrain system
Drain coefficient Calibration 0.97 mm/h > 0
Drain exponent Known 0.5
35
T able 4. Description of the four case study urban watersheds
Watershed Drainage network type Watershed area (ha) Permeable pavement area (ha) Permeable pavement coverage (%) Industrial 1 Separate 13.7 6.35 46 Industrial 2 Separate 14.4 6.46 45 Combined 1 Combined 5.8 1.52 26 Combined 2 Combined 9.7 1.74 18