For Peer Review
Quantifying peat hydrodynamic properties and their influence on water table depths in peatlands of southern
Quebec (Canada)
Journal: Ecohydrology Manuscript ID ECO-17-0092.R1 Wiley - Manuscript type: Research Article Date Submitted by the Author: n/a
Complete List of Authors: Bourgault, Marc-André; UQAM Faculte des Sciences, Sciences de la Terre et de l'atmosphère; Universite du Quebec a Montreal Geotop
Larocque, Marie; Université du Québec à Montréal, Sciences de la Terre et de l'atmosphère; Universite du Quebec a Montreal Geotop
Garneau, Michelle; Université du Québec à Montréal, Geography; Universite du Quebec a Montreal Geotop
Roux, Marjolaine; UQAM Faculte des Sciences, Science de la terre et de l'atmosphère
Keywords: peatland, water table depth, hydraulic conductivity, specific yield, density, ecohydrology
For Peer Review
Quantifying peat hydrodynamic properties and their influence on water table 1
depths in peatlands of southern Quebec (Canada) 2
Marc-André Bourgault 1,2*, Marie Larocque1,2, Michelle Garneau2,3, Marjolaine
3
Roux1,2
4 5
1 Département des sciences de la Terre et de l’atmosphère – Université du Québec à Montréal, 6
C.P. 8888, succ. Centre-Ville, Montréal (QC), Canada, H3C 3P8
7
2 GEOTOP Research Center – Université du Québec à Montréal, C.P. 8888, succ. Centre-Ville, 8
Montréal (QC), Canada ; tel : 514-987-3000 ext. 1515 ; fax : 514-987-7749
9
3 Département de Géographie– Université du Québec à Montréal, C.P. 8888, succ. Centre-Ville, 10
Montréal (QC), Canada, H3C 3P8
11
* Corresponding author: [email protected] 12
Abstract 13
Water table depth in peatlands is strongly linked to physical properties of the peat, such 14
as density (ρdry), peat composition and humification, hydraulic conductivity (K), and
15
specific yield (-Sy-). Dry bulk density and peat depth are commonly used as indicators of
16
K in eco-hydrological models. However, no mathematical relationship exists to quantify 17
Sy based on K and ρdry. As a result, eco-hydrological models cannot explicitly reproduce
18
the strong buffering capacity of peatlands. The objectives of this study were to analyze 19
the literature-reported mathematical link between all the physical properties to develop 20
new mathematical relationships between these parameters, and to evaluate whether 21
variations in the physical properties of the peat control water table depth in peatlands. 22
Seven peatlands located in the St. Lawrence Lowlands (Québec, Canada) were sampled, 23
and 1 m-long peat cores were collected from up-gradient, mid-gradient, and down-24
gradient zones. All cores were used to measure ρdry, K, Sy, and to estimate peat
25
composition and humification. Statistically significant correlations were found between: 26
1) K and Sy (log-log model), 2) K and depth (log-log model), 3) Sy and depth (log-log
27
model), 4) ρdry and Sy (log model), and 5) ρdry and K (log model). No significant
28
difference was found in either K or Sy between sites. However, significant differences
29 3 4 5 6 7 8 9 10 11 12 13 14 15 16 17 18 19 20 21 22 23 24 25 26 27 28 29 30 31 32 33 34 35 36 37 38 39 40 41 42 43 44 45 46 47 48 49 50 51 52 53 54 55 56
For Peer Review
were found in water table depths. Because they provide a fuller description of the peat 30
properties that control water table depths, these newly developed functions have the 31
potential to improve the capacity of eco-hydrological models to simulate time-varying 32 hydrological conditions. 33 3 4 5 6 7 8 9 10 11 12 13 14 15 16 17 18 19 20 21 22 23 24 25 26 27 28 29 30 31 32 33 34 35 36 37 38 39 40 41 42 43 44 45 46 47 48 49 50 51 52 53 54 55
For Peer Review
Introduction 34
Peatlands are water-dependent ecosystems often connected to aquifers (Rossi et al., 35
2012) and rivers (Bourgault et al., 2014), and are characterized by an accumulation of 36
organic matter that exceeds its decomposition. The connectivity of peatlands to aquifers 37
and rivers, referred to as hydro-connectivity, and their capacity to accumulate and store 38
carbon depends on the water table depth (Ise et al., 2008), which is strongly influenced by 39
the physical properties of the peat (i.e., density (ρdry), peat composition and humification,
40
hydraulic conductivity (K), and specific yield (Ise et al.); (Kelly et al., 2014). 41
The parameters ρdry (Radforth and Brawner, 1977) and depth (Young and Klaiwitter,
42
1968) are commonly integrated in eco-hydrological models as indicators of K (Frolking 43
et al., 2010) to determine the facility with which water circulates through the organic 44
deposit (Fetter, 2001). However, no mathematical equations are reported in the scientific 45
literature to link ρdry and K to Sy. Even though Sy is known to vary strongly with depth
46
(Bourgault et al., 2016), this parameter is either not integrated in eco-hydrological models 47
(Frolking et al., 2010), or is considered constant (Morris et al., 2012). Since Sy controls
48
the storage capacity of the peat (Dettmann and Bechtold, 2016) and its water table 49
reactivity to precipitation (Bourgault et al., 2016), eco-hydrological models therefore 50
cannot explicitly reproduce the strong buffering capacity of peatlands (Waddington et al., 51
2015). This limits their capacity to reproduce water table depths. The limited extent of 52
literature-reported data partially explains the oversimplification in eco-hydrological 53
models. For example, even if a handful of studies have reported measurements of K 54
(Rosa and Larocque, 2008) and Sy (Lapen et al., 2000) across North America (Letts et al.,
55
2000; Quinton et al., 2008) and Europe (Baird, 1997; Baird et al., 2016; Holden and Burt, 56
2003a), data are still extremely limited in eastern Canada, where peatlands occupy large 57
surface areas.. 58
The objectives of this study were to analyze the literature-reported mathematical link 59
between ρdry, peat composition, humification, K, and Sy to develop new mathematical
60
relationships between these parameters, and to evaluate whether variations in the physical 61
properties of the peat control water table depths in peatlands. Measurements of ρdry, peat
62
composition and humification, K and Sy were performed on 47 peat cores in seven
63 3 4 5 6 7 8 9 10 11 12 13 14 15 16 17 18 19 20 21 22 23 24 25 26 27 28 29 30 31 32 33 34 35 36 37 38 39 40 41 42 43 44 45 46 47 48 49 50 51 52 53 54 55 56
For Peer Review
peatlands located in the St. Lawrence Lowlands (southern Quebec, Canada). Water table 64
variations were recorded over two summer periods at three locations (up-gradient, mid-65
gradient, and down-gradient) in all of the peatlands. 66
Site description 67
All seven studied peatlands (Covey Hill – CH, Large Tea Field – LTF, Sainte-68
Séraphine – SSE, Lac Cyprès – LCY, Victoriaville – VIC, Villeroy-VR, and Issoudun – 69
ISO) are located in the St. Lawrence Lowlands, with the exception of CH, which located 70
in the northernmost extension of the Adirondack Mountains (Figure 1). These peatlands 71
are located in the Châteauguay (CH, LTF), Nicolet (SSE, LCY, VIC), Bécancour (VR), 72
and Du Chêne (VR, ISO) watersheds, and are spread over a distance of 250 km in 73
southern Quebec (Canada). Five of the seven studied peatlands (LTF, SSE, LCY, VIC, 74
and ISO) have already been described in Bourgault et al. (2016), including their 75
geological context, micro-topography, peat thickness, vegetation composition, 76
humification, and hydro-climatic contexts. 77
The peatlands developed in different geological contexts, characterized by a wide 78
variety of quaternary surficial sediments (marine clay, fluvial sandy silt, clayey silty till, 79
aeolian fine to medium sand, and regressive marine sand) (Bourgault et al., 2016). The 80
CH site is an exception, having developed on fractured Cambrian sandstone of the 81
Potsdam Group (Levison et al., 2014). 82
Six sites (CH, LTF, SSE, VIC, VR, and ISO) are basin peatlands (National Wetlands 83
Working Group-NWWG, 1997) and are set in headwater conditions. LCY is a slope 84
peatland (as defined by NWWG, 1997) that developed on fine to medium sand dune 85
deposits. The peatlands are characterized by a micro-topography of alternating 86
hummocks and lawns. Hollows are only observed at ISO and VIC, while small shallow 87
pools are observed at VR. 88
Vegetation surveys performed at all sites show that Sphagnum spp. (Sph sp.), Kalmia 89
angustifolia (Kal ang), and Eriophorum vaginatum (Eri vag) were the main species for
90
all sites. Sphagnum spp. (Sph sp.), Kalmia angustifolia (Kal ang), and Rhododendron 91 3 4 5 6 7 8 9 10 11 12 13 14 15 16 17 18 19 20 21 22 23 24 25 26 27 28 29 30 31 32 33 34 35 36 37 38 39 40 41 42 43 44 45 46 47 48 49 50 51 52 53 54 55
For Peer Review
hollows, Sphagnum spp. (Sph sp.), Eriophorum vaginatum (Eri vag), and Carex spp (Car 93
sp.) were the dominant species. In shallow pools (only observed in VR), Sphagnum 94
cuspidatum (Sph cus) was found. In sites CH, SSE and VR, minerotrophic vegetation was
95
found at the margin of the peatlands and used to determine groundwater connectivity 96
(Table 1). Alnus rugosa (Aln rug), Iris versicolor (Iri ver) and Sphagnum spp. (Sph sp.) 97
were the common species of the minerotrophic zones. 98
All the peatlands began to accumulate following land emersion after the last 99
deglaciation, between ca. 10 770 cal BP (Larocque et al., 2013) in VR, and ca. 13 450 cal 100
BP in CH (Pellerin et al., 2007). Peatland areas range between 0.5 and 10.4 km2, and peat 101
thickness varies between 190 and 522 cm (Table 1). All the peatlands have central 102
ombrotrophic sections, and some have lateral minerotrophic sections (CH, SSE, and VR). 103
Rates of accumulation for the top meter of peat (only available for CH and VR) vary 104
between 0.6 and 1.1 mm.yr-1 for VR (Lavoie and Colpron-Tremblay, 2013) and between 105
0.01 and 4 mm.yr-1 for CH (Lavoie et al., 2013), and includes the acrotelm, in which peat 106
is partially decomposed. 107
Mean annual precipitation (1981 – 2010) varies between 929 mm (ISO) and 1114 mm 108
(LTF) (MDDELCC, 2017). For all sites, the minimum monthly precipitation occurs 109
during the winter, and the maximum is recorded during the summer. Mean annual 110
temperature (1981-2010) varies between 4.8 (ISO) and 6.7 °C (LTF). Minimum and 111
maximum temperatures are recorded in January and July respectively for the seven sites. 112
Methods 113
Field work was carried out between May 2014 and June 2016. Peat sampling sites 114
were located along a transect covering up-gradient, mid-gradient, and down-gradient 115
zones in all the peatlands. The three zones were identified using the digital elevation 116
model (1 x 1 m resolution) derived from airborne light detection and ranging survey 117
(LiDAR). Up-gradient was defined as the highest altitudinal zone, down-gradient the 118
lowest altitudinal zone and mid-gradient an intermediate zone. Distances between up-119
gradient and down-gradient wells varied between 123 and 760 m with mean slopes from 120
0.08% to 0.24% (see Bourgault et al. 2016). 121 3 4 5 6 7 8 9 10 11 12 13 14 15 16 17 18 19 20 21 22 23 24 25 26 27 28 29 30 31 32 33 34 35 36 37 38 39 40 41 42 43 44 45 46 47 48 49 50 51 52 53 54 55 56
For Peer Review
The LCY peatland does not include a mid-gradient location because of its small area 122
(0.5 km2). Twenty sampling locations were thus visited, and two 1 m-long peat cores 123
were sampled at each site using a Box corer. One additional peat core was sampled in 124
each of the up-gradient locations, for a total of 47 peat cores. Sampling compression was 125
measured in the field and ranged between 2 and 20 cm for all sites and locations. Mean 126
sampling compression was 4 cm for CH, 5 cm for LTF, 8 cm for SSE, 12 cm for LCY, 6 127
cm for VIC, and 2 cm for ISO. Peat gaps due to compression were not considered in the 128
analyses. Cores were cut into two 50 cm sections using a sharp knife, wrapped into two 129
half-cylinder PVC pipes (ρdry measurements) or rectangular plastic casings (K and Sy
130
measurements) for transportation, and stored at 4°C. In the laboratory, one core per 131
sampling location was used for ρdry measurements, one for K measurements, and one for
132
Sy measurement (Sy measurements were performed only in up-gradient locations). Water
133
table variations were recorded at the three locations within each site using wells 134
constructed from 3 cm OD PVC pipes, with 2 m long intakes perforated with 0.254 mm 135
slits equally spaced by 60 mm from top to bottom, and sealed at their base. All wells 136
were equipped with level loggers (Solinst) that recorded water table variations at hourly 137
intervals from June 2014 to May 2016. 138
Peat composition and humification 139
Peat composition and humification of the up-gradient core of each peatland were 140
described. Degree of humification was assessed directly in the field using the standard 141
von Post procedure (Von Post, 1922). In the laboratory, peat composition was describedat 142
4 cm intervals following the Troels-Smith (1955) method for up-gradient cores only. Peat 143
composition was described using a stereoscopic microscope and classified within four 144
groups, Turfa bryophytica, Turfa lignosa, Turfa herbacea, and Detritus granosus. 145
Dry bulk density (ρdry)
146
Twenty 1 m-long peat cores (two for LCY) were used to perform ρdry measurements
147
(Dean, 1974). To perform this analysis, all cores were frozen for three hours and then cut 148
with a sharp knife at 2 cm intervals, corresponding to a volume of 44 cm3. Each sliced 149
section was weighed, dried overnight at 105 ˚C, and weighed again. ρdry was calculated
150 3 4 5 6 7 8 9 10 11 12 13 14 15 16 17 18 19 20 21 22 23 24 25 26 27 28 29 30 31 32 33 34 35 36 37 38 39 40 41 42 43 44 45 46 47 48 49 50 51 52 53 54 55
For Peer Review
using the following equation, where W is the slice weight after drying and V is its 151 volume: 152 ߩௗ௬ = ௐ (1) 153
For all cores, means were calculated at 8 cm intervals so as to be comparable to K 154
and Sy measurements.
155
Hydraulic conductivity (K) 156
Twenty 1 m-long peat cores were cut into 343 cm3 (7 cm x 7 cm x 7 cm) samples, 157
for a total of 12 samples per core. In the laboratory, each cube was wrapped in a thin wax 158
film and submerged into liquid paraffin, as required for the Modified Cube Method 159
(MCM) (Surridge et al., 2005). The wax was removed from two sides of the cube to 160
measure horizontal saturated hydraulic conductivity (Kh; equivalent to Ksat) and the
161
samples were allowed to saturate overnight. The horizontal saturated hydraulic 162
conductivity (hereafter called K) was measured using a constant head permeameter 163
(Beckwith et al., 2003; Surridge et al., 2005). The waxed samples were placed on a 164
funnel connected to a graduated cylinder, and a thin film of water was maintained on 165
their upper face to produce a hydraulic gradient equal to one. By repeating the 166
experiment on each sample, discharge (Q) from the peat sample was measured three 167
times. Uncertainties between the three experiments were negligible for all samples (less 168
than 2%). Mean K was calculated using Darcy’s Law: 169
ܭ = ொ
(2)
170
where A (49 cm2) is the cross-sectional area and i (cm.cm-1) is the hydraulic gradient 171
(i = 1) . 172
Storage coefficient (Sy)
173
Bourgault et al. (2016) previously reported Sy variations with depth for five of the
174
studied peatlands (LTF, SSE, LCY, VIC, and ISO). The Sy values for the other two
175
peatlands (CH and VR) are reported here. These cores were cut into 8 cm3 samples for a 176
total of 12 samples per core. Sy measurements were performed on these samples using
177
the same gravity drainage experiments as those described in Bourgault et al. (2016). 178 3 4 5 6 7 8 9 10 11 12 13 14 15 16 17 18 19 20 21 22 23 24 25 26 27 28 29 30 31 32 33 34 35 36 37 38 39 40 41 42 43 44 45 46 47 48 49 50 51 52 53 54 55 56
For Peer Review
Gravity drainage was performed in acrylic cubes (8 cm3) and used to estimate Sy
179
following Eq. (2) (Freeze and Cherry, 1979), 180
ܵ =
∗∆ (3)
181
where Vd is the drained water volume (cm3), A is the area of the peat sample 182
(7 cm x 7 cm = 49 cm2), and ∆h is the water table fluctuation (cm). The peat samples 183
were soaked in water for 24 hours prior to the experiment, and then drained for 24 hours. 184
Each acrylic cube was connected at the bottom to a plastic tube with a diameter of 1.3 cm 185
attached to an adjustable base support to drain the samples. Each drainage experiment 186
began by decreasing the height of the plastic tube to that of the bottom of the tested 187
sample. Sy was measured twice on third of the sample to evaluate the experimental errors.
188
Data analysis 189
Tukey HSD analyses were performed to identify differences between peatlands and 190
between site locations, using a 99% confidence interval. Linear regression and non-linear 191
regression analyses were performed to identify relationships between K, Sy, ρdry, depth,
192
and median water table depth. All the mathematical analyses were performed using the R 193
statistical software (R environement, 2008) 194
Results 195
Water table depth
196
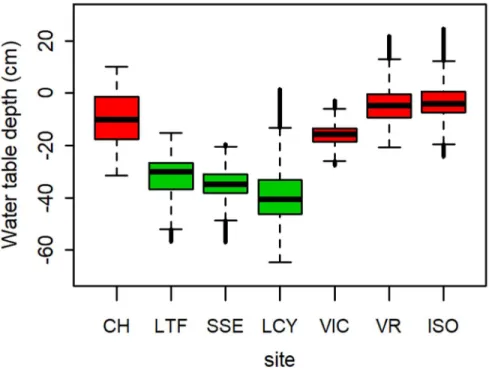
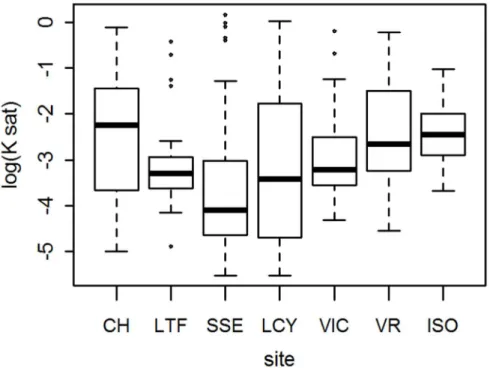
Water table depth for all the sites (CH, LTF, SSE, LCY, VIC, VR, and ISO) and 197
locations (up-gradient, mid-gradient, and down-gradient), including winter months when 198
snow accumulates at the surface, was between +25 cm (above peat surface) and -65 cm 199
(below peat surface). Significant differences were found between sites (Figure 2), with 200
median water table depths equal to -10 m for CH, -30 m for LTF, -35 m for SSE, -41 m 201
for LCY, -16 for VIC, -5 for VR, and -1 for ISO. Two groups could be distinguished. The 202
first group (CH, VIC, VR, and ISO), was characterized by shallow water table depths, 203
and the second group (LTF, SSE, and LCY) was characterized by a deeper water table 204
(Figure 2). However, no significant differences in water table depths were found within 205
each of the seven peatlands (e.g., up-, mid-, and down-gradient). 206 3 4 5 6 7 8 9 10 11 12 13 14 15 16 17 18 19 20 21 22 23 24 25 26 27 28 29 30 31 32 33 34 35 36 37 38 39 40 41 42 43 44 45 46 47 48 49 50 51 52 53 54 55
For Peer Review
Vegetation and humification207
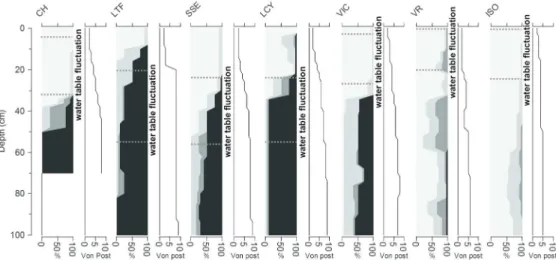
Acrotelm thickness (up-gradient locations) was 32 cm for CH, 57 cm for LTF, 57 cm 208
for SSE, 56 cm for LCY, 28 cm for VIC, 21 cm for VR, and 24 cm for ISO, and was 209
determined based on the minimum water table depth (Holden and Burt, 2003b) 210
(Figure 3). In all sites, the acrotelm is mainly dominated by Turfa bryophytica, with 211
varying percentages of Turfa lignosa (up to 40%) and/or Turfa herbacea (up to 30%) 212
and/or Detritus granosus (up to 50%) (Figure 3). In the cores from CH, LTF, SSE, LCY, 213
and VIC, a sharp transition from Turfa bryophytica to a highly decomposed Detritus 214
granosus peat was observed. The transitions were characterized by an increase in
215
humification from a non-decomposed Sphagnum-dominated fibric peat (≤ 20 cm) to a 216
highly decomposed sapric peat (≥ 55 cm), which was expected to strongly affect ρdry, K,
217
and Sy (Letts et al., 2000). The cores from VR and ISO were mainly composed of Turfa
218
bryophytica for the entire sequence, with interspersed layers of Turfa lignosa between
219
66-74 for VIC and Turfa herbacea between 34-60 cm for VR. 220
Dry bulk density 221
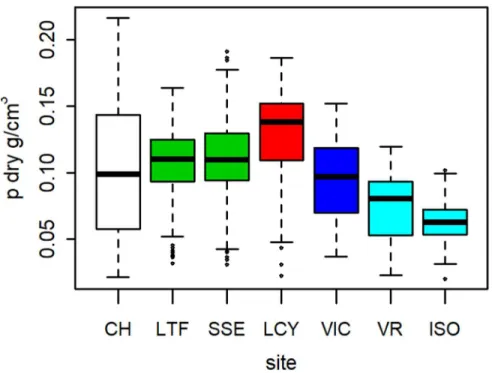
ρdry results varied between 0.02 and 0.22 g/cm3. Variance analysis of ρdry showed
222
significant difference between sites, with median ρdry equal to 0.06 g/cm3 for ISO,
223
0.08 g/cm3 for VR, 0.10 g/cm3 for VIC, 0.10 g/cm3 for CH, 0.11 g/cm3 for LTF, 0.11 224
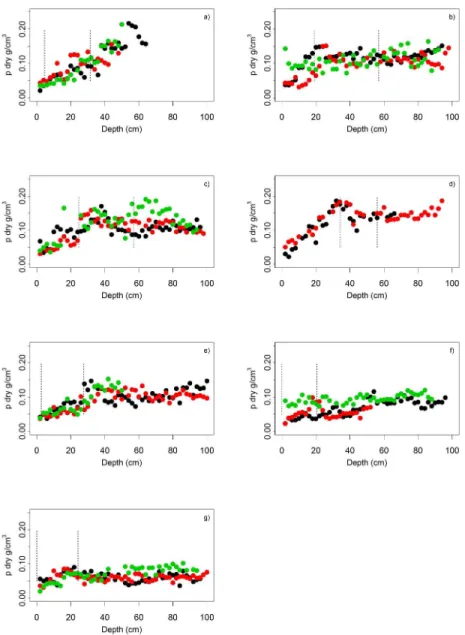
g/cm3 for SSE, and 0.14 g/cm3 for LCY (Figure 4). In sites CH, LTF, SSE, LCY and 225
VIC, a transition in slope was observed at a depth of 50 cm for CH, 20 cm for LTF, 35 226
cm for SSE, 35 for LCY, and 30 cm for VIC, and a maximum ρdry was reached at the
227
depth of the transition (Figure 5). In VR and ISO, the maximum ρdry was found at the
228
base of the cores (1 m depth). Two groups were distinguished, the first consisted of sites 229
CH, ISO, and VR, and the second of sites LCY, LTF, and SSE, with the VIC site being 230
between the two groups. No significant differences between site locations (up-gradient, 231
mid-gradient, down-gradient) were recordedwith regards to ρdry.
232
Hydraulic conductivity 233
Hydraulic conductivity results show strong variation in K, over nearly six orders of 234
magnitude between sites (Figure 6). Experimental errors on K were less than 2% and 235
considered negligible. The median K was 6.9x10⁻³ cm/s for CH, 5.1x10⁻⁴ cm/s for LTF, 236 3 4 5 6 7 8 9 10 11 12 13 14 15 16 17 18 19 20 21 22 23 24 25 26 27 28 29 30 31 32 33 34 35 36 37 38 39 40 41 42 43 44 45 46 47 48 49 50 51 52 53 54 55 56
For Peer Review
8.0x10⁻⁵ cm/s for SSE, 4.0x10⁻⁴ cm/s for LCY, 6.4x10⁻⁴ cm/s for VIC, 2.3x10⁻³ cm/s for 237
VR, and 3.5x10⁻³ cm/s for ISO, and show no significant difference between the sites. The 238
highest K value is 1.4 cm/s at site SSE, while the lowest is 0.000003 cm/s at site LCY, 239
with an overall median K value of 0.067 cm/s. 240
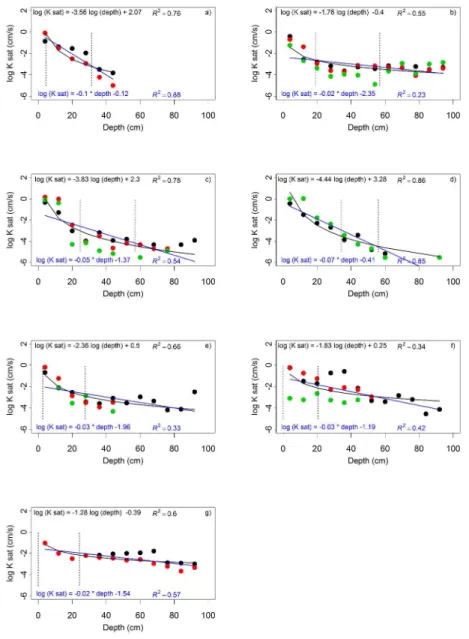
Similar to ρdry, two distinct rates of K decrease with depth were observed: a rapid
241
decrease observed within the upper part of the acrotelm, and a small decrease 242
corresponding to the catotelm (Figure 7). Regression models were used to represent the 243
decrease in measured K with depth. Models for log (K) – depth (see figure 7; blue lines) 244
and log (K) - log (depth) (see figure 7; black lines) were compared. Results show that the 245
log (K) - depth model best described CH (R2=0.88) and VR (R2=0.42), whereas the 246
log (K) - log (depth) model best described LTF (R2=0.55), SSE (R2=0.78), LCY 247
(R2=0.86), VIC (R2=0.66), and ISO (R2=0.60). However, the difference in R2 between the 248
two models for CH and VR is not significant compared to the difference in R2 between 249
the two models for LTF, SSE, LCY, VIC and ISO. Therefore, all sites are considered best 250
described using log (K) - log (depth) models. 251
Comparing figure 3 and figure 7, an increase in K is observed in Turfa bryophytica 252
peat layers between 22 and 34 cm and 60 and 82 cm for VR and in Turfa herbacea 253
between 66 and 74 cm for VIC. This pattern was not observed at the other sites. Finally, 254
no significant difference was observed between the different site locations, with the 255
exception of SSE and VR, where the Tukey HSD test (CI = 99%) identified a significant 256
difference for the down-gradient locations. 257
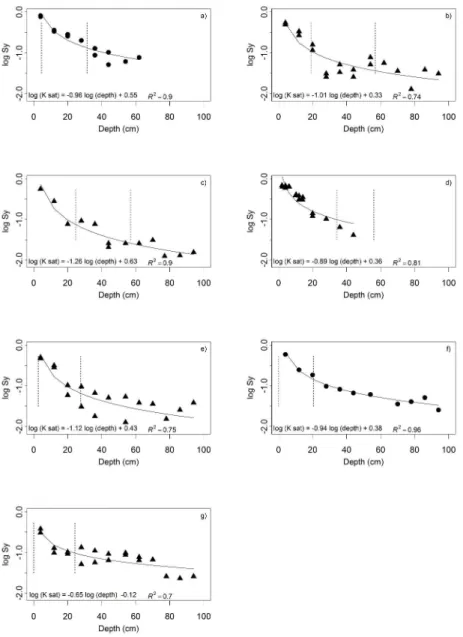
Storage coefficients 258
Result of Sy using the MCM method varied between 0.01 and 0.82 (Figure 8).
259
Similarly to K, a rapid change in rates of decrease is observed for all peat cores 260
(Figure 9). This rapid decrease is restricted to the acrotelm, with a median Sy of 0.27 for
261
all sites, whereas a slow decrease is observed in the catotelm, with a median Sy of 0.05
262
for all sites. Median Sy were 0.16 for CH, 0.05 for LTF, 0.03 for SSE, 0.38 for LCY, 0.05
263
for VIC, 0.06 for VR, and 0.09 for ISO, and showed significant differences only between 264
LCY and ISO. Based on previous results from Bourgault et al. (2016), no significant 265 3 4 5 6 7 8 9 10 11 12 13 14 15 16 17 18 19 20 21 22 23 24 25 26 27 28 29 30 31 32 33 34 35 36 37 38 39 40 41 42 43 44 45 46 47 48 49 50 51 52 53 54 55
For Peer Review
differences in Sy were observed across locations (i.e., up-gradient, mid-gradient, and
266
down-gradient) in sites LTF, SSE, LCY, VIC, and ISO. 267
Mathematical relationships between ρdry, K, Sy, and peat depth
268
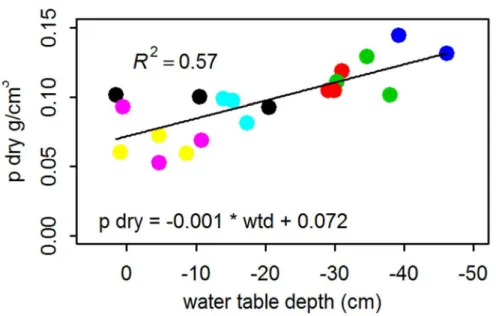
Strong correlations were found between median water table depth and ρdry (Figure 10),
269
K and depth (see figure 11), Sy and depth (see figure 12), K and ρdry (see figure 13), ρdry
270
and Sy (see figure 14), and Sy and K (see figure 15). No correlation was found between
271
median water table depth and K (R2 = -0.05), or median water table depth and Sy
272
(R2=0.13). K-depth (figure 11), Sy-depth (figure 12), and Sy-K (figure 15) relationships
273
were best modelled using log-log functions: 274
logሺݕሻ = ߙ ∗ logሺݔሻ + ߚ (3)
275
where y is the dependant variable (e.g. Sy, K), x is the independent variable (e.g. depth,
276
ρdry) and α and β are constants controlling the curvature of the relationship. Calculated α
277
and β varied respectively from -3.74 to -2.56 and from 1.26 to 3.17 for K-depth 278
relationship (figure 11), from 0.32 to 0.40 and from 0.28 to 0.56 for Sy-depth relationship
279
(figure 12), and from 0.33 to 0.40 and from -0.19 to 0.02 for Sy-K relationship (figure
280
15). K-ρdry (figure 13) and Sy-ρdry (figure 14) were best modelled using semi-log
281
functions: 282
ݕ = ߙ ∗ logሺݔሻ + ߚ (4)
283
where calculated α and β varied respectively from -33.90 to -25.01 and from 0.57 to 0.29 284
for K-ρdry relationship (figure 13) and from -10.20 to -5.87 and from -0.53 to -0.12 for Sy
-285
ρdry relationship (figure 14). Results from this study were compared to the K-ρdry
286
relationship developed by Radforth and Brawner (1977) and included in the Holocene 287
peat model (HPM; Frolking et al., 2011) (figure 13), and the model of K-depth developed 288
by Young (1968), which is included in the Digibog model (Baird et al., 2012) (figure 11). 289
Discussion 290
Functional correlations between K, Sy, ρdry, and depth
291
K, Sy, and ρdry values measured in this study were well within the ranges of values
292
reported in the literature. Baird et al. (2016) showed that K can vary between 10-1 cm/s 293 3 4 5 6 7 8 9 10 11 12 13 14 15 16 17 18 19 20 21 22 23 24 25 26 27 28 29 30 31 32 33 34 35 36 37 38 39 40 41 42 43 44 45 46 47 48 49 50 51 52 53 54 55 56
For Peer Review
and 10-5 cm/s within the first meter of peat sequences. From their data compilation, 294
Dettmann and Bechtold (2016) have shown that Sy varies between 0.01 and 0.95 within
295
the first 50 cm of peat. Compiled values of ρdry reported by Loisel et al. (2014) for
296
different types of peatlands around the world vary mainly between 0.05 and 0.20 g/cm3, 297
with a mean value of 0.10 g/cm3. 298
The strong correlations for the K-depth, Sy-depth, and K-ρdry, relationships are 299
consistent with the equations used in models (Baird et al., 2012; Frolking et al., 2010) 300
and field data based studies (Bourgault et al., 2016; Dettmann and Bechtold, 2016; 301
Morris et al., 2015). The equation used in the HPM for the K-ρdry relationship
302
overestimates results from this study (see figure 13). This is explained by the fact that the 303
K-ρdry relationship used in the model was derived from sites that might not have been
304
located in a similar hydrogeological context. Moreover, because K has been shown to be 305
a sensitive parameter in the HPM (Quillet et al., 2013), it would be advisable to include 306
the possibility for a region-specific or site-specific K-ρdry relationship to be used. The
307
exponential function of Young (1968), describing the K-depth relationship, 308
underestimates K values of the present study in the top 10 cm and overestimates K values 309
between 20 and 60 cm (see figure 11). This underestimation of surface K could have an 310
important effect on simulated peatland hydrodynamics, since the surface layer controls 311
water table variations, and therefore water flow velocities. Additionally, figure 15 shows 312
a strong positive correlation of Sy as a function of K. This is also important, as it
313
demonstrates a quantitative relationship between these two parameters in peatlands. 314
Finally, a relationship was identified to link Sy and ρdry (figure 14) that could be included
315
in models using ρdry as an indicator of K and Sy.
316
However, higher K at the surface and lower K at the bottom of a peatland is not 317
always observed (see figure 7). As explained by Baird et al. (2016), stratigraphic changes 318
in vegetation assemblages and decomposition, within the catotelm, can modify the peat 319
pore structure and result in K values equal to or exceeding values usually found in 320
shallow, near-surface peat. In the present study, this was observed at VR, with higher K 321
values found between 22 and 34 cm and 60 and 82 cm (see figure 7.f), where peat was 322 3 4 5 6 7 8 9 10 11 12 13 14 15 16 17 18 19 20 21 22 23 24 25 26 27 28 29 30 31 32 33 34 35 36 37 38 39 40 41 42 43 44 45 46 47 48 49 50 51 52 53 54 55
For Peer Review
less decomposed and dominated by Turfa bryophytica. These conditions can favor local 323
peatland-aquifer connectivity. 324
Additionally, in VR and SSE, K values were lower in down-gradient locations (i.e., 325
close to the peatland margin; see figure 7.c). This reinforces the results from Lapen et al. 326
(2005), which raised the importance of this lower peatland margin in maintaining an 327
elevated water table within the peat deposits. According to Baird (2016), the finding of 328
significant difference regarding the hydraulic properties between the different locations 329
within the peatlands is crucial because it shows the importance of different-scale features 330
(e.g. micro-topography, patterning, raised bog, margin) in the understanding of peatlands 331
function both hydrologically and ecologically. 332
Therefore, the quantitative relationships developed in this paper should be used 333
cautiously considering that spatial heterogeneity in peatlands is common. The different 334
functions and their parameters variability could be tested using models. Additionally, the 335
similarity between the relationships developed in this work and the relationships 336
available in the literature suggests that generalization is conceivable. A community effort 337
to assemble existing unpublished data should be considered to validate the newly 338
developed relationships. 339
Water table depth in peatlands 340
In modelling studies, peatlands are generally conceptualized with a highly conductive 341
upper layer, corresponding to the acrotelm (high K, high Sy, low ρdry,and low
342
humification), and a low conductivity bottom layer, corresponding to the catotelm (low 343
K, low Sy, high ρdry, and high humification) (Baird et al., 2008). In this study, the
344
transition was observed within the top 50 cm of peat, similar to what has been reported in 345
the literature (see figure 11 and figure 12). For many authors, this strong vertical 346
variation in hydrodynamic properties is crucial to understanding differences in water 347
table depth. Peatlands characterized by a more conductive upper layer are expected to 348
have a lower median water table depth and peatlands with a less conductive upper layer is 349
expected to have a higher median water table depth. However, this is not what was 350
observed in this study. 351 3 4 5 6 7 8 9 10 11 12 13 14 15 16 17 18 19 20 21 22 23 24 25 26 27 28 29 30 31 32 33 34 35 36 37 38 39 40 41 42 43 44 45 46 47 48 49 50 51 52 53 54 55 56
For Peer Review
In this study, significant differences in ρdry and water table depths were found between
352
sites, but no significant differences in K and Sy were observed. Moreover, no correlation
353
was found between the hydrodynamic properties and water table depth. This suggests that 354
factors other than K and Sy of peat (e.g., hydro-connectivity, climate) are probably
355
involved in the control of water table depth. Moreover, since all sites are located in a 356
similar climatic context, it is hypothesized that the connectivity between each peatland 357
and a neighbouring river or superficial aquifer should be considered and included as 358
control factors of water table depth (Winter, 2001). 359
Implications for eco-hydrological models 360
As discussed in Baird et al. (2016), a physically based representation of peat 361
hydrology should account for both K and Sy. In indicator-based models, such as the
362
HPM, K is quantified using ρdry and is used to model the yearly variation in water table
363
depth. However, Sy is not represented. In models solving the Darcy flow equation (e.g.,
364
Modflow, Digibog), Ksat is vertically discretized as a function of depth and only Digibog
365
has integrated Sy (constant value). The absence or the simplification of Sy limits the
366
ability of eco-hydrological models to quantify water table fluctuations in peatlands, and 367
therefore to reproduce their daily and monthly hydrodynamics. And, since peat 368
accumulation and decomposition processes are highly dependent on water table depth 369
(Belyea and Clymo, 2001; Blodau and Moore, 2003; Moore and Dalva, 1993), simulating 370
carbon dynamics without adequately describing the vertical changes of Sy with depth
371
poses a challenge. This is especially true when considering that droughts, which occur on 372
a short time scale, can transform a temperate peatland from a carbon sink to a carbon 373
source (Fenner and Freeman, 2011). Moreover, Sy is a necessary component of transient
374
modelling. Therefore, the quantification of Sy should be a priority in any modelling
375
application aiming to downscale eco-hydrological models. Such downscaling is 376
becoming more and more important, because peatlands store large amount of carbon 377
(Fenner and Freeman, 2011) and can be strongly affected by extreme climatic events, 378
such as drought and extreme precipitation. 379
This work provides new functions that could be included in eco-hydrological models. For 380
example, the HPM, which describes the accumulation and decay of peat with a definition 381 3 4 5 6 7 8 9 10 11 12 13 14 15 16 17 18 19 20 21 22 23 24 25 26 27 28 29 30 31 32 33 34 35 36 37 38 39 40 41 42 43 44 45 46 47 48 49 50 51 52 53 54 55
For Peer Review
of annual peat layers (Frolking et al., 2010), could integrate the newly developed 382
relationship between Sy and ρdry (see figure 14). Using this function would allow to the
383
water table depth to be better determined following precipitation, and therefore the model 384
to be temporally downscaled. Users of models based on the groundwater flow equation or 385
Darcy’s law, such as Digibog (Baird et al., 2012), could use the new equation describing 386
Sy as a function of depth (see figure 12) to better discretize the vertical variation of Sy
387
within the peat profile. If K values are available, they could be used to estimate 388
unavailable Sy values (see figure 15). The use of these new equations would facilitate
389
model calibration, provide more reliable peatland hydrology models, and contribute to a 390
better understanding of peat accumulation and decomposition on short time scales 391
(Belyea and Clymo, 2001; Blodau and Moore, 2003; Moore and Dalva, 1993). 392
However, as demonstrated in this study, describing the hydrodynamic properties that 393
control water table fluctuations in peatlands and which are strongly linked to density 394
profiles, is not sufficient to fully understand differences in water table depths between 395
different sites. It is thus crucial to better understand how the connectivity of peatlands 396
with aquifers and rivers can influence peatland hydrology. 397
Conclusion 398
The objectives of this study were to quantify relationships between ρdry, depth, K, and Sy,
399
to be used in hydrological models, to develop new functions that could improve eco-400
hydrological models, and to evaluate whether differences in water table depths of 401
peatlands located in the St. Lawrence lowlands could be linked to vertical variations in 402
hydrodynamic properties. The first and the second objectives were achieved by revisiting 403
two functions (K-ρ dry; K-depth) and developing three new functions (K-Sy; Sy-depth; 404
Sy-ρ dry) that could be integrated in future eco-hydrological models. These functions 405
could lead to better model calibration, and alleviate the necessity for intensive laboratory 406
measurements, while including peatlands in regional models and improving existing 407
steady-state models. Importantly, in eco-hydrological models, these functions could 408
contribute to downscaling models to include processes occurring at smaller time scales 409
and to improving models to better describe flow dynamics within peatlands by including 410
Sy. The third objective was achieved by comparing the statistical relationships between
411 3 4 5 6 7 8 9 10 11 12 13 14 15 16 17 18 19 20 21 22 23 24 25 26 27 28 29 30 31 32 33 34 35 36 37 38 39 40 41 42 43 44 45 46 47 48 49 50 51 52 53 54 55 56
For Peer Review
water table depth and ρdry, depth, K, and Sy, and evaluating the strength of the correlation
412
between all variables. A significant relationship between ρdry and water table depth was 413
found, but there was no significant difference in K or Sy between the sites. A good linear 414
correlation (R2 = 0.57) was found between ρdry and water table depth, but this is not the 415
result of a difference in hydrodynamic properties. It is therefore crucial to better 416
understand how the connectivity of peatlands with aquifers and rivers can influence water 417
table depth in peatlands, although considerable improvements to hydrological modelling 418
of peatlands are expected using the current results. 419
Acknowledgments 420
This research was funded by the Quebec Ministry of Environment (Ministère du 421
Développement durable, de l’Environnement et de la Lutte contre les changements 422
climatiques), by local municipalities, by MITACS Accelerate, by the Nature 423
Conservancy of Canada, and by a scholarship from the Fonds de recherche du Québec 424
Nature et technologies (FRQNT). The authors would like to thank the Nature 425
Conservancy of Canada for providing access to the LTF and CH sites and private 426
landowners for making their properties available for this study (ISO, LCY, SSE, VIC, 427
VR). Finally, the authors thank Anne Quillet, Jill Vandermeerschen, the SCAD-UQAM 428
(Service de consultation en analyse de données), Sylvain Gagné, and Simon Marcotte for 429
their support with scientific results, statistical analyses, and field work. 430
References 431
Baird, A.J., 1997. Field estimation of macropore functioning and surface hydraulic 432
conductivity in a fen peat. Hydrological Processes 11(3), 287-295. 433
Baird, A.J., Eades, P.A., Surridge, B.W.J., 2008. The hydraulic structure of a raised bog 434
and its implications for ecohydrological modelling of bog development. Ecohydrology 435
1(4), 289-298. 436
Baird, A.J., Milner, A.M., Blundell, A., Swindles, G.T., Morris, P.J., 2016. Microform-437
scale variations in peatland permeability and their ecohydrological implications. Journal 438
of Ecology 104(2), 531-544. 439
Baird, A.J., Morris, P.J., Belyea, L.R., 2012. The DigiBog peatland development model 440
1: rationale, conceptual model, and hydrological basis. Ecohydrology 5(3), 242-255. 441
Beckwith, C.W., Baird, A.J., Heathwaite, A.L., 2003. Anisotropy and depth-related 442
heterogeneity of hydraulic conductivity in a bog peat. II: modelling the effects on 443
groundwater flow. Hydrological Processes 17(1), 103-113. 444 3 4 5 6 7 8 9 10 11 12 13 14 15 16 17 18 19 20 21 22 23 24 25 26 27 28 29 30 31 32 33 34 35 36 37 38 39 40 41 42 43 44 45 46 47 48 49 50 51 52 53 54 55
For Peer Review
Belyea, L.R., Clymo, R.S., 2001. Feedback control of the rate of peat formation. 445
Proceedings of the Royal Society of London. Series B: Biological Sciences 268(1473), 446
1315-1321. 447
Blodau, C., Moore, T.R., 2003. Experimental response of peatland carbon dynamics to a 448
water table fluctuation. Aquatic Sciences 65(1), 47-62. 449
Bourgault, M., Larocque, M., Garneau, M., 2016. Quantification of peatland water 450
storage capacity using the water table fluctuation method. Hydrological Processes 31(5), 451
184-199. 452
Bourgault, M., Larocque, M., Roy, M., 2014. Simulation of aquifer-peatland-river 453
interaction under climate change. Hydrology Research 45(3), 425-440. 454
Dean, W.E., 1974. Determination of carbonate and organic matter in calcareous 455
sediments and sedimentary rocks by loss on ignition: comparison with other methods. 456
Journal of Sedimentary Petrology(44), 242-248. 457
Dettmann, U., Bechtold, M., 2016. Deriving effective soil water retention characteristics 458
from shallow water table fluctuations in peatlands. Vadose Zone Journal 15(10), 1-13. 459
Environment Canada, 2016. Historical data: 460
http://climate.weather.gc.ca/historical_data/search_historic_data_e.html.
461
Fenner, N., Freeman, C., 2011. Drought-induced carbon loss in peatlands. Nature 462
Geoscience 4(1), 895-900. 463
Fetter, C.W., 2001. Applied hydrogeology, Fourth edition ed. Prentice-Hall, Upper 464
Saddle River, New Jersey, USA. 465
Freeze, R., Cherry, J., 1979. Groundwater. Prentice-Hall, Englewood Cliffs, New Jersey, 466
USA. 467
Frolking, S., Roulet, N.T., Tuittila, E., Bubier, J.L., Quillet, A., Talbot, J., Richard, 468
P.J.H., 2010. A new model of Holocene peatland net primary production, decomposition, 469
water balance, and peat accumulation. Earth System Dynamics 1(1), 1-21. 470
Holden, J., Burt, T.P., 2003a. Hydraulic conductivity in upland blanket peat: 471
measurement and variability. Hydrological Processes 17(6), 1227-1237. 472
Holden, J., Burt, T.P., 2003b. Hydrological studies on blanket peat: the significance of 473
the acrotelm-catotelm model. Journal of Ecology 91(1), 86-102. 474
Ise, T., Dunn, A.L., Wofsy, S.C., Moorcroft, P.R., 2008. High sensitivity of peat 475
decomposition to climate change through water-table feedback. Nature Geoscience 1(11), 476
763-766. 477
Kelly, T.J., Baird, A.J., Roucoux, K.H., Baker, T.R., Coronado, E.N.H., Rios, M., 478
Lawson, I.T., 2014. The high hydraulic conductivity of three wooded tropical peat 479
swamps in northeast Peru: measurements and implications for hydrological function. 480
Hydrological Processes 28(9), 3373-3387. 481
Lapen, D.R., Price, J.S., Gilbert, R., 2000. Soil water storage dynamics in peatlands with 482
shallow water tables. Canadian Journal of Soil Science 80(1), 43-52. 483
Larocque, M., Colpron-Tremblay, J., Lavoie, M., Tremblay, L., 2013. Écohydrologie de 484
la grande tourbière de Villeroy. Québec, Canada, p. 60. 485
Lavoie, M., Colpron-Tremblay, J., 2013. Étude paléoécologique de la Grande-Tourbière-486
de-Villeroy. Rapport déposé au Ministère du Développement Durable, de 487
l'Environement, de la Faune et des Parcs, Québec, Canada, p. 37. 488
Lavoie, M., Pellerin, S., Larocque, M., 2013. Examining the role of allogenous and 489
autogenous factors in the long-term dynamics of a temperate headwater peatland 490 3 4 5 6 7 8 9 10 11 12 13 14 15 16 17 18 19 20 21 22 23 24 25 26 27 28 29 30 31 32 33 34 35 36 37 38 39 40 41 42 43 44 45 46 47 48 49 50 51 52 53 54 55 56
For Peer Review
(southern Québec, Canada). Palaeogeography, Palaeoclimatology, Palaeoecology 386(15 491
September 2013), 336-348. 492
Letts, M.G., Roulet, N., Comer, N.T., 2000. Parametrization of peatland hydraulic 493
properties for the Canadian Land surface scheme. Atmosphere-Ocean 38(38), 141-160. 494
Levison, J., Larocque, M., Fournier, V., Gagné, S., Pellerin, S., Ouellet, M.A., 2014. 495
Dynamics of a headwater system and peatland under current conditions and with climate 496
change. Hydrological Processes 28(17), 4808-4822. 497
MDDELCC, 2017. Données du Programme de surveillance du climat, Direction du suivi 498
de l’état de l’environnement. http://www.mddelcc.gouv.qc.ca/climat/surveillance/, 499
Québec, Canada. 500
Moore, T.R., Dalva, M., 1993. The influence of temperature and water-table position on 501
carbon-dioxide and methane emissions from laboratory columns of peatland soils. 502
Journal of Soil Science 44(4), 651-664. 503
Morris, P.J., Baird, A.J., Belyea, L.R., 2012. The DigiBog peatland development model 504
2: ecohydrological simulations in 2D. Ecohydrology 5(3), 256-268. 505
Morris, P.J., Baird, A.J., Belyea, L.R., 2015. Bridging the gap between models and 506
measurements of peat hydraulic conductivity. Water Resources Research 51(7), 5353-507
5364. 508
National Wetlands Working Group-NWWG, 1997. The canadian wetland classification 509
system Second Edition in: Warner, B.G., Rubec, C.D.A. (Eds.). Canada, p. 68. 510
Pellerin, S., Larocque, M., Lavoie, M., 2007. Rôle hydrologique et écologique régional 511
de la tourbière de Covey Hill, Rapport d'étape présenté à la fondation EJLB. Québec, p. 512
63. 513
Quillet, A., Garneau, M., Frolking, S., 2013. Sobol' sensitivity analysis of the Holocene 514
Peat Model: What drives carbon accumulation in peatlands? Journal of Geophysical 515
Research Biogeosciences 118(1), 203-214. 516
Quinton, W., Hayashi, M., Carey, S.K., 2008. Peat hydraulic conductivity in cold regions 517
and its relation to pore size and geometry. Hydrological Processes 22, 2829-2837. 518
R environement, D.C.T., 2008. R: A language and environment for statistical computing. 519
Vienna, Autria, ISBN 3-900051-07-0. 520
Radforth, N.W., Brawner, C.O., 1977. Muskeg and the northern Environment in Canada. 521
University of Toronto Press, Canada. 522
Rosa, E., Larocque, M., 2008. Investigating peat hydrological properties using field and 523
laboratory methods: application to the Lanoraie peatland complex (southern Quebec, 524
Canada). Hydrological Processes 22(12), 1866-1875. 525
Rossi, P.M., Ala-aho, P., Ronkanen, A.K., Klove, B., 2012. Groundwater-surface water 526
interaction between an esker aquifer and a drained fen. Journal of Hydrology 432(11 527
April 2012), 52-60. 528
Surridge, B.W.J., Baird, A.J., Heathwaite, A.L., 2005. Evaluating the quality of hydraulic 529
conductivity estimates from piezometer slug tests in peat. Hydrological Processes 19(6), 530
1227-1244. 531
Von Post, L., 1922. Sveriges Geologiska Undersoknings torvinventering och nogra av 532
dess hittils vunna resultat (SGU peat inventory and some preliminary results). Svenska 533
Mosskulturforeningens Tidskrift(16), 1-37. 534
Waddington, J.M., Morris, P.J., Kettridge, N., Granath, G., Thompson, D.K., Moore, 535
P.A., 2015. Hydrological feedbacks in northern peatlands. Ecohydrology 8(1), 113-127. 536 3 4 5 6 7 8 9 10 11 12 13 14 15 16 17 18 19 20 21 22 23 24 25 26 27 28 29 30 31 32 33 34 35 36 37 38 39 40 41 42 43 44 45 46 47 48 49 50 51 52 53 54 55
For Peer Review
Winter, T.C., 2001. The concept of hydrologic landscapes. Journal of the American 537
Water Resources Association 37(2), 335-349. 538
Young, C.E., Klaiwitter, R.A., 1968. Hydrology of wetland forest watersheds, 539
Proceedings of CUCOH hydrology honference. Clemson University, pp. 29-38. 540
541
Table 542
Table 1 Site description: coordinates, altitude, surface area, watershed, hydrogeology, peat thickness, 543
microform, and presence or absence of groundwater input 544 545 3 4 5 6 7 8 9 10 11 12 13 14 15 16 17 18 19 20 21 22 23 24 25 26 27 28 29 30 31 32 33 34 35 36 37 38 39 40 41 42 43 44 45 46 47 48 49 50 51 52 53 54 55 56
For Peer Review
Figure 1. Locations of the seven studied peatlands in the Châteauguay (1-CH and 2-LTF), Nicolet (3-SSE, 4-LCY, and 5-VIC), Bécancour (6-VR), and Du Chêne (7-ISO) watersheds of southern Quebec (Canada).
223x150mm (300 x 300 DPI) 3 4 5 6 7 8 9 10 11 12 13 14 15 16 17 18 19 20 21 22 23 24 25 26 27 28 29 30 31 32 33 34 35 36 37 38 39 40 41 42 43 44 45 46 47 48 49 50 51 52 53 54 55
For Peer Review
Figure 2 Water table depths (WTD) for all locations (up-gradient, mid-gradient, down-gradient) of the seven sites (CH, LTF, SSE, LCY, VIC, VR, and ISO) from June 2014 to May 2016. Colors show significant differences in WTD between the sites. Red boxplots show the significant different group composed of CH,
VIC, VR, and ISO whereas green boxplots show the second group composed of LTF, SSE, and LCY. 76x60mm (300 x 300 DPI) 3 4 5 6 7 8 9 10 11 12 13 14 15 16 17 18 19 20 21 22 23 24 25 26 27 28 29 30 31 32 33 34 35 36 37 38 39 40 41 42 43 44 45 46 47 48 49 50 51 52 53 54 55 56
For Peer Review
Figure 3. Description of peat composition (shading), peat humification, maximum and minimum water table depths (dark grey dashed lines), and degree of humification(von Post; black line) from one core (up-gradient) of each of the seven sites (CH, LTF, SSE, LCY, VIC, VR, and ISO). Black = Detritus granosus ; dark
gray = Turfa herbacea ; grey = Turfa lignosa and light grey = Turfa bryophytica. 184x85mm (300 x 300 DPI) 3 4 5 6 7 8 9 10 11 12 13 14 15 16 17 18 19 20 21 22 23 24 25 26 27 28 29 30 31 32 33 34 35 36 37 38 39 40 41 42 43 44 45 46 47 48 49 50 51 52 53 54 55
For Peer Review
Figure 4 Bulk dry density variation for all locations (up-gradient, mid-gradient, down-gradient) of the seven sites (CH, LTF, SSE, LCY, VIC, VR, and ISO). Colors show significant differences in bulk dry density between the sites. Red shows the group with the highest ρ dry and light blue the group with the lowest ρ dry. The
group shown in white show both similarities with the green group and the dark blue group. 76x60mm (300 x 300 DPI) 3 4 5 6 7 8 9 10 11 12 13 14 15 16 17 18 19 20 21 22 23 24 25 26 27 28 29 30 31 32 33 34 35 36 37 38 39 40 41 42 43 44 45 46 47 48 49 50 51 52 53 54 55 56
For Peer Review
Figure 5 Variations in dry bulk density (ρdry) with depth in the up-gradient (black), mid-gradient (red), and down-gradient locations (green) of a) CH, b) LTF, c) SSE, d) LCY, e) VIC, f) VR, and g) ISO. Black vertical
dashed lines represent maximum and minimum water table depths in the up-gradient location. 406x558mm (300 x 300 DPI) 3 4 5 6 7 8 9 10 11 12 13 14 15 16 17 18 19 20 21 22 23 24 25 26 27 28 29 30 31 32 33 34 35 36 37 38 39 40 41 42 43 44 45 46 47 48 49 50 51 52 53 54 55
For Peer Review
Figure 6 Hydraulic conductivity variations for all locations (up-gradient, mid-gradient, down-gradient) of the sites (CH, LTF, SSE, LCY, VIC, VR, and ISO).
76x60mm (300 x 300 DPI) 3 4 5 6 7 8 9 10 11 12 13 14 15 16 17 18 19 20 21 22 23 24 25 26 27 28 29 30 31 32 33 34 35 36 37 38 39 40 41 42 43 44 45 46 47 48 49 50 51 52 53 54 55 56
For Peer Review
Figure 7 Log Ksat variation with depth in the up-gradient (black), mid-gradient (red) and down-gradient locations (green) of a) CH, b) LTF, c) SSE, d) LCY, e) VIC, f) VR, and g) ISO, including the log-log
model (black line) and the log model (blue line), and the R2 of each. Black vertical dashed lines represent the maximum and minimum water table depths in the up-gradient locations.
406x558mm (300 x 300 DPI) 3 4 5 6 7 8 9 10 11 12 13 14 15 16 17 18 19 20 21 22 23 24 25 26 27 28 29 30 31 32 33 34 35 36 37 38 39 40 41 42 43 44 45 46 47 48 49 50 51 52 53 54 55
For Peer Review
Figure 8 Specific yield (Sy) variations for all locations (up-gradient, mid-gradient, down-gradient) of the sites (CH, LTF, SSE, LCY, VIC, VR, and ISO).
76x60mm (300 x 300 DPI) 3 4 5 6 7 8 9 10 11 12 13 14 15 16 17 18 19 20 21 22 23 24 25 26 27 28 29 30 31 32 33 34 35 36 37 38 39 40 41 42 43 44 45 46 47 48 49 50 51 52 53 54 55 56
For Peer Review
Figure 9. Log-log model (black line) of Sy variations with depth in the up-gradient (black) location of the seven peatlands . The circles correspond to new data from this study, and the triangles to data from Bourgault et al. (2016). Black vertical dashed lines represent the maximum and minimum water table
depths in the up-gradient locations. 406x558mm (300 x 300 DPI) 3 4 5 6 7 8 9 10 11 12 13 14 15 16 17 18 19 20 21 22 23 24 25 26 27 28 29 30 31 32 33 34 35 36 37 38 39 40 41 42 43 44 45 46 47 48 49 50 51 52 53 54 55
For Peer Review
Figure 10 ρdry as a function of median water table depth for all locations in the seven peatlands. Black = CH, red= LTF, green= SSE, dark blue=LCY, light blue= VIC, pink= VR, and yellow=ISO. The black line
shows the linear regression model. 76x50mm (300 x 300 DPI) 3 4 5 6 7 8 9 10 11 12 13 14 15 16 17 18 19 20 21 22 23 24 25 26 27 28 29 30 31 32 33 34 35 36 37 38 39 40 41 42 43 44 45 46 47 48 49 50 51 52 53 54 55 56
For Peer Review
Figure 11. log K as a function of depth for all locations in the seven peatlands (Black = CH, red= LTF, green= SSE, dark blue=LCY, light blue= VIC, pink= VR, and yellow=ISO). The black line shows the log-log model developed in this paper, the dashed red lines show the upper and the lower log-log model calculated using a confidence interval of 95% on the parameters α and β, and the dashed blue line shows the semi-log
model developed by Young (1968) and used in the Digibog model (Baird et al., 2012). 76x50mm (300 x 300 DPI) 3 4 5 6 7 8 9 10 11 12 13 14 15 16 17 18 19 20 21 22 23 24 25 26 27 28 29 30 31 32 33 34 35 36 37 38 39 40 41 42 43 44 45 46 47 48 49 50 51 52 53 54 55
For Peer Review
Figure 12. Sy as a function of depth for all locations in the seven peatlands (Black = CH, red= LTF, green= SSE, dark blue=LCY, light blue= VIC, pink= VR, and yellow=ISO). The black line shows the model developed in this paper. The dashed red lines show the upper and the lower log-log model calculated using a
confidence interval of 95% on the parameters α and β. The circles correspond to new data from this study and the triangles represent data from Bourgault et al. (2016).
76x50mm (300 x 300 DPI) 3 4 5 6 7 8 9 10 11 12 13 14 15 16 17 18 19 20 21 22 23 24 25 26 27 28 29 30 31 32 33 34 35 36 37 38 39 40 41 42 43 44 45 46 47 48 49 50 51 52 53 54 55 56
For Peer Review
Figure 13 Log K as a function of ρdry for all locations in the seven peatlands. Black = CH, red= LTF, green= SSE, dark blue=LCY, light blue= VIC, pink= VR, and yellow=ISO. The black line shows the semi-log model
developed in this paper, the dashed red lines show the upper and the lower log model calculated using a confidence interval of 95% on the parameters α and β, and the dashed blue line shows the semi-log model
developed by Radforth and Brawner (1977) and used in the Holocene Peat Model (Frolking et al., 2011). 76x50mm (300 x 300 DPI) 3 4 5 6 7 8 9 10 11 12 13 14 15 16 17 18 19 20 21 22 23 24 25 26 27 28 29 30 31 32 33 34 35 36 37 38 39 40 41 42 43 44 45 46 47 48 49 50 51 52 53 54 55
For Peer Review
Figure 14 Sy as a function ρdry for all locations in the seven peatlands (Black = CH, red= LTF, green= SSE, dark blue=LCY, light blue= VIC, pink= VR, and yellow=ISO). The black line shows the model developed in
this study. The dashed red lines show the upper and the lower log model calculated using a confidence interval of 95% on the parameters α and β.
76x50mm (300 x 300 DPI) 3 4 5 6 7 8 9 10 11 12 13 14 15 16 17 18 19 20 21 22 23 24 25 26 27 28 29 30 31 32 33 34 35 36 37 38 39 40 41 42 43 44 45 46 47 48 49 50 51 52 53 54 55 56
For Peer Review
Figure 15 Sy as a function K for all locations in the seven peatlands (Black = CH, red= LTF, green= SSE, dark blue=LCY, light blue= VIC, pink= VR, and yellow=ISO). The black line shows the model developed in this study. The dashed red lines show the upper and the lower log-log model calculated using a confidence
interval of 95% on the parameters α and β. 76x50mm (300 x 300 DPI) 3 4 5 6 7 8 9 10 11 12 13 14 15 16 17 18 19 20 21 22 23 24 25 26 27 28 29 30 31 32 33 34 35 36 37 38 39 40 41 42 43 44 45 46 47 48 49 50 51 52 53 54 55