HAL Id: pastel-00005310
https://pastel.archives-ouvertes.fr/pastel-00005310
Submitted on 30 Jul 2009HAL is a multi-disciplinary open access
archive for the deposit and dissemination of sci-entific research documents, whether they are pub-lished or not. The documents may come from teaching and research institutions in France or abroad, or from public or private research centers.
L’archive ouverte pluridisciplinaire HAL, est destinée au dépôt et à la diffusion de documents scientifiques de niveau recherche, publiés ou non, émanant des établissements d’enseignement et de recherche français ou étrangers, des laboratoires publics ou privés.
Policy instruments for building energy efficiency in
China
Jun Li
To cite this version:
Jun Li. Policy instruments for building energy efficiency in China. Humanities and Social Sciences. École Nationale Supérieure des Mines de Paris, 2009. English. �NNT : 2009ENMP1621�. �pastel-00005310�
ED n° 396 : « Economie, Organisation et Société »
N° attribué par la bibliothèque
|__|__|__|__|__|__|__|__|__|__|
T H E S E
pour obtenir le grade de
DOCTEUR DE L’ECOLE NATIONALE SUPERIEURE DES MINES DE PARIS
Spécialité “Économie et Finance”
présentée et soutenue publiquement par
Jun LI
le 6 mars 2009
INSTRUMENTS DE POLITIQUES PUBLIQUES POUR LA MAITRISE DE
INSTRUMENTS DE POLITIQUES PUBLIQUES POUR LA MAITRISE DE
INSTRUMENTS DE POLITIQUES PUBLIQUES POUR LA MAITRISE DE
INSTRUMENTS DE POLITIQUES PUBLIQUES POUR LA MAITRISE DE
L’ENERGIE DANS LES PAYS EMERGENTS
L’ENERGIE DANS LES PAYS EMERGENTS
L’ENERGIE DANS LES PAYS EMERGENTS
L’ENERGIE DANS LES PAYS EMERGENTS ----LE CAS DE L’HABITAT EN CHINE
LE CAS DE L’HABITAT EN CHINE
LE CAS DE L’HABITAT EN CHINE
LE CAS DE L’HABITAT EN CHINE
Directeur de thèse : Pierre- Noël Giraud
devant le jury composé de :
M. Jean-Charles HOURCADE ... Président
M. Michel COLOMBIER ... Rapporteur
M. Mindjid MAIZIA ... Rapporteur
M. Pierre-Noël GIRAUD ...Examinateur
M. Jérôme ADNOT...Examinateur
Introduction et r´
esum´
e
1
Contexte
La Chine joue un rˆole pr´epond´erant en mati`ere d’´emissions de gaz `a effet de serre compte tenu de son poids d´emographique et de la structure de sa consommation d’´energie. Le charbon couvre plus de 60% des besoins ´energ´etiques de la Chine et assure 75% de la production d’´electricit´e, le principal secteur ´emetteur de gaz `a effet de serre. La Chine repr´esente 36.2% de la production mondiale de charbon en 20041. La contribution de la Chine aux ´emissions globales de CO
2´etait de 13,9% en 2000
. Selon le sc´enario de r´ef´erence de l’Agence Internationale de l’Energie2 , les ´emissions de CO2 de la
Chine seraient de 11.4 Gt `a l’horizon 2030, la Chine a d´ej`a d´epass´e les Etats-Unis et est devenue le premier ´emetteur mondial de gaz `a effet de serre en 2007. La s´ecurit´e ´energ´etique constitue un enjeu majeur pour le gouvernement chinois afin de ne pas brider la croissance ´economique du pays. Cette contrainte conduit le pays `a diversifier son approvisionnement mais aussi `a mettre l’accent sur la maˆıtrise de l’´energie, ce qu’il a fait principalement jusqu’`a maintenant dans le secteur industriel. Dans un contexte de d´eveloppement ´economique urbain rapide, le d´efi principal est de parvenir `a maˆıtriser la qualit´e de ses infrastructures, afin de placer le pays sur une trajectoire de croissance sobre en ´energie et en ´emissions de CO2.
Bref, il est important de comprendre comment un pays ´emergent tel que la Chine peut-il agir sur la qualit´e de ses infrastructures telles que l’habitat ou encore son syst`eme ´energ´etique ? Dans quelle mesure des objectifs environnementaux peuvent-ils ˆetre tenus dans un contexte de d´eveloppement urbain rapide ? Quelle peut ˆetre la r´epartition des efforts entre les diff´erents acteurs ? Quels sont alors les instruments politiques susceptibles permettant aux acteurs d’int´egrer la probl´ematique de l’efficacit´e ´energ´etique dans la construction de logements et dans le d´eveloppement de son syst`eme d’approvisionnement ´energ´etique ?
1BP Statistical review of world energy,2005.
2World Energy Outlook, 2007. La projection d’´emissions en Chine a ´et´e r´evis´ee `a plusieurs reprises. Le chiffre
indiqu´e est presque 60% plus ´elev´e que celle pr´evue en 2002 de l’AIE.
2
Probl´
ematique
Il y a deux questions fondamentales auxquelles cette th`ese tentera de r´epondre. 1. Existe-t-il une trajectoire optimale d’´evolution des normes relatives `a la performance ´energ´etique du bˆatiment dans le contexte d’une urbanisation extrˆemement rapide en Chine ? 2. Si oui, quels sont des instruments politiques et ´economiques `a mettre en place pour limiter la croissance de la demande ´energ´etique et des ´emissions de CO2 dans ce secteur dans le contexte ´economique et institutionnel chinois ?
L’objet principal de notre travail est d’´elaborer des instruments int´egrant l’offre ´energ´etique et la performance ´energ´etique du bˆatiment avec une approche de l’analyse technico-´economique afin de trouver les solutions permettant de minimiser le coˆut de l’ensemble du syst`eme. Pourtant, la mise en oeuvre des politiques n´ecessite un cadre institutionnel adapt´e, la prise de d´ecision est parfois tr`es d´elicate parce que les gouvernements locaux sont souvent soumis `a une double contrainte : 1. le d´eveloppement ´economique `a court terme ; 2. l’´epuisement des ressources ainsi que l’impact environ-nemental `a moyen et long terme, cela soul`eve la question fondamentale des sciences ´economiques, comment peut-on maximiser l’utilit´e sociale avec des ressources limit´ees.
Une ville chinoise (Tianjin) est choisie comme l’´etude de cas dans cette recherche. Le choix de la ville est pertinent du point de vue des prospectives ´energ´etiques et ´economiques. Premi`erement, la ville de Tianjin est repr´esentative en termes de condition climatique dans la majorit´e des villes dans la Chine du nord, o`u les besoins de chauffage ne cessent d’augmenter dans le secteur du bˆatiment. La ville de Tianjin est situ´ee dans la zone officielle de chauffage o`u les chaudi`eres et les centrales de cog´en´eration centralis´ees distribuent de la chaleur.
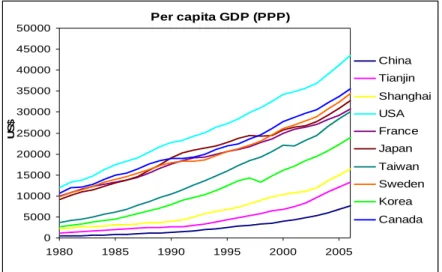
Deuxi`emement, l’´economie et le niveau de vie des habitants vont continuer `a s’accroitre rapdi-ment dans les prochaines d´ecennies. Le PIB par tˆete `a Tianjin devrait atteindre 20,000 US$ en 2020, ´equivalent au niveau des pays moyennement industrialis´es dans les ann´ees 1990.En effet, le confort d’´et´e est aussi une grande probl´ematique ´energ´etique dans le secteur r´esidentiel, la ville de Shanghai repr´esente la zone climatique en transition o`u l’utilisation de climatiseurs fonctionnant `a pompe `a chaleur (air-air) domine la consommation r´esidentielle d’´electricit´e, il paraˆıt ´egalement n´ecessaire d’effectuer une analyse des ´economies d’´energie de climatisation dans le secteur du bˆatiment `a Shanghai. Pourtant, notre analyse prospective est focalis´ee sur la probl´ematique du chauffage dans la partie du nord de Chine sous contrainte de donn´ees disponibles, ainsi seule la ville de Tianjin fait l’objet de l’exercice de mod´elisation dans cette recherche, l’analyse succincte de la situation de Shanghai est pr´esent´ee dans l’annexe.
La litt´erature explorant les exp´eriences dans les pays d´evelopp´es montre que la demande des services ´energ´etiques dans le r´esidentiel est ´etroitement corr´el´ee avec le niveau de vie des habitants. Les m´enages de la classe moyenne et sup´erieure peuvent accroitre leur consommation de services
´energ´etiques `a un moindre coˆut que les m´enages `a bas revenu. Cette observation intuitive implique que la future demande d’´energie dans les bˆatiments dans les grandes villes chinoises sera beaucoup plus importante si aucune mesure de la maˆıtrise de l’´energie (MDE) n’est prise `a court terme car les contraintes de revenu seront progressivement relˆach´ees `a mesure que les m´enages s’enrichiront.
3
M´
ethodologie
Une approche quantitative est employ´ee pour identifier la trajectoire optimale de l’´evolution de la performance ´energ´etique du parc de logements et le choix du syst`eme d’offre d’´energie `a l’´echelle d’une ville. Il s’agit de mod´eliser les cons´equences ´energ´etique, environnementale et ´economique afin de trouver le(s) choix pertinent(s) permettant de minimiser le coˆut social. Le mod`ele s´electionn´e (LEAP) dans l’analyse de la ville est de type bottom-up, adapt´e pour simuler les sc´enarios des politiques de MDE mises en place. Nous simulerons `a la fois la puissance de charge ainsi que la consommation d’´energie finale et primaire en fonction des hypoth`eses sur la performance du bˆati et sur le syst`eme ´energ´etique. Les coˆuts suivants sont pris en compte dans le calcul du mod`ele.
– coˆut de l’am´elioration du rendement ´energ´etique, y compris le coˆut des mat´eriaux de construc-tion efficace, l’enveloppe d’isolaconstruc-tion, de ventilaconstruc-tion, mesures sp´ecifiques du syst`eme de r´egulaconstruc-tion, etc.
– coˆut des sources d’´energie (charbon, gaz naturel, p´etrole, ´electricit´e), le prix du march´e est utilis´e comme le proxy du coˆut social (shadow price) des ressources naturelles, le benchmark price des combustibles est retenu comme la r´ef´erence du coˆut
– coˆut du capital de l’installation de nouvelle puissance de la production de chaleur et d’´electricit´e pour r´epondre `a la demande croissante)
– coˆuts fixe et variable des O&M
– coˆut des externalit´es de l’environnement
Dans le mod`ele, nous d´eterminons deux cat´egories de facteurs influen¸cant la demande ´energ´etique, par cons´equent les r´esultats ´economiques du syst`eme :
1. crit`eres socio´economiques
population, taux d’urbanisation, revenu (repr´esent´e par le PIB par tˆete), surface moyenne par habitant, taille de m´enage, taux de p´en´etration des ´equipements ´electrom´enagers et d’ap-pareils ´electriques.
2. crit`eres techniques & physiques
caract´eristique thermique de l’enveloppe (repr´esent´ee par la U -value), temp´erature chauff´ee `a l’int´erieur du bˆatiment, p´eriode de chauffage, le rendement de production et de distribution,
performance ´energ´etique de l’ensemble du syst`eme de fourniture de l’´energie, application de nouvelles technologies avanc´ees (e.g. CCS3).
Certaines variables sont interd´ependantes telles que le niveau de confort et le revenu de m´enage. De fait, les facteurs se d´ecomposent en variables exog`enes, explicit´ees directement selon nos hypoth`eses, et variables endog`enes, calcul´ees par le mod`ele en fonction de l’input des variables exog`enes. Nous ´etablissions les interactions des variables par une s´erie d’´equations.
4
Structure de la th`
ese
La th`ese se constitue en deux parties principales. Dans la premi`ere partie, j’exposerai d’abord la motivation de la recherche ainsi que la m´ethodologie employ´ee. Ensuite, je pr´esenterai les diff´erentes trajectoires du d´eveloppement de la performance ´energ´etique des bˆatiments et des technologies d’offre d’´energie (chauffage individuel, chaudi`ere, usine de chaleur fonctionnant au charbon, ´energie renouvelables etc) et les cons´equences ´economiques et environnementales dans la ville de Tianjin en basant sur l’approche de mod´elisation.
Dans la deuxi`eme partie, j’aborderai l’aspect institutionnel de l’organisation des march´es ´energ´etique et immobilier dans les deux villes, l’analyse se focalise sur les jeux d’acteurs du march´e. Une revue g´en´erale des th´eories ´economiques sur les institutions, incitations et le choix social sera effectu´ee pour constituer le cadre d’analyse. Par la suite, en combinant les r´esultats de la mod´elisation et de l’analyse institutionnelle, je pr´esenterai les r´esultats de la th`ese et formulerai des recommandations d’instruments politiques et ´economiques. Ces outils seront con¸cus pour inciter les acteurs `a mieux prendre en compte les enjeux de la maˆıtrise de l’´energie du bˆatiment neuf et les choix technologiques de l’offre de l’´energie afin d’anticiper la n´ecessaire transition vers une ´economie d´ecarbon´ee.
5
R´
esum´
e des chapitres
Le chapitre 1 explique la motivation de la recherche et la probl´ematique de recherche et pr´esente ´egalement la structure de la th`ese et ses composants. La premi`ere partie de ce chapitre se consacre `a la description du panorama de la consommation d’´energie et les implications d’´emissions de
CO2 dans les villes chinoises. Il explique la raison pour laquelle nous devrons insister sur l’im-portance de la prise en compte imm´ediate de l’efficacit´e ´energ´etique dans le bˆatiment dans un contexte d’urbanisation sans pr´ec´edent en Chine. Une vue d’ensemble de l’´economie de l’efficacit´e ´energ´etique ainsi que les barri`eres techniques et institutionnelles `a la mise en œuvre des politiques
3carbon caputre and storage
de maˆıtrise de l’´energie dans les secteurs r´esidentiel et tertiaire sont pr´esent´ees dans la deuxi`eme partie de ce chapitre.
Le chapitre 2 commence par un bref descriptif de la litt´erature pr´esentant diff´erents mod`eles consacr´es `a l’analyse prospective de la demande d’´energie `a moyen et long terme, i.e. les diff´erents sc´enarios de la demande d’´energie dans le secteur du bˆatiment r´esultant des politiques de la MDE. L’analyse des sc´enarios ´elabor´es dans les ´etudes pr´ec´edentes montrent que la consomma-tion d’´energie dans les bˆatiments en Chine pourrait ˆetre r´eduite de 100-300 millions de tonnes d’´equivalent p´etrole (Mtep) en 2030 par rapport au business as usual(BAU), ce qui signifie que 600-700 millions de tonnes d’´emissions de CO2 pourraient ˆetre ´evit´ees par la mise en œuvre des
politiques ´energ´etiques appropri´ees dans un cadre institutionnel adapt´e. L’essentiel des ´economies d’´energie r´eside dans le chauffage urbain au nord de la Chine. Pour cela, l’am´elioration de la per-formance thermique du bˆatiment ainsi que la qualit´e de production et de distribution de chaleur devront jouer un rˆole majeur dans la maˆıtrise de la demande ´energ´etqiue et des ´emissions de CO2. Par la suite, le chapitre explore les implications sociales, ´economiques et environnementales et les limites des ´etudes de mod´elisation. En examinant les hypoth`eses et les m´ethodes utilis´ees dans la litt´erature existante, nous montrons que les cadres de mod´elisation dans la litt´erature existante n’ont pas abord´e directement la question fondamentale de nos recherches et insistons sur la n´ecessit´e de trouver la r´eponse pertinente. Nous concluons `a la fin du chapitre que l’analyse prospective de la demande ´energ´etique et des ´emissions de CO2 dans le secteur du bˆatiment est n´ecessaire pour
r´epondre `a notre question fondamentale et expliquons pourquoi le processus de mod´elisation est bas´ee sur deux ´echelles diff´erentes : analyse d’un quartier “type”et de l’ensemble de la ville.
Le chapitre 3 pr´esente la m´ethodologie et le cadre de mod´elisation permettant de rem´edier aux limites dees travaux pr´ec´edents relatifs au choix optimal de la performance ´energ´etique du bˆatiment, mentionn´es dans le chapitre 2. Nous d´ecrirons la philosophie de la construction du mod`ele et les choix des sc´enarios dans la seconde moiti´e de ce chapitre, la question sur les taux d’actualisation sera ´egalement abord´ee.
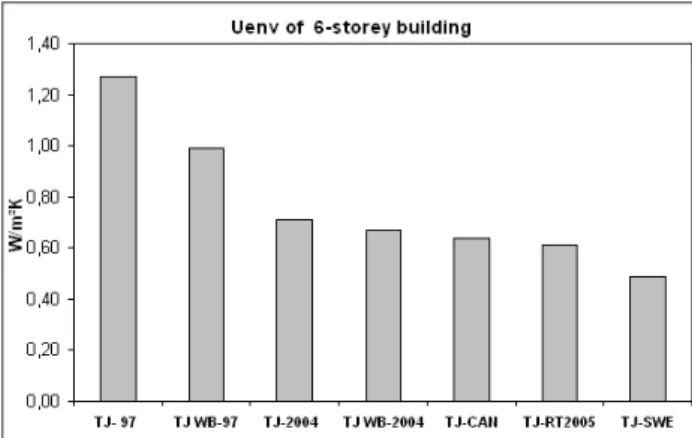
Le chapitre 4 pr´esente les r´esultats de la mod´elisation `a l’´echelle d’un nouveau quartier d’habi-tation o`u 70% du bˆati est d’utilit´e r´esidentielle et 30% des bˆatiments sont con¸cus `a des fins commer-ciales. L’´etude du quartier est bas´ee sur plusieurs modules dans lesquels les diff´erents portefeuilles de technologies (performance du bˆati, syst`eme d’approvisionnement en chaleur) sont test´ees afin de comparer les coˆuts et les avantages de diff´erents niveaux de la construction conform´ement aux normes d’efficacit´e du bˆatiment r´esidentiel dans une nouvelle zone d’am´enagement de la ville de Tianjin. Il s’agit d’une ´evaluation de la d´ecision d’investissement prise lors du d´eveloppement d’une nouvelle zone d’am´enagement o`u l’ensemble des logements sont construits en mˆeme temps. Nous ´evaluons les exigences de la performance thermique de diff´erentes strat´egies afin d’identifier les
normes optimales pour une p´eriode de 20 ans. Le r´esultat montre que la r´eglementation thermique actuelle en Chine ne permet pas d’atteindre le niveau optimal (coˆut social minimis´e) du point de vue social, on observe que la norme la plus exigeante d’aujourd’hui (´equivalente `a celle de la Su`ede) g´en`ere un coˆut global moins ´elev´e que la r´eglementation, lorsque les couts des externalit´es ( cout d’´emissions de CO2) ne sont pas pris en compte). Le calcul montre ´egalement que quelque
soit la prise en compte ou non du coˆut des externalit´es (´emissions de SO2; CO2), la construction
des bˆatiments conform´ement aven une performance ´energ´etique ´equivalente aux exigences dans la norme fran¸caise ( RT 2005) combin´ee avec la cog´en´eration fonctionnant au charbon `a l’´echelle du quartier permettrait d’atteindre l’optimum pour la p´eriode 2005-2020, tandis que l’´equivalent de la norme su´edoise serait pr´ef´erable lorsque le prix du carbone est explicite et suffisamment ´elev´e. La politique dite “fuel switch”pr´econisant la substitution massive du charbon par le gaz naturel dans la production d’´energie en ignorant la performance ´energ´etique du bˆati se r´ev`ele ˆetre un choix non pertinent car le coˆut serait extrˆemement ´elev´e. Le bilan carbone serait cependent nettement sup´erieur aux options charbon les meilleures.
Le chapitre 5 poursuit le cheminement des travaux du chapitre 4 en introduisant la dynamique du parc. L’objectif central est de comparer les diff´erentes strat´egies d’investissement dans maˆıtrise de la demande et les technologies d’offre afin d’identifier les options optimales. L’enjeu capital pour l’autorit´e publique est d’´etablir le pont entre la d´ecision d’investissement d’aujourd’hui et la capacit´e de transformer les bˆatiments en infrastructures de basse intensit´e ´energ´etique et faibles ´emissions de carbone `a l’avenir. Il s’agit d’un arbitrage d’investissement `a diff´erents horizons de temps, puisque une grande partie du parc existant peu performant construit avant 2005 devra ˆetre r´ehabilit´e et que l’infrastructure du syst`eme d’offre d’´energie (e.g. chaudi`eres au charbon) devra ˆetre renouvel´ee `a l’horizon 2015-2020. Ce sera donc l’occasion de de faire des choix d’investissement tant du cˆot´e de l’offre que celui de la demande.En mati`ere d’offre d’´energie, soit la ville pourra op-ter pour le “fuel-switching”en substituant massivement le gaz au charbon dans les chaudi`eres ; soit elle pourra introduire les “low-carbon technologies”(CCS entre autres) progressivement en main-tenant la structure dominante du charbon. Or ces nouvelles orientations d’investissement dans les technologies d’offre requiert n´ecessairement la capacit´e de financement qui, `a leur tour, d´ependent directement de la qualit´e de la performance ´energ´etique du parc que l’on construit d`es aujour-d’hui jusqu’en 2030. L’am´elioration de l’efficacit´e ´energ´etique du bˆatiment va g´en´erer des rentes financi`eres grˆace `a la r´eduction des coˆuts d’exploitation du syst`eme tout au long de la p´eriode. Les d´ecideurs politiques pourront transformer les rentes en capacit´e d’investissement dans de nou-velles technologies d’offre `a partir de 2015-2020 dans un contexte institutionnel adapt´e. Il s’agit donc de comparer les diff´erents mod`eles d’investissement `a la fois dans la demande et dans l’offre. Les coˆuts et b´en´efices s´equentiels seront illustr´es comme r´esultats de mod´elisation afin de savoir
comment l’autorit´e locale doit arbitrer les d´ecisions d’investissement dans les diff´erents temps sous contraintes des ressources ´economiques limit´ees.
Ce chapitre mod´elise les cons´equences ´energ´etique, environnementale et ´economique des strat´egies envisag´ees (traduites en sc´enarios dans le mod`ele) avec les r´esultats chroniques (profil annuel) r´esultats annuels et cumul´es pour expliciter leurs coˆuts et avantages respectifs. Contrairement au chapitre 4 dans lequel un parc “statique”(construction neuve ) est pris en compte, le chapitre 5 int`egre ´egalement le parc existant dans le calcul total, autrement dit, nous mod´elisons la dynamique de l’ensemble du parc du bˆatiment (construction neuve, d´emolition, r´eaffectation,r´ehabilitation etc.). Nous simulerons une dizaine de sc´enarios selon le niveau d’exigence des normes des bˆatiments et les diff´erentes technologies du syst`eme de fourniture ´energ´etique. Par ailleurs, une variante de
non r´ehabilitation du parc existant en 2005 sera aussi simul´ee dans chaque sc´enario pour comparer
les coˆuts actualis´es. Les options de l’offre d’´energie consid´er´ees dans ce chapitre couvrent presque toutes les technologies disponibles de la production de chaleur et d’´electricit´e, de mani`ere plus compl`ete plus compl`ete que dans le chapitre 4. Dans les sc´enarios sous contrainte carbone, le prix du carbone sera introduit pour prendre en compte les coˆuts environnementaux. Les r´esultats de l’analyse sont assez similaires `a ceux trouv´es dans le chapitre pr´ec´edent, les exigences ´equivalentes `a la norme su´edoise seraient le choix optimal dans la plupart des cas ´etant donn´e les technologies d’offre d’´energie. Les sc´enarios fuel switch et la mise en œuvre g´en´eralis´ee du CCS sont des choix extrˆemement coˆuteux pour la soci´et´e, il sera d’autant plus difficile d’adopter ces technologies que les bˆatiments construits sont peu performants et induisent des coˆuts de fonctionnement ´elev´es. La d´ecision d’investissement dans la demande et l’offre ´energ´etique doit ˆetre prudente afin de mi-nimiser le risque de lock-in de long terme. L’exigence du bˆatiment low-carbon (ultra performant ´energ´etiquement) serait souhaitable dans les sc´enarios o`u le coˆut des ´emissions de CO2 est tr`es
´elev´e.
Les chapitres 6 et 7 constituent la deuxi`eme partie de la th`ese et cherchent `a ´elaborer des instruments ´economiques et politiques pour faciliter la convergence vers la trajectoire optimale telle que d´efinie dans la premi`ere partie.
Le chapitre 6 porte sur l’analyse institutionnelle du march´e ´energ´etique et de l’immobilier dans la ville de Tianjin et Shanghai. Nous aborderons les aspects suivants : l’organisation et le fonction-nement du march´e immobilier et les crit`eres d´eterminants des composants des prix des logements ; les prix de l’´energie ; les jeux d’acteurs dans un syst`eme complexe liant ´energie, am´enagement et bˆatiment.
La premi`ere partie du chapitre 7 est consacr´ee `a l’´etude des th´eories ´economiques de l’institution et des incitations. Dans la seconde partie du chapitre,nous essayerons d’´elaborer des instruments po-litiques pour surmonter les barri`eres institutionnelles et techniques `a la mise en œuvre des mesures
de la MDE dans le secteur r´esidentiel, tel que les m´ecanismes applicables qui relient la performance ´energ´etique du bˆatiment avec le march´e du carbone international. Nous analyserons les conditions de mise en œuvre du M´ecanisme du D´eveloppement Propre (MDP) dans le cadre du protocole Kyoto pour la MDE du bˆatiment. D’autre part, nous sugg´ererons que les promoteurs et construc-teurs puissent ˆetre incit´es `a mieux prendre en compte la qualit´e de la performance ´energ´etique du bˆatiment par le biais du tarif foncier et de la r´eglementation sp´ecifique de l’usage du sol destin´e `a la construction de logements. L’une des recommandations principales repose sur la flexibilit´e de l’allocation du coefficient d’occupation du sol (COS ) en fonction de la l’efficacit´e ´energ´etique globale de la construction. Le coˆut d’abatement de CO2 dans les projects d’am´elioration de la
performance ´energ´etique du bˆatiment serait de l’ordre de 16 US$ par tonne CO2. Le programme
immobilier de construction neuve pourra b´en´eficier d’un COS sp´ecifique suivant l’´echelon de la performance ´energ´etique sp´ecifique du bˆati, tout en d´ependant du syst`eme int´egral d’approvision-nement d’´energie en amont. Nous d´ecrirons comment tenir compte des int´erˆets de chaque acteur ce processus ( le fournisseur d’´energie, le promoteur, le consommateur et le gouvernement). Pourtant, la mise en place de ces m´ecanismes semblerait n´ecessiter un changement fondamental du processus administratif de d´eveloppement de la ville. Les r´esultats de calcul montrent que l’agumentation du tarif de chauffage de 15-20% 4serait indispensable pour accompagner les instruments propos´es sans quoi ni le promoteur ni la compangie de chauffage aura l’int´erˆet d’investir dans la maˆıtrise de l’´energie dans le bˆatiment. De ce point de vue, la restructuration et la r´eforme institutionnelle du march´e de l’´energie et de l’immobilier seront indispensables pour pouvoir atteinte les objectifs de l’optimalit´e telle que d´efinie dans la th`ese.
Le chapitre 8 conclut la th`ese. Il reprend les grandes lignes des r´esultats des analyses quantita-tives et institutionnelles dans l’optique de la r´ealisation des trajectoires optimales de la MDE dans les bˆatiments en Chine. Les limites de cette recherche ainsi que la perspective de travaux futurs seront finalement pr´esent´ees.
4En effet, cette fourchette d’agumentation du tarif permet aux consommateurs d’ˆetre indiff´erents vis-`a-vis de la
facture de l’´energie.
Abstract
More than one billion square meters of housing should be built in Chinese cities by 2020. At the same time, demand for energy services of Chinese households is very likely to increase as a result of continually improved living standards. Space heating already accounts for almost 40% of energy consumption in the residential sector in China. Thus the energy performance of buildings in Chinese cities represents a major challenge for ensuring energy supply security and combating climate change in the next decades. Several regulations relating to the requirement of the thermal performance of housing entered into force in China successively since the 1990s, the long term consequences of failure in enforcement and implementation have been examined from both energy security and climate protection perspectives.Nevertheless, few of studies in literature have addressed the issue from the perspective of economic investment decision. None of previous studies have studied the extent to which the current decision on more or less efficient standards in the large-scale urban infrastructure like buildings will have ultimately impact on the financing capacity in transforming the society toward low-carbon energy supply and consumption model, and the role the energy efficiency in buildings will play in enabling the public authority to harness the benefits resulting from reduced operation costs in early stage to facilitating the investment in new technology research and development and deployment in the future. The thesis seeks to answer two fundamental questions : 1. Is there an optimal development path to buildings energy performance standards in the context of extremely rapid urbanisation in China ? 2. If so, what are political and economic instruments to put in place to limit growth in energy demand and CO2 emissions
in this sector by taking the economic and institutional characteristics into account ? Based on a modelling approach, we compare a variety of strategies to manage energy demand in buildings and their economic costs in a Chinese city by 2030. Our quantitative analysis in the first part of thesis shows that the adoption of current Chinese BEE standards not only fails to achieve an optimal level from societal point of view, but would also be the most costly among the technical options available today even without taking into account any cost of environmental externalities. Inclusion of carbon price will certainly favour the high-efficiency construction technology. More importantly, the city-level long-term modelling results show that failing in implementation of building energy efficiency today will result in tremendous difficulty in transforming the whole infrastructure under climate and economic constraints. Financing the new generation of low-carbon supply technologies such as renewable heating and carbon capture and storage require taking into account the buildings thermal quality without any delays, otherwise the whole urban infrastructure would be locked in low efficiency and high operation costs dilemma for several decades because both retrofitting and alternative energy supply in this case would be extremely costly and difficult to undergo.
Therefore we strongly recommend that efficiency issue must be attached serious attention and the current thermal regulations should be strengthened significantly and quickly to avoid irreversible carbon lock-in deadlock in the next two decades. Indeed, financial shortage appears not to be the unsurmountable barriers to upgrading the current efficiency standards based on our modelling results, instead the institutional aspect may be the main obstacle to the no-lose strategy that allows benefits creation and redistribution. Several economic and policy instruments are analysed in the second part to accompany the actions of buildings performance amelioration with removal of institutional barriers. We develop three main models to accompany the learning of high-efficiency construction technology and processing industry : 1). establishment of a carbon financing system via the integration of the Clean Development Mechanism of the Kyoto Protocol into the construction sector ; 2). flexibility of land use regulations on property developing and city zoning ; 3). creation of economic incentives to facilitate third-financing of energy efficiency in buildings, including the involvement of municipal heat companies. In this regard, district heating pricing reform must be carried out accordingly.
Remerciements
Je tiens `a remercier vivement mon directeur de th`ese, Monsieur le Professeur Pierre-No¨el GI-RAUD, pour avoir accept´e de diriger ce travail de recherche. Ses conseils et critiques avis´es, son exp´erience et sa rigueur scientifique m’ont guid´e tout au long de ce travail.
J’aimerais ´egalement remercier Monsieur Jean-Charles HOURCADE, Directeur de Recherche au CNRS, qui m’a fait l’honneur d’exercer la fonction de pr´esident du jury.
J’exprime mes remerciements `a Monsieur Mindjid MAIZIA qui a bien voulu accepter d’ˆetre le rapporteur de ce travail.
Mes remerciements vont ´egalement `a Monsieur J´erˆome ADNOT, Directeur de Recherche au Centre ´Energ´etique et Proc´ed´e de l’´Ecole des Mines de Paris, pour son encouragement et ses conseils pr´ecieux pour mon travail, qui m’a fait aussi l’honneur d’ˆetre membre du jury.
Je remercie tout particuli`erement Monsieur Michel COLOMBIER pour son encadrement de ce travail doctoral et pour toutes les heures qu’il m’a consacr´ees. Au cours de ces ann´ees, sa grande disponibilit´e, son enthousiasme sur le sujet et ses pr´ecieux conseils m’ont permis de travailler dans les meilleures conditions.
Je souhaiterais exprimer ma gratitude `a Madame Carine BARBIER, j’aimerais lui dire `a quel point j’ai appr´eci´e son encouragement et son soutien affectif sans faille ainsi que sa grande dispo-nibilit´e pour la relecture des documents que je lui ai adress´es tout au long de cette p´eriode.
Mes remerciements s’adressent ´egalement `a mes coll`egues de l’Iddri pour leur accueil, support, aide et amiti´e.
Je remercie l’Ademe qui a financ´e cette th`ese en m’accordant une bourse de recherche.
Enfin je ne saurais oublier mes parents, ce travail n’aurait jamais vu le jour sans leur soutien inconditionnel et encouragement pendant ces ann´ees de th`ese.
T
able of
C
ontents
Chapter 1 Introduction 5 1.1 Motivation 5 1.2 Economics of building energy efficiency 7 1.3 Cross‐review of previous scenarios analysis 10 1.4 Drivers of increase in energy demand in buildings 16 1.5 Foundation of BEE 17 1.6 Barriers to building energy efficiency in Chinese context 21 1.7 The fundamental question and structure of thesis 23 1.8 Structure of thesis 24Chapter 2 Lessons from the long term scenarios analyses 27
2.1 China’s construction dynamics and energy demand in building 27 2.2 Mitigating CO2 emissions from building sector 30 2.3 Review of previous scenario analyses of energy demand in building sector 32 2.4 Lessons from scenario and contribution of the research 39 2.5 Conclusion of the chapter 43 Chapter 3 Methodology 47 3.1 Framework of analysis 47 3.2 Assessment of energy models 50 3.3 Description of LEAP 54
Chapter 4 Economic analysis of BEE in a new residential area 61
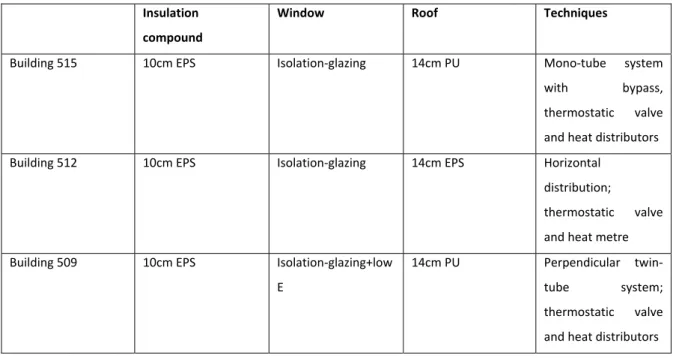
4.1 Introduction and summary 61 4.2 The current status of mandatory codes for BEE 63 4.3 Methodology 65 4.4 General buildings typologies and characteristics 66 4.5 Parametres of BEE improvement portfolios 68 4.6 Costs 73 4.7 Economic benefit of implementing BEE 79 4.8 Benefit of CHP deployment 80 4.9 Results and discussions 81 4.10 Chapter conclusions 91
Chapter 5 Modelling the long term trajectories in Tianjin City 97
5.1 Introduction and summary 97
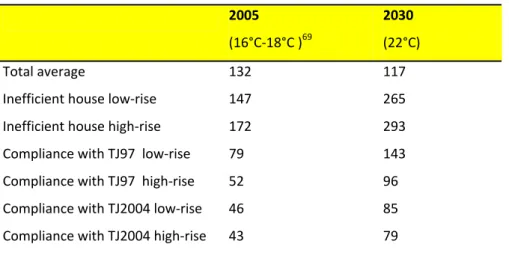
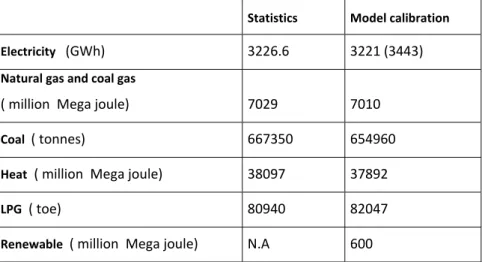
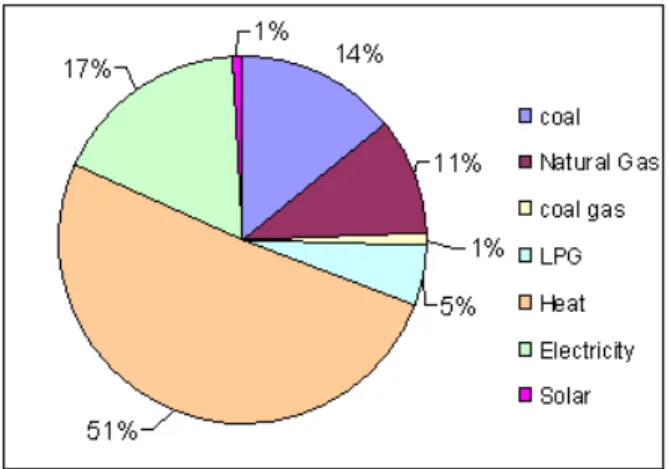
5.3 Criterion of social optimum and boundary of costs 100 5.4 Determining variables of buildings energy consumption 102 5.5 Key variables 108 5.6 Description of Scenarios 117 5.7 Energy supply system 139 5.8 Estimation of cost 155 5.9 Result of simulations 165 5.10 Model calibration of reference scenario 171 5.11 Commercial electricity consumption by energy use 180 5.12 Primary energy demand and emissions 183 5.13 SYS2 primary energy supply and emission 190 5.14 Results of alternative scenarios 193 5.15 Alternative scenarios of primary supply 205 5.16 Cost implications of scenarios 219 5.17 Cost scenarios with carbon constraints (Inclusion of CO2 emission costs) 234 5.18 Decision on optimal BEE choice in SYS2 energy supply system 241 5.19 System 3 energy supply scenario 243 5.20 Conclusion of the chapter 253
Chapter 6 Institutional analysis of energy planning and property market organisation 259
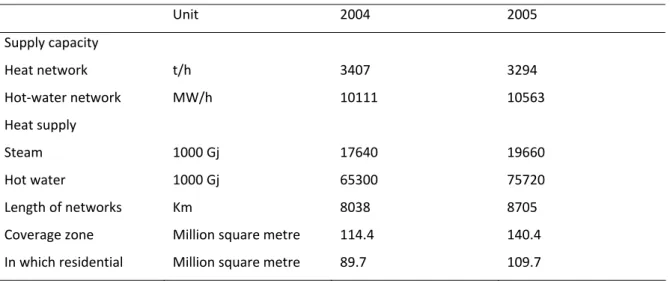
6.1 Introduction 259 6.2 Institutional analysis of property market in Tianjin 261 6.3 Institutional aspect of district heating supply in Tianjin 284 6.4 District pricing and reform perspective 292 6.5 Institutions in the property and energy efficiency 297 6.6 Institutional barriers to full implementation of BEE standards 301
Chapter 7 Policy instruments design 313
7.1 Summary 313 7.2 Policy instruments for BEE 314 7.3 Review of policy and economic instruments for BEE 318 7.4 Proposition of instruments 327 7.5 Policy assessment 352 7.6 Conclusion 354 Chapter 8 Conclusion 359
List of Acronyms and Abbreviations
BEE Building energy efficiency HSCWZ Hot summer and cold winter zone BNA Tianjin Binhai New Zone TEDA Tianjin Economic Development Area NCMEDRI North China Municipal Engineering Design and Research Institute (Headquartered in Tianjin) SRIBS Shanghai Research Institute of Building Sciences NDRC National Development and Reform Commission MOC Ministry of Construction ( renamed to Ministry of Housing and urban & rural Development since March, 2008) MOF Ministry of Finance STSB State technology supervision bureau NBS National bureau of statistics GEF Global environment facility WB The World Bank HXJD Huaxiajindian real estate development program HVAC heating, ventilation& air conditioning HDD Heating Degree Day CDD Cooling Degree Day DH District Heating CHP Combined Heat and Power CCGT combined cycle gas turbine IGCC Integrated Gasification Combined Cycle CFBC Circulating Fluidized Bed combustion GT Gas Turbine ST Steam turbine CFB Coal Fired Boiler HP high pressure LP low pressure GHG green house gas CO2 carbon dioxide SO2 sulphur dioxide DSM demand‐side management NPV Net present value IRR Internal Rate of Return DPP dynamic payback period RMB Chinese monetary unit or Yuan (Approx.1 US$=8.01 RMB 2005 price) EPBD energy performance of building directive CDM clean development mechanism PR plot ratioHPF housing provident fund EAH economically affordable housing LRH Low‐rent house GUP general urban planning RDP Regulatory detailed planning COS Coefficient d’occupation de sol (identical to PR) HQE Haute qualité environnementale HPE Haute performance énergétique PA Per annum
Energy unit conversion
GJ giga joule (1 Gj=277.8 kWh) TOE Ton of oil equivalent ( 1 toe=11630 kWh) TCE Ton of coal equivalent (1 TCE= 7.0 GCal = 29.31 GJ = 8314 kWh)
Chapter 1 Introduction
1.1 Motivation
The scientific community has reached a strong consensus regarding the science of global climate change. Fossil energy combustion is biggest responsible for greenhouse gas emission contributing to global warming. Therefore, increasing the energy performance now is of crucial importance in order to contain the soaring demand and avoid supply capacity disruption as well as mitigating global warming. Barbier (2003) pointed out that along with physical and human capital, environmental resource should be viewed as important economic assets and which is called “natural capital”. Arrow at al. (2005) also affirmed that economic activities are sustainable only if the life‐support ecosystems on which they depend are resilient. But the changing climate regime will jeopardize the environmental carrying capacity since it will change the whole eco‐system and threatens agricultural activity and thus food supply security in the world, in particular, the developing and poor countries.
Buildings account for nearly one‐third of global CO2 emission (Levine et al., 2007) and can play a major role in mitigating climate change in the short‐ to medium‐term, since substantial reductions in CO2 emissions from their energy use can be achieved over the coming years (Ürge‐Vorsatz et al., 2007). Although a variety of technical solutions exist, many buildings still use much energy than they should do. Reducing energy related GHG emissions in building sector become a priority of climate policy making across the international community today.
Heating and hot water consumption represent two‐thirds of energy demand in buildings in China. Most of the power and heat plants use fossil fuel, in particular the coal which has a tremendous environmental implication in terms of CO2 emission, improving energy efficiency in buildings will be therefore a substantial contribution to the mitigation of global warming. Significant reduction of building energy consumption achieved after the implementation of 1995 Energy Efficiency Standard for New Residential Buildings in 1995. However, the energy consumption for heating in an efficient house in China (20W/m2) 1 is still more than twice as much as that of most efficient houses in Sweden, Denmark, The Netherlands and Finland (11W/m2). The thermal performance and heating system efficiency need to be improved dramatically in order to contain the soaring energy demand tendency and mitigate the GHG emissions.
China’s policy makers have to address simultaneously the issues relating to security of energy supply, environmental concerns and people’s well‐being in the course of economic growth in China over the coming years. Energy efficiency will be the backbone of China’s energy policy with regard to multiple challenges; economists are concerned about the increase in social‐welfare through energy efficiency
1 This figure indicates the average building performance in the building code in most of northern part of China, the final consumption
improvement. The question about the social cost and benefit is fundamental in the public policies appraisals. In this regard, finding out the answer to the question about how to make right choice now in order to minimise the social cost tomorrow arises is of crucial importance. Therefore, the fundamental question arises about how China should shape the development prospects of energy supply and demand to ensure the GHG emission stabilisation over the next decades? Because the decision made today regarding the quality of buildings efficiency likely to have sequential impact on technological transition of energy supply and capacity building in dealing with the long term greenhouse gas emission mitigation to combat the global warming over the next decades.
However, from economic analysis perspective, investment decision on improving efficiency in the long life large‐scale infrastructure such as buildings raises a question about the rational choice of investment strategies relating to technological performance. Economists argue that market should be able to select out the best competitive technologies through the price and regulatory instruments, while the technical experts consider that it is already possible to deploy the most advanced efficiency technologies at scale. Judging between these arguments requires a systematic approach to combining the frameworks of both technical and economic analyses. The underlying question on the trade‐off between the long and short‐ term investment should be addressed. Based on analysis of previous studies on China’s energy demand prospects and environmental implications, we found that the research findings in existing literature do not allow us to identify an optimal trajectory of investment decision on buildings energy efficiency improvement and different strategies of development of energy supply infrastructure in China. The motivation of this research is to bridge the gap between the macroeconomic analyses and sectoral strategy in light of determining an optimal trajectory to building energy efficiency development such that the social costs can be minimised to create future benefits that can be used to finance investment in new technology innovation and deployment. The research attempts to construct a new framework to identify the optimal trajectory of Chinese building efficiency regulation over the next 25 years based on a case study in a northern city, along with the analysis of institutional organisations of property and energy market. The primary scope in this research is to assess the impact and consequences of investment decision taken today on the city’s financing capacity in adopting new technology of sustainable energy supply and decarbonisation in the future based on a quantitative analysis approach. By modelling different storylines of building energy performance uptake scenarios, an interactive dynamic link can be set up to bridge the gap between now and tomorrow’s decision priority on investment in demand and supply side technologies. The first part of research attempts to identify appropriate strategies of buildings energy efficiency improvement within a long‐term techno‐economic analysis framework based on two different scale: today’s strategy in buildings construction in a new residential area; 2). a dynamic building stock in a whole city throughout the period 2005‐2030. A sequence of decision on investment in quality improvement in both supply side and demand side infrastructure will be assessed in this case. Consequently, the findings of modelling will be taken as basis of policy instruments design in part two in which we try to identify
effective economic and policy mechanisms to facilitate efficiency upgrading implementation to achieve the optimal trajectory in the context of fast‐ growing urban development in China.
1.2 Economics of building energy efficiency
The economic dimension is far from negligible in analysing the policy instrument for building energy efficiency. The choice of energy performance made for large‐scale and long‐life infrastructure like buildings implies a strategy of trading off the long and short‐run investment. Investing in building efficiency to reduce the demand does not pretend to compete for financing resources with supply‐side technological innovation (CCS, clean coal technology for example). Investing in efficiency enhancement in energy‐ consuming infrastructure today anticipates the increasing demand for energy services and facilitates transition and scale‐up of these new low‐carbon technologies tomorrow. In other words, the question arises for policy makers about whether we should invest immediately in the high‐end new technology while ignoring potential soaring demand if the infrastructure constructed today lack efficiency and it will become very difficult and costly for the society to replace and retrofit before retiring or alternatively, we accept a reasonable increase in up‐front construction cost to ameliorate the efficiency performance of buildings to reducing significantly lifecycle costs associated with supply capacity addition , energy resources consumption and environmental impacts over several decades.
Building energy efficiency practices are supported by a number of persuasive arguments. As summarized in “the Best Practices Guide: Economic and Financial Evaluation of Energy Efficiency Projects and Programs”, improving energy efficiency is based on two‐tiled analysis: energy supply and efficiency (The Energy Group Institute of International Education Washington, DC; Econergy International Corporation Boulder, Colorado).
1.2.1 Energy Supply
Investing in supply is a capital intensive undertaking, usually paid primarily in foreign exchange adding currency risk to the investment equation. Already a large part of public investment budgets, additional investments in supply can have difficult financial consequences and damaging environmental impacts. Even if the money is available, it is difficult to expand supply capacity quickly. Increasing energy supply involves building generating facilities funded with equity and long term non‐recourse debt. The variety of funding sources includes equity from developers, investment funds, venture capitalists, utilities; and debt from capital markets, development banks, or commercial banks. Revenue is realised from the electricity generated and sold, typically through power purchase agreements with utilities. The significant direct project costs include designing, building, operating, and retiring a generation facility, while the indirect project expenses include social and environmental costs. In building additional supply capacity there are formidable performance risks, fuel cost fluctuation risks, and credit risks.
1.2.2 Energy efficiency
Energy efficiency, on the other hand, reduces the need to build additional capacity by reducing energy demand. It decreases the environmental impacts of increased generation through avoided demand. Energy efficiency decreases life cycle costs to consumers while also reducing system‐wide capital costs. Efficiency can be achieved through improvements to a variety of systems including HVAC, motors, drives, lighting, and controls.
Projects can be funded via grants, low‐interest loans, market‐rate loans, leases, or performance contracts from funding sources including Energy Services Companies (ESCOs), utilities, capital markets, equipment vendors, or development banks. Energy cost savings result in cash flows for energy efficiency projects. Direct project costs include design, installation, and maintenance of the energy efficiency measures. Energy efficiency projects tend to be on a much smaller scale than generation projects, occurring at numerous sites with highly engineered technology. However, BEE projects entails risks perceived by the actor, such as the possibility that actual measured savings may not meet projections, credit risk, currency risk, and the potential for facility operating changes. 1.2.3 BEE and Security of Supply China is on a crossroad of its economic development and the build‐up of a well‐being society. An average growth rate of 9.7% per annum has been sustained over the last 20 years. With a fifth of global population, China contributed to 13.8% of global economy growth over the period 2002‐2005 (China Daily 2007). The fast growing economy was accompanied by spectacular increase in energy demand and amounting concerns about the environment impact associated with economic expansion. China becomes a net oil importer since the 1993. . As shown in Figure 1‐1, China has experienced a steady growth of oil demand in the past 20 years and is more and more relying on imported oil which increased strongly by 75 per cent between 2002 and 2004 (Zaouali, 2007). Given this extraordinary need for oil, the domestic offer in oil resources is no longer able to keep up with the Chinese demand. In 2006, China contributed to 80 per cent of world oil consumption growth and oil import dependence reached 60 per cent and is likely to surpass 80 per cent by 2030 (IEA, 2007).
0 2000 4000 6000 8000 65 70 75 80 85 90 95 00 05 O IL th o u sa nd b b l/ d
Oil consumption in China 1965-2006
0 1000 2000 3000 4000 93 94 95 96 97 98 99 00 01 02 03 04 05 06 IMPORT 1 000 b b l/ d Oil import Figure 1‐1 China’s oil consumption 1965‐2006 and net oil import since 1993 (BP, 2007) A snapshot of energy supply security in China is summarised in Box 1‐1. Box 1‐1. Security of energy supply
Despite the impressive achievements in the energy sector, China’s policy makers face growing concerns about the country’s energy future. From the early 1980s to the mid 1990s, China managed to achieve high economic growth with near self‐sufficiency in energy supply. However, during the second half of the 1990s, China gradually emerged as a net importer of energy, and by 2006, its dependence on oil imports had soared to about 60 per cent of consumption as much as 80 per cent of oil consumed in China will be imported in 2030 (IEA,2007).
Energy sources in China are unevenly distributed, most of coal and hydropower sources are located in the west of the country, and the most important natural gas field is also situated in the far West in the province of Xinjiang. Whereas most of demand for energy consumption come from the Eastern part, in particular coastal area, and Central provinces of China. Coal transport represents about 50 per cent of domestic railway transport in China. Although China is generously endowed with renewable like hydropower, wind and biomass; only 27 per cent of total potential of hydropower has been exploited in China, and biomass is mainly used in China’s rural area (mainly the firewood and crop stalks), biomass has a huge a potential of energy in China, it is estimated that the total exploitable energy potential of crop stalks in China amounts to as much as 519 Mtoe per annum (Jiang,2007).
Oil and gas Reserves will be insufficient to meet the projected growth of demand if current trends continue, the prospect of a continuing rise in oil imports and high price, geopolitics complex have led the Chinese government to seek to curb the growth in demand drastically. Thus Energy savings through the improvement of energy efficiency in all the sectors becomes the top priority of China’s energy policy. Energy targets have been set for all provinces; the Chinese government has recently increased the tax on energy‐intensive products(IEA,2007).
Energy efficiency has attained ever greater prominence over the past years as the main approach to addressing both energy security and environmental concerns (IEA, 2007). The National Development and Reform Commission (NDRC), China’s energy policy formulation authority, set out specific energy efficiency improvement targets for industry, transport and building sectors in the long and medium‐term energy conservation plan.
Managing the increasing energy demand from demand side can also strengthen the security of supply of coal indirectly. Coal supply accounts for nearly 50 per cent of Chine railway transport as most of major consumption sites are far away from the mining source. Coal production and transport related accidents in China accounts for nearly 80 per cent of the world and coal mining is the most deadly job in China (China Daily, 2004‐11‐13).
1.3 Cross‐review of previous scenarios analysis
China has become a key player on the global energy market with a share of 15.6% of the world’s total energy consumption (BP, 2007). China’s energy demand has increased spectacularly to keep in pace with rapid expansion of the industrial and commercial sectors, as well as that of households, which are experiencing a new standard of living. China is now the second biggest energy consumer behind the USA and is expected to top the latter by 2010(IEA, 2007). The primary energy demand in China increased from 416 Mtoe in 1980 to nearly 1700 Mtoe in 2006, with an average growth rate of 5.55% per annum over the period. Historical primary energy demands in China and energy supply structure in the world are plotted in Fig.1‐2. Nevertheless, as pointed out by (Kahrl and Roland‐Host, 2006), this average growth rate is somewhat misleading, since primary energy consumption grew by an annual average of 3.2 % by 2000; but 10.8 % between 2000 and 20042. Energy consumption increased sharply over the period 2002‐2005 and dominated GDP’s growth, the energy elasticity with respect to GDP exceeded 1, and annual energy demand growth rate is 15.9% in 2004! Coal is overwhelmingly predominant energy source in China accounting for nearly 70% of total energy consumption. About 1080 mtoe of coal was consumed in 2005, equivalent to 37% of the global coal consumption in the world. By comparison, the world average level was only 23% in 2002 (IEA, 2004) and 28% in 2005 (BP, 2006).
2 Here we use the NBS’ official energy statistics in China, whereas the data of BP 2006 or IEA 2006 will give quite different output resulting from divergence of energy data collection in their statistics. For instance, BP’s statistics reveals an average growth of 5.1% per year over the period 1990-1999 and 10.2% from 2000-200-. Similarly, IEA’s statistics include non commercial energy consumption (biomass in rural area) which is not taken into account in NBS’s compilation.
0 4 0 0 8 0 0 1 2 0 0 1 6 0 0 2 0 0 0 8 0 8 5 9 0 9 5 0 0 0 5 C OAL O IL H YD R O G AS N U C L EAR
Primary energy demand in China 1980-2006
Mt o e COAL OIL HYDRO GAS NUCLEAR China USA OECD WORLD
Energy Mix in the World
Figure 1‐2: Primary energy demand in China and primary energy mix in the world (BP 2007, biomass excluded) 1.3.1 Approach in previous studies
Energy demand scenario analysis has become increasingly important in recent literature on economic modelling of climate change due to the fact that energy sector is the foremost contributor to greenhouse gases emission. A large number of recent researches forecasted the medium and long run energy consumption in China at different time horizons (2010, 2020 or 2030) and assessed relevant economic and environmental consequences. Different methodologies have been employed and the relevant results vary significantly.
NDRC (2004) and ERI (2003) report energy projection to 2020 with a bottom‐up approach of both on demand and supply sides. On the other hand, IEA (2004, 2006, 2007), Jiang and Hu (2006), EIA (2006) provide forecast to 2030 with general equilibrium model or specific emission scenario model. They integrated in their models the interaction dynamics between energy demand and China and the world’s economic prospect.
Moreover, some technology‐oriented models have shown the way of modelling the energy system development path with the given environmental constraints in the future. From energy system optimisation perspective, one of prominent paper is done by Larson et al., (2003) who calibrated the MARKAL‐China model which represents China's energy system comprising all sectors of the economy and including both energy conversion and end‐use technologies. Their scenarios portrayed a general picture of energy‐supply and demand in China from 1995 to 2050. The most striking point in the conclusion of their analysis is that even when significant limitations on carbon emissions were stipulated, an advanced energy technology strategy on the basis of the author’s technology‐cost assumptions would not incur a higher cumulative (1995–2050) total discounted energy system cost than the business‐as‐usual strategy. This result has a strong energy and environmental policy implications in China. From econometric analysis prospective, models work quite well for near term energy demand projection based on the historical time series data. However these models are not very consistent with time‐dependant fast‐evolving factors due
to failure to capture the unpredictable political or economic structure change and technological breakthrough in the longer term. 1.3.2 Results of scenarios 1.3.2.1 Technology models NDRC (2004) and ERI (2003) have explored China’s energy future on the basis of bottom‐up approach to evaluating the energy technological change and environmental implications of specific policy implementation. These results represent the official perspective of the Chinese government regarding the long run energy policy. The main purpose of these studies was to help the Chinese policy‐markers clarify the energy and environment implications under different socioeconomic development patterns and geopolitical context in order to prepare relevant strategies.
1.3.2.2 Integrated model
Jiang and Hu (2006) elaborated different energy demand and production scenarios in China over the period of 2000‐2030 by using IPAC (integrated Policy Assessment for China)model which integrates selection of available efficiency technology, energy and environment policies. The model can evaluate the impacts of the energy use on environment both from a national and inter‐regional scope. Three scenarios have been formulated in their projections. Primary energy demand in China would amount to 2100 mtoe in 2020 and 2700 mtoe in 2030 in the baseline scenario, with an annual growth rate of 3.6%. Coal will still be the dominant energy source in China in 2030, sharing about 58% of total energy demand. The high energy demand scenario projected that primary energy demand would be 2900 mtoe, which implies a strong increase of energy demand in China, resulted in high concentration of energy intensive activities in China and better integration in global economy without difficulty of energy imports. On the other hand, the policy scenario favours energy conservation policies and imposes environmental constraints. Consequently, primary energy demand will be reduced by 12% in 2020 and 10% in 2030 by comparison with baseline scenario. It is worthy noting that the authors asserted in their conclusions that the policies should be formulated quite early to lowering the energy demand since the lifespan of technologies is very long and replacement needs a huge investment.
The International Energy Agency (IEA) publishes the global energy projection in Word Energy Outlook (WEO) biannually. WEO (2006) included two scenarios in China, 1. Reference scenario: China’s current economic development and energy consumption and supply technology tendency will continue, energy efficiency policies are not fully implemented in the country. 2. Alternative policy scenario under which it is assumed that more energy efficiency programs and renewable energies development would be realized which is obviously more sustainable. In this case, China will develop more rapidly the alternative energies: wind, geothermal, solar and biofuels etc., and will also improve energy efficiency in all end‐use sectors. It
is projected that China’s energy demand would increase to 2509 mtoe in 2015 and 3395 mtoe in 2030 in reference scenario, which accounts for respectively 17.8% and 20% of the total demand of the world. Alternatively, energy demand could be reduced by 5% and 15% in 2015 and 2030 respectively in policy scenario.
In WEO(2007), three scenarios of energy demand growth in China up to 2030 are formulated. Primary energy demand will increase from 1515 Mtoe in 2005 to 2626 Mtoe in 2015 and 3592 Mtoe in 2030 under the baseline scenario, this scenario represents a vision how china’s energy demand will grow if there were no change in current trend over the projection period. In contrast, in the policy scenario, energy demand could be reduced by 14.5% in 2030 with introduction of new efficiency policies besides the existing ones. Energy growth will be more sustainable and energy supply related investment can be reduced substantially. More efficient use of energy has huge environmental benefits compared to reference scenario. The CO2 emission in China can be stabilized soon after 2020. Besides the reference and policy scenarios, a high growth scenario in China is elaborated, under which China would have a higher economic growth rate resulting in faster increase in energy demand. Total primary energy consumption and energy related CO2 emissions would be 23% higher than in reference scenario. There would be a huge increase in investment of energy supply infrastructure, accumulated increase amounts to 5.1 trillion dollars in 2006 price compared to reference case (IEA, 2007).
The US Energy Information Administration (EIA) constructed three scenarios in International Energy
outlook 2006 on the basis of different assumption on world economic development perspective in the
horizon of 2030. The degree of increase energy demand is highly dependant on economic growth scenario in China in their model. The energy demand and environmental implications vary significantly among these scenarios. For China, total energy demand would range from 2390 to 3018 mtoe in 2020 , and from 2890 to 4278 mtoe in 2030. Likewise, CO2 emissions also depend largely upon the economic development perspective, the forecast projected the emissions would vary between 7164 and 9287 Mt in 2020 , and between 8652 and 13312 Mt in 2030 respectively. With the high economic growth pattern, energy demand will be 12.4% and 22% higher than the reference case in 2020 and 2030 respectively and energy related CO2 emission would be 13.7% and 24.2% higher respectively. 1.3.2.3 Econometric model projection Crompton and Wu (2005) provided a forecast of energy demand in China in 2010 by using BVAR approach. As mentioned earlier, energy demand in China increased dramatically from 2002. The forecast projected that natural gas will grow the most rapidly between all the fuels during 2004‐2010 with an average growth rate of 6.6 per cent per year, compared to 3.3 per cent for coal. Demand for coal will reach 1421 million ton of coal equivalent (Mtce ) accounting for 65.4 per cent in total primary energy demand in 2010. Indeed, demand for coal increased sharply in China since 2004, jumping 9.6 per cent to reach 1660 Mtce in 2005 and 10.6 per cent in 2006 (NBS Statistics Communiqué 2005, 2006). The forecast of Crompton and Wu (2005) on China’s primary energy demand is relatively conservative, in fact, the energy demand in 2010 projected in their forecast were already exceeded in 2005. Also, the forecast aggregated all the energy