1 COMPARING THE RESIDENT POPULATIONS OF PRIVATE AND
PUBLIC LONG-TERM CARE FACILITIES OVER A FIFTEEN-YEAR PERIOD: A STUDY FROM QUEBEC, CANADA
Gina Bravo1,2, Marie-France Dubois1,2, Nicole Dubuc2,3, Louis Demers4,5, Danièle Blanchette2,6, Karen Painter2, Catherine Lestage2, Cinthia Corbin2
1. Department of Community Health Sciences, Faculty of Medicine and Health Sciences, Université de Sherbrooke, Sherbrooke, QC, Canada
2. Research Centre on Aging, University Institute of Geriatrics of Sherbrooke, Sherbrooke, QC, Canada
3. School of Nursing, Faculty of Medicine and Health Sciences, Université de Sherbrooke, Sherbrooke, QC, Canada
4. École nationale d’administration publique (ENAP), Québec, QC, Canada 5. Centre de recherche du CHU de Québec, Québec, QC, Canada
6. Department of Accounting Sciences, Faculty of Business Administration, Université de Sherbrooke, Sherbrooke, QC, Canada
Corresponding author: Gina Bravo, PhD
Research Centre on Aging
University Institute of Geriatrics of Sherbrooke 1036 South Belvedere Street
Sherbrooke, QC, Canada, J1H 4C4 Tel.: 819-780-2220, ext. 45244 Fax: 819-829-7141
2 Link to this article: http://journals.cambridge.org/abstract_S0144686X14000725
How to cite this article:
GINA BRAVO, MARIE-FRANCE DUBOIS, NICOLE DUBUC, LOUIS DEMERS, DANIÈLE BLANCHETTE, KAREN PAINTER, CATEHRINE LESTAGE and CINTHIA CORBIN Comparing the resident populations of private and public long-term care facilities over a 15-year period: a study from Quebec, Canada. Ageing and Society, Available on CJO 2014 doi:
10.1017/S0144686X14000725
Published online: 29 August 2014
Acknowledgments
The study protocol and consent forms were approved by the Institutional Review Board of the University Institute of Geriatrics of Sherbrooke, Sherbrooke, QC, Canada, and by the Central Research Ethic Committee of the Quebec Ministry of Health and Social Services, Montreal, QC, Canada. The study was funded by an unrestricted grant from the Canadian Institutes of Health Research (Grant # 200972-SDA). As co-investigators, Gina Bravo, Marie-France Dubois, Nicole Dubuc, Louis Demers and Danièle Blanchette contributed to the design and execution of the study, analysis and interpretation of the results, and writing of the paper. Karen Painter, Catherine Lestage, and Cinthia Corbin supervised the collection of data, contributed to the interpretation of the results, and revised the paper.
3 ABSTRACT
In the province of Quebec, Canada, long-term residential care is provided by two types of facilities: privately-owned facilities in which care is privately financed and delivered, and publicly-subsidised accredited facilities. There are few comparative data on the residents served by the private and public sectors, and none on whether their respective population has changed over time. Such knowledge would help plan services for older adults who can no longer live at home due to increased disabilities. This study compared 1) the resident populations currently served by private and public facilities and 2) how they have evolved over time. The data come from two cross-sectional studies conducted in 1995-2000 and 2010-2012. In both studies, we randomly selected care settings in which we randomly selected older residents. In total, 451 residents from 145 settings assessed in 1995-2000 were compared to 329 residents from 102 settings assessed in 2010-2012. In both study periods, older adults housed in the private sector had fewer cognitive and functional disabilities than those in public facilities. Between the two study periods, the proportion of residents with severe disabilities decreased in private facilities while it remained over 80% in their public counterparts. Findings indicate that private facilities care today for less-disabled older adults, leaving to public facilities the heavy responsibility of caring for those with more demanding needs. These trends may impact both sectors’ ability to deliver proper residential care.
Key words: long-term care facility, ownership, older adults, disability, Canada
4 Introduction
As the population ages worldwide, growing numbers of older adults develop diseases that gradually impair their capacity to function independently. Most people wish to remain in their own homes for as long as they can, despite their disabilities (Wylde 2008). There comes a time, however, when staying at home is no longer possible, due in part to reduced capacity of informal support to cope with increasing disability and shortage of publicly-funded homecare services (Carrière et al. 2007; Golant 2008).
In the province of Quebec, Canada, where this study was conducted, two types of long-term care (LTC) settings exist for disabled older adults seeking an alternative living environment. The first type of settings, called “public LTC facilities” for the purposes of this study, are formally linked to the Ministry of Health and Social Services. They are regulated, inspected on a regular basis and required by law to provide a standardised set of services that are implicitly tailored to the residents’ needs. They vary in size, from family-type resources that accommodate a few older adults at a time, to large LTC centres (equivalent to nursing homes) that are generally reserved for those with the heaviest care needs (Government of Quebec 2008). Admission to public facilities is coordinated regionally, following a standardised assessment of applicants’ needs and availability of informal support. Monthly fees are fixed annually by the Ministry and
co-payments that residents must make are determined by each one’s ability to pay. In 2013, fees range from $863 CND in family-type resources to $1,742 CND for single room occupancy in a nursing home.
Privately-owned facilities for seniors, elsewhere called residential care facilities or assisted-living residences (Howe, Jones and Tilse 2013), form the second type of LTC settings. In
5 Quebec, over 90% of these facilities are for-profit organizations. They form a diverse mix of housing options in regard to admission and discharge policies, staff-to-resident ratios, health-related service offerings, and so on. (Lestage, Dubuc and Bravo 2008). They come in various shapes and sizes, from small family-run residences to large multi-storey buildings owned by corporate chains. Most target elderly persons with light to moderate disabilities who need assistance in basic and instrumental activities of daily living. Private facilities do not benefit from formal referral mechanisms. Admission is the responsibility of the owners, who must advertise their facilities to fill vacant units. However, because of reduced access to public settings, healthcare professionals often turn to the private sector when they need to relocate an elderly patient who cannot return home after discharge from an acute care hospital. In addition to room and board, private facilities may provide personal care, housekeeping services, supervision, management of medications and nursing care. The care delivered is privately financed – by the residents – and privately delivered. Monthly charges in for-profit facilities are influenced by local markets and services required. In 2012, the average rent for a private room, including at least one daily meal, ranged from $1,410 CND for residents requiring less than 1.5 hour of care per day to $2,323 CND for those with heavier care needs.
In the early 1990s, private facilities received much attention in Quebec, for two main reasons. The first is the unprecedented growth of the private residential care industry, which had expanded 250% over a 20-year period (Vaillancourt and Bourque 1989). At the time, 85,000 persons were living in private facilities, compared to 46,000 in their public counterparts. Among the Canadian provinces, it is in Quebec that this industry has grown the fastest, accounting today for half of the total bed supply (Canada Mortgage and Housing Corporation 2012a).1 Attention to private LTC settings was also spurred by highly-publicised cases of preventable deaths and
6 egregious abuse and neglect.2 Most situations were believed to be isolated and anecdotal, but no data were then available on the people living in these homes.
Between 1995 and 2000, we conducted the first study of private facilities operating in Quebec (Bravo et al. 1998; Bravo et al. 2001). The study was conducted in two regions that comprised 1.7 million people and were broadly representative of the province in regard to the proportion of adults aged 65 and over, the spectrum of housing options for disabled older adults, and the market share of the private residential care sector (Canada Mortgage and Housing Corporation 2012b). Randomly selected residents from these homes were assessed with respect to their cognitive and functional abilities. In order to interpret observed disability levels, we opted for a comparative design and also assessed residents from public facilities. In total, the sample included 451 residents from 145 care settings.
As expected, residents from public facilities were, on average, more disabled, both cognitively and functionally, than those living in private settings. Nonetheless, many residents from the private sector were found to have heavy care needs. These findings were worrying when coupled with the lack of qualified and experienced staff that characterised private facilities at the time. They raised doubts about the private sector’s ability to provide proper care to residents, doubts that were later confirmed (Bravo et al. 1999; Bravo et al. 2001). Our results contributed to the government’s decision to regulate the private residential care industry. Since 2007, property owners must obtain a certificate of compliance to house disabled older adults (An Act Respecting
Health Services and Social Services 2005). Certificates are issued by regional agencies after
7 The present study, conducted between 2010 and 2012, was motivated in part by the desire to describe the clientele that the private sector currently serves. Have its needs grown heavier over time, perhaps as a result of residents ageing in place and financial pressures that have forced public facilities to adopt more stringent admission criteria? Do private facilities today house clients who more closely resemble those found in their public counterparts, as observed in the United States and Australia (Calkins and Keane 2008; Ingarfield et al. 2009)? Or, conversely, have private facilities gradually shifted toward a less disabled clientele to facilitate obtaining their certificate without raising their operating costs? These are some of the questions the current study was designed to address. Its main objective was to compare the resident populations currently served by the private and public sectors and examine how each population had evolved since first assessed in 1995-2000. Few studies have compared these two populations over time (Zuliani et al. 2001; Li et al. 2010; Grabowski, Stevenson and Cornell 2012; Wysocki et al. 2012). Yet such information would inform public policy and aid in planning services for the elderly and allocating scarce resources more efficiently, in addition to highlighting areas for future research.
Methods
Population and sampling
The current study was identical to the one conducted in 1995-2000. Within two Quebec regions, it targeted all settings that had been in operation for at least three months. Those serving solely (often younger) residents with developmental disabilities were excluded. Eligible settings were then stratified according to size: small (1-9 beds), medium (10-39 beds) or large (≥ 40 beds). In each stratum, we randomly selected settings, in which we randomly selected residents. Eligible residents were aged 65 or over, had lived in the facility for at least three months, were not
8 waiting to be transferred to another setting, and had difficulties with two or more activities of daily living. This last criterion was motivated by the need to select residents who had some healthcare needs. We recruited two, three and five eligible residents from small, medium and large facilities, respectively. The stratum-specific numbers of facilities were established based on work by Cochran (1977) on multistage cluster sampling, and on variability estimates derived from our previous study (Bravo et al. 1998; Bravo et al. 2001).
Recruitment
Facility managers were informed of the study and its purpose through a personalised letter. Those who agreed to participate provided written informed consent and were then interviewed for information about themselves and the facility. At the end of the interview they were asked for a list of all residents who met our eligibility criteria. The residents randomly selected from these lists were then invited to participate in the study, first by the facility manager and then by our research personnel. Informed consent was provided by the resident or, in cases of severe cognitive deficits, by the resident’s legal guardian or advocate, usually a family member.
Data collection
Residents were interviewed in their own setting by a nurse or social worker experienced in assessing frail older adults. A questionnaire was used to gather socio-demographic data and record self-reported diseases. Cognitive abilities were assessed with the Modified Mini-Mental State (3MS) examination (Teng and Chui 1987). Total scores range from 0 (worst) to 100 (best); a score below 60 reflects severe cognitive deficits. Functional status was assessed with the revised version of the Functional Autonomy Measurement System (Système de mesure de
9 ability to accomplish 29 functions covering five sectors of activity: activities of daily living (ADLs, 7 items), mobility (6 items), communication (3 items), mental functions (5 items) and instrumental activities of daily living (IADLs, 8 items). Each function is rated on an ordinal scale from 0 (independent) to 3 (dependent) using information obtained through interviews with and observation of the resident or by interviewing a knowledgeable informant. Summing the ratings assigned to each function generates a total score out of 87. Clinically, a score over 40 is
considered indicative of a substantial loss of autonomy.
Statistical analysis
Private and public LTC settings were compared using Student’s t-test and the χ2 statistic. All analyses were conducted with SUDAAN (version 10, Research Triangle Institute, Research Triangle Park, NC, 2008), which allowed taking our two-stage stratified random sampling scheme into account. Sample weights reflecting the probability of selection into the sample were assigned to each resident and used in all analyses.
Results
Of the 146 eligible managers, 70% agreed to participate, compared to 97% in the first study (p < 0.001). Participation rates were similar in private and public settings (p = 0.700). Managers are described in Table 1 and facilities in Table 2. Observed differences between private and public settings were also present in 1995-2000 (Bravo et al. 1998; Bravo et al. 2001). Private facilities tended to offer their residents more privacy (fewer shared rooms, more private bathrooms, etc.) but fewer recreational activities and support services. Private facilities also had lower staff-to-resident ratios and more stringent admission policies than their public counterparts.
10 Of the 397 eligible residents, 83% were enrolled compared to 96% in the first study (p < 0.001). Participants and nonparticipants did not differ on age (p = 0.816) or sex (p = 0.487). Table 3 compares private and public facilities with respect to residents’ socio-demographic
characteristics. As in our previous study (Bravo et al. 1998; Bravo et al. 2001), residents were comparable on most characteristics.
< Insert Table 3 about here >
Clinical information about the residents is provided in Table 4. Those from public facilities reported poorer health and, on average, a heavier burden of disease. Consistent with these findings, between-group differences in cognitive and functional abilities were highly significant, both clinically and statistically. As was the case 15 years ago, residents from public facilities were on average much more disabled than their private counterparts, especially in medium- and large-sized facilities. Of note is the tendency for cognitive and functional disabilities to increase in the public sector as facility size increases (p = 0.106 and 0.022, respectively), while this phenomenon is not observed in the private sector (p = 0.595 and 0.700, respectively).
< Insert Table 4 about here >
The final set of analyses involved examining how the two resident populations changed over time. No differences were observed in resident socio-demographic characteristics, except for resident turnover. In public facilities, the proportion of sampled residents that had been admitted within the last year nearly doubled between the two study periods, from 32.7% to 62.5% (p = 0.011). Meanwhile, the corresponding proportions barely changed in private facilities (25.9% and 29.8% respectively, p = 0.679). Between the study periods, the proportion of residents with heavy care needs (3MS < 60 or SMAF > 40) decreased from 44.7% to 20.2% in private facilities
11 (p = 0.039), with little change occurring in their public counterparts (81.2% and 87.4%
respectively, p = 0.292). The differential impact of type of facility on change in resident acuity was significant (p = 0.032).
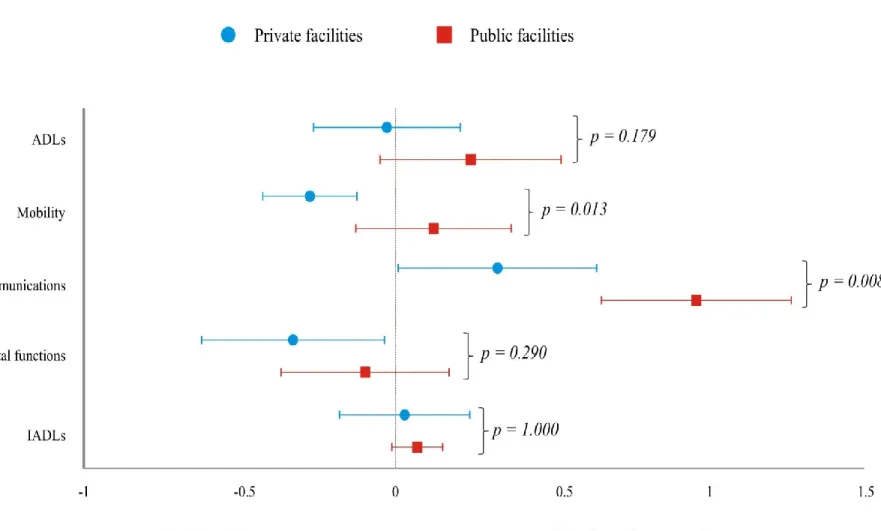
Lastly, Figure 1 compares the two residential care sectors on average changes in SMAF sub-scores over time. Except for the IADL sub-scale, confidence intervals for residents of private facilities were located to the left of those for residents of public facilities. This finding suggests that the care needs of the population served by the private sector have decreased, or have increased less than the needs of those admitted to public facilities. More specifically, mobility-related disabilities decreased significantly on average among residents of private facilities while they tended to increase in their public counterparts, resulting in a significant between-group difference in change scores (p = 0.013). Communication-related disabilities increased significantly in both types of settings but more so in public ones (p = 0.008). Differences in change scores were non-significant for the other sub-scales.
< Insert Figure 1 about here >
Discussion
We have drawn a comprehensive portrait of residents from private and public LTC settings, at a time when the private residential care industry in Quebec is subject to greater scrutiny from public officials. We have also examined the extent to which the populations served by the two sectors have changed over a 15-year period. We began by providing a detailed description of the facilities themselves, given variability in labelling conventions within and across countries (Howe, Jones and Tilse 2013; Harrington et al. 2012). Our findings are based on a longitudinal
12 design, although not in the usual sense. We did not follow the same residents over time, as few, if any, would still be alive today (Bravo et al. 2002). Rather, we conducted two cross-sectional studies, 15 years apart. Our random selection of settings and residents, coupled with the use of identical assessment instruments in the two studies, gives validity to the profiles we have established and to the comparison over time. Although lower than in 1995-2000, the relatively high participation rate in the current study, in terms of both facilities and residents, also inspires confidence in our findings.
A first set of results clearly shows that the public sector cares for residents with much heavier health-related needs than the private industry. The discrepancy between the two populations is particularly great in settings housing 40 residents or more. In private settings, resident disability levels do not vary with facility size. By contrast, in the public sector, those with the most acute needs end up in the largest facilities. In those settings, many residents have complex and diverse healthcare needs due to a severe stroke, respiratory disease (emphysema, chronic obstructive pulmonary disease), incontinence or advanced dementia. This is in keeping with recent
government policy, which reserves the large public institutions, better equipped with both human and physical resources, to those persons with the greatest healthcare needs (Government of Quebec 2003; 2005). The government steers those with fewer yet significant needs toward smaller, more homelike settings, leaving it up to the private sector to care for those with a less severe loss of autonomy who are nonetheless unable to remain at home. However, many private settings are highly selective in their admissions: for example, they may refuse individuals with incontinence or behavioural problems. Others will ask clients whose health is deteriorating to leave, even though relocation is known to further weaken frail older adults (Smith and Crome
13 2000). It should also be noted that most private settings are not accessible to low-income older adults.
Regarding change over time in the populations served by private and public residential care facilities, our results suggest that care needs have tended to become heavier in the public sector and lighter in its private counterpart. The over-time differences are not always statistically significant, perhaps reflecting a lack of power for within-type comparisons. However, the consistency we see in the direction of the differences lends support to our assertion. There is no doubt that the marked increase in client turnover in the public sector is making staff workloads heavier. It is much more demanding to initiate management of new residents, identify their needs and develop care plans accordingly, than it is to care for residents who have been living in the facility for several years, with whom the staff is familiar and whose health status is relatively stable. Regarding the private sector, Figure 1 shows that its current population has fewer mobility problems and better mental functions than did those it cared for 15 years ago. These changes, coupled with a 25% reduction in the proportion of residents with heavy care needs, are probably lightening staff workload.
The private sector’s decision to serve a clientele with lighter care needs is likely driven in part by the introduction of the certification process. It is true that it is easier to meet some of the
certification criteria, including those concerning fire safety and building compliance, with a less disabled population. Confronted with the need for major renovations to make buildings
compliant and improve safety, most operators reported having closed their doors to certain types of residents, particularly those with mobility problems or cognitive deficits – two groups that are harder to evacuate in the event of a fire.
14 The severity of residents’ needs is a major determinant of a setting’s capacity to provide quality care (Dubois, Bravo and Charpentier 2001). Given the finding that the needs of the population served by the private sector have lightened, future studies could examine whether private
facilities provide better care today than they did 15 years ago. Future studies could also focus on the needs of elderly persons who are not disabled enough to be admitted to public facilities yet are too disabled for private facilities seeking to maintain their compliance certificate without increasing their operating costs or raising their residents’ rent. Lastly, special attention should be paid to low-income older adults who, despite a significant loss of autonomy, do not have the means to enter a private facility. These elders are left with no residential care options and are forced to remain at home. They can be seen as collateral victims of the new certification policy. Whether their care needs are met, and by whom, must urgently be investigated.
Notes
1 Indeed, of the 204,496 beds that were on the private market in Canada in 2012, 99,565 were located in the province of Quebec (Canada Mortgage and Housing Corporation 2012a). An array of factors likely explains why the private market has expanded more in Quebec than in the rest of Canada. These include a rising demand for long-term care from an ageing population with
declining functioning, the rationalising of government-funded LTC beds to contain the growth of public expenditures, and underfunding of public homecare services.
2 See, for example, The Gazette. Deaths in Montreal fire are worst reminder of the
powerlessness of the aged, April 19 1992; When a house is not a home. All foster residences should be open to health inspection, June 2 1994; Advocates file complaint after elderly patient dies, March 6 1995; Sprinkler systems would save lives, September 4 1996.
15 3 Of note, the government had no financial involvement in private facilities before regulation was introduced and still does not contribute financially. Care provided in these facilities thus
16 REFERENCES
An Act Respecting Health Services and Social Services, c.S-4.2; Assemblée nationale du Québec,
Québec: Éditeur officiel du Québec, 2005, chapter 32, s. 346.
Bravo, G., Charpentier, M., Dubois, M.F., De Wals, P. and Emond, A. 1998. Profile of residents in unlicensed homes for the aged in the Eastern Townships of Quebec. Canadian Medical
Association Journal, 159, 2, 143-8.
Bravo, G., Dubois, M.F., Charpentier, M., De Wals, P. and Emond, A. 1999. Quality of care in unlicensed homes for the aged in the Eastern Townships of Quebec. Canadian Medical
Association Journal, 160, 10, 1441-5.
Bravo, G., Dubois, M.F., Tardieu, F., De Wals, P. and Tessier, S. 2001. Quality of care provided
in Montérégie residential care facilities [in French]. Final report submitted to the Regional
Agency of Health and Social Services, Sherbrooke, QC, 35 pages.
Bravo, G., Dubois, M.F., De Wals, P., Hébert, R. and Messier, L. 2002. Relationship between regulatory status, quality of care and 3-year mortality in Canadian residential care facilities: A longitudinal study. Health Services Research, 37, 5, 1181-96.
Calkins, M.P. and Keane, W. 2008. Tomorrow’s assisted living and nursing homes. In Golant, S.M. and Hyde, J. (eds), The Assisted Living Residence. A vision for the future. John Hopkins University Press, Baltimore, MD, 86-118.
Canada Mortgage and Housing Corporation. 2012a. Seniors’ Housing Report. Canada
Highlights. Ottawa, ON: Author.
Canada Mortgage and Housing Corporation. 2012b. Seniors’ Housing Report. Quebec. Ottawa, ON: Author.
Carrière, Y., Keefe, J., Légaré, J., Lin, X. and Rowe, G. 2007. Population aging and immediate family composition: Implications for future home care services. Genus, LXIII, 1, 11-31.
17 Cochran, W.G. 1977. Sampling techniques, 3rd edition. John Wiley & Sons, New York.
Dubois, M.F., Bravo, G. and Charpentier, M. 2001. Which residential care facilities are
delivering inadequate care? A simple case-finding questionnaire. Canadian Journal on Aging, 20, 3, 339-55.
Golant, S.M. 2008. The future of assisted living residences: A response to uncertainty. In Golant, S.M. and Hyde, J. (eds), The Assisted Living Residence. A vision for the future. John Hopkins University Press, Baltimore, MD, 3-45.
Government of Quebec. 2003. Home: The first choice. Policy on home care services [in French]. Québec: Direction des communications, ministère de la Santé et des Services sociaux.
Government of Quebec. 2005. Action Plan 2005-2010 on services for dependent older adults [in French]. Québec: Direction des communications, ministère de la Santé et des Services
sociaux.
Government of Quebec. 2008. The Québec Health and Social Services System in brief. Québec: Direction des communications, ministère de la Santé et des Services sociaux.
Grabowski, D.C., Stevenson, D.G. and Cornell, P.Y. 2012. Assisted living expansion and the market for nursing home care. Health Services Research, 47, 6, 2296-315.
Harrington, C., Choiniere, J., Goldmann, M., Jacobsen, F.F., Lloyd, L., McGregor, M., Stamatopoulos, V. and Szebehely, M. 2012. Nursing home staffing standards and staffing levels in six countries. Journal of Nursing Scholarship, 44, 1, 88-98.
Hébert, R., Guilbault, J., Desrosiers, J. and Dubuc, N. 2001. The functional autonomy measurement system (SMAF): A clinical-based instrument for measuring disabilities and handicaps in older people. Geriatrics Today, 4, 3, 141-7.
18 Howe, A., Jones, A.E. and Tilse, C. 2013. What’s in a name? Similarities and differences in
international terms and meanings for older peoples’ housing with services. Ageing & Society, 33, 4, 547-78.
Ingarfield, S.L., Finn, J.C., Jacobs, I.G., Gibson, N.P., Holman, C.D., Jelinek, G.A. and Flicker, L. 2009. Use of emergency departments by older people from residential care: A population based study. Age & Ageing, 38, 3, 314-8.
Lestage, C., Dubuc, N. and Bravo, G. 2008. Identifying characteristics of residential care facilities relevant to the placement process of seniors. Journal of the American Medical
Directors Association, 9, 2, 95-101.
Li, Y., Cai, X., Mukamel, D.B. and Glance, L.G. 2010. The volume-outcome relationship in nursing home care: an examination of functional decline among long-term care residents.
Medical Care 48, 1, 52-7.
Smith, A.E. and Crome, P. 2000. Relocation mosaic – a review of 40 years of resettlement literature. Reviews in Clinical Gerontology, 10, 1, 81-95.
Teng, E.L. and Chui, H.C. 1987. The Modified Mini-Mental State (3MS) Examination. Journal
of Clinical Psychiatry, 48, 8, 314-8.
Vaillancourt, Y. and Bourque, D. 1989. The privatization of housing services for seniors [in French]. Nouvelles pratiques sociales 2, 1, 53-71.
Wylde, M.A. 2008. The future of assisted living: Residents’ perspectives, 2000-2006. In Golant, S.M. and Hyde, J. (eds), The Assisted Living Residence. A vision for the future. John Hopkins University Press, Baltimore, MD, 169-197.
Wysocki, A., Butler, M., Kane, R.L., Kane, R.A., Shippee, T. and Sainfort, F. 2012. Long-term
care for older adults: A review of home and community-based services versus institutional care. Report No. 12(13)-EHC134-EF. Agency for Healthcare Research and Quality,
19 Rockville, MD.
Zuliani, G., Romagnoni, F., Volpato, S., Soattin, L., Leoci, V., Bolloni, M.C., Buttarello, M., Lotto, D. and Fellin, R. 2001. Nutritional parameters, body composition, and progression of disability in older disabled residents living in nursing homes. Journal of Gerontology:
20 Table 1. Characteristics of LTC facility managers in 2010-2012
Characteristic Private facilities (n = 66) Public facilities (n = 36) p-value Female 69.1 91.1 0.047
Age (in years) 48.8 ± 1.2 49.6 ± 1.2 0.652
Education
Grade 12 or less 43.3 17.2
College 43.1 19.7
University 13.6 63.1 0.004
Trained in nursing 16.5 65.7 0.001
Years managing the facility 6.5 ± 0.6 7.7 ± 1.2 0.406
Years of experience caring for older adults 11.7 ± 1.2 20.7 ± 1.8 0.001
21 Table 2. Characteristics of LTC facilities in 2010-2012
Characteristics
Private facilities (n = 66)
Public facilities
(n = 36) p-value
Occupancy rate (in %) 88.7 ± 1.9 98.3 ± 0.6 0.001
Offer …
single rooms 95.9 100 0.023
shared rooms 12.4 46.2 0.005
one-bedroom apartments 2.6 0 0.069
two-or-more bedroom apartments 22.1 0 0.016
All units equipped with a …
call bell 97.7 94.1 0.412
private phone 86.6 82.2 0.013
private toilet 54.4 2.8 0.001
private bathroom 37.0 0.9 0.001
Number of activities offered at least monthly (out of 4)† 2.7 ± 0.2 3.4 ± 0.2 0.012 Services offered
Meal preparation 99.5 100 0.176
Assistance with feeding 54.9 94.6 0.001
Personal care 88.5 100 0.034
Assistance with mobility/transfers 66.3 95.5 0.006
Housekeeping 94.7 100 0.063
Transportation 24.4 63.1 0.003
Medication management 96.4 100 0.030
24-hr supervision 96.3 95.5 0.834
Nursing care 34.2 59.0 0.099
Number of services offered (out of the 9 listed above) 6.6 ± 0.2 8.1 ± 0.2 0.001 Staff-to-resident ratio†† Licensed nurse 1.6 ± 0.35 12.1 ± 3.82 0.015 Nurse assistant 13.9 ± 1.23 29.7± 2.81 0.001 Psychosocial worker 0.1 ± 0.03 0.3 ± 0.06 0.003 Rehabilitation therapist 0 0.8 ± 0.17 0.001 Recreation manager 0.1 ± 0.04 0.7 ± 0.15 0.004
Do not admit someone who needs assistance with …
feeding 55.7 21.1 0.004 bathing 3.8 3.5 0.879 dressing 13.4 0 0.004 transfers 36.1 9.4 0.008 bladder incontinence 57.8 2.8 0.001 bowel incontinence 65.6 8.2 0.001
22 Table 2. Characteristics of LTC facilities in 2010-2012 (continued)
Characteristics
Private facilities (n = 66)
Public facilities
(n = 36) p-value
Do not admit someone who …
has light behavioural problems 11.8 0 0.018
has moderate-to-severe behavioural problems 81.3 35.4 0.005
requires a nurse on duty at all times 95.5 45.5 0.001
Steps taken when a resident’s care needs increase§
Apply for public homecare services 57.8 14.1 0.001
Request transfer 37.3 20.1 0.138
Keep resident 19.5 47.5 0.012
Allow residents to “die in place” 65.9‡ 87.6 0.038
Note: Data shown are percentage or mean ± standard error.
† games, dancing, physical exercises and religious activities †† number of full-time equivalents per 100 residents
§ more than one answer could be given
‡ conditional on assistance being provided by the resident’s family or health professionals from outside the facility
23 Table 3. Socio-demographic characteristics of LTC residents in 2010-2012
Characteristics Private facilities (n = 190) Public facilities (n = 139) p-value
Female 66.3 79.3 0.223
Age (in years) 87.0 ± 1.2 84.5 ± 1.1 0.135
Marital status
Married 12.2 19.6
Widowed 74.4 60.0
Single, divorced or separated 13.5 20.4 0.297
Education
Grade 7 or less 48.3 68.8
Grade 8 to 12 27.7 22.7
College/university 24.0 8.6 0.235
Perceived financial situation
Comfortable financially 42.7 10.4
Sufficient income 49.8 62.2
Poor or very poor 7.5 27.4 0.023
Years living in the facility 4.7 ± 0.7 2.3 ± 0.5 0.014
24 Table 4. Clinical characteristics of LTC residents in 2010-2012
Characteristics Private facilities (n = 190) Public facilities (n = 139) p-value
Perceived health status
Excellent 9.8 2.6 Very good 19.7 11.2 Good 48.8 34.4 Fair 21.1 34.7 Poor 0.7 17.1 0.019 Burden of disease† 5.9 ± 0.5 8.4 ± 0.8 0.019 Cognitive functioning 3MS score (/ 100) †† 72.5 ± 5.7 35.2 ± 4.1 0.001
3MS score by facility size (/ 100) ††
Small (1-9 beds) 69.7 ± 4.2 69.6 ± 3.7 0.980
Medium (10-39 beds) 72.9 ± 3.2 42.7 ± 5.8 0.001
Large (≥ 40 beds) 72.7 ± 7.3 33.2 ± 4.4 0.001
Functional autonomy
SMAF score (/ 87) § 28.4 ± 1.7 54.1 ± 1.4 0.001
SMAF score by facility size (/ 87) §
Small (1-9 beds) 29.0 ± 1.3 35.5 ± 2.5 0.034
Medium (10-39 beds) 30.5 ± 1.6 45.9 ± 1.7 0.001
Large (≥ 40 beds) 27.9 ± 2.1 55.5 ± 1.7 0.001
SMAF score by sub-scale (/ 3) §
ADLs 0.8 ± 0.10 1.9 ± 0.08 0.001
Mobility 0.5 ± 0.05 1.6 ± 0.07 0.001
Communication 0.7 ± 0.15 1.7 ± 0.14 0.001
Mental functions 0.5 ± 0.13 1.5 ± 0.08 0.001
IADLs 2.1 ± 0.08 2.7 ± 0.03 0.001
Note: Data shown are percentage or mean ± standard error.
† score created by weighting reported diseases by their impact on residents’ daily activities (none, a little, a lot)
†† a higher score implies better cognitive functioning § a lower score implies greater functional autonomy
25
Figure 1. Difference over time in mean scores and 95% confidence intervals, by SMAF sub-scale and facility type.
Note: Scores located to the left of the dotted line imply a decrease in average disability levels between the two study periods (i.e., less