HAL Id: hal-01387475
https://hal.archives-ouvertes.fr/hal-01387475
Submitted on 25 Oct 2016
HAL is a multi-disciplinary open access
archive for the deposit and dissemination of
sci-entific research documents, whether they are
pub-lished or not. The documents may come from
teaching and research institutions in France or
abroad, or from public or private research centers.
L’archive ouverte pluridisciplinaire HAL, est
destinée au dépôt et à la diffusion de documents
scientifiques de niveau recherche, publiés ou non,
émanant des établissements d’enseignement et de
recherche français ou étrangers, des laboratoires
publics ou privés.
A learning based approach for green software
measurements
Sarah Dahab, Stephane Maag, Alessandra Bagnato, Marcos Aurelio Almeida
da Silva
To cite this version:
Sarah Dahab, Stephane Maag, Alessandra Bagnato, Marcos Aurelio Almeida da Silva. A learning
based approach for green software measurements. MEGSUS 2016 : 3rd International Workshop on
Measurement and Metrics for Green and Sustainable Software Systems, Sep 2016, Ciudad Real, Spain.
pp.13 - 22. �hal-01387475�
A Learning based approach for Green Software
Measurements
Sarah Dahab, Stephane Maag
Telecom SudParis, CNRS UMR 5157, Univ. Paris-Saclay 9, rue Charles Fourier
91011 Evry, France
{Sarah.Dahab, Stephane.Maag}@telecom-sudparis.eu
Alessandra Bagnato and Marcos Aurélio Almeida da
Silva
Softeam Research & Development Division 8, Parc Ariane, 78284 Guyancourt, France {Alessandra.Bagnato, Marcos.Almeida}@softeam.fr
Abstract—Measuring specific software quality requirements in a continuous way and at runtime all along the development processes is crucial. Moreover, considering principles of measurement theory, it is still very complex to integrate green metrics in a common standardized and autonomous framework. In our approach, we propose an automated solution based on continuous analysis of SW green measurements, using at runtime a machine learning algorithm. The method allows to suggest and aid in the decision of the use of new or updated green metrics during the software measurement processes. Experiments are performed on the greentrace datasets.
Keywords—Software measurement, green computing, metrics, machine learning
I. INTRODUCTION
Quality of software engineering is related to technical and management factoid that has to provide useful metrics for quality requirements. Currently the assessment of these quality requirements is not automated, not empirically validated in real contexts, and the assessment is often defined without considering principles of measurement theory. Further, it is still very complex to integrate green metrics in a common standardized framework. Besides, it is difficult to understand where and how to improve the software (SW) following obtained measurements and green requirements. The main challenges are to define adequate and useful green metrics for quality requirements, software design documents and other SW artefacts (e.g., testing). Most of the time, the obtained measures are manually analyzed to target the specific requirements that have to be improved. Further, the ways of designing/integrating green concepts in a system, or to measure them on a SW, are often based on know-how and best practices transmitted between specifiers or developers.
The main scientific problematics that are tackled in our work are: (i) formally defining metrics and its supporting tools for measuring modern SW engineering activities with respect to green concepts, (ii) automatically analyzing the measurement results for identifying unexpected or undesired SW data, and (iii) the measurement process automation in order to reduce the development time. The herein approach proposes a highly automated and easy-to-deploy solution based on continuous analysis of SW green measurements,
using at runtime, a machine learning algorithm. It aims at defining, in an autonomous manner, updated green SW metrics or new ones that can be applied to the measured software in a recursive process. The metrics are chosen from the analysis of the measurements and the use of a runtime machine learning approach. Our methodology allows to improve the SW quality, to reduce the time to process, the software greenability and to decrease the development costs.
We summarize our main contributions as it follows : (i) a formal description of a green SW metric using the standard SMM, (ii) an autonomous SW green measurement framework based on a machine learning methodology to analyze the measures at runtime, and (iii) experiments based on the greentrace dataset illustrated our approach.
The paper is built as followed: Section II provides the state of art on green SW measurements. Section III presents the ITEA3 project MEASURE, Section IV defines our methodology, Section V describes the OMG standard and experiments in Section VI before concluding in Section VII.
II. RELATED WORKS
Software measurement researchers provide a rich literature for many years now. A measurement can be defined as “single-point-in-time data on a specific factor to be measured" produced as “results of data collection, analysis, and reporting”. A metric is seen as a "descriptions of data derived from measurements” [4, 5]. However, though SW measurements and metrics have been standardized for a while (e.g., ISO/IEC9126 software quality [3]), green SW metrics have been recently studied. In the following, we may cite the ones we get inspired in this position paper. In [6], the authors present a method to measure energy consumption of Java source codes. In a recent Journal paper [7], a conceptual framework is proposed. It focuses on existing techniques and provides a useful unit of measurement for estimating the energy consumption of software. Another interesting work [8] proposes an extension of the quality model standardized in the ISO/IEC25010 standard [9] with a new characteristic, the greenability, composed of three aspects: efficiency optimization, user’s environmental perception, and minimization of environmental effects. We also get inspired
by [10] that propose an interesting survey of green SW metrics from which we modeled ours.
Besides, while there is a current need for providing valid metrics, the literature still contains a highly diverse set of opinions on what constitutes a valid and efficient metric [12] and in particular from an industrial perspective [11,13]. For that purpose, learning techniques are currently arising to effectively refine, detail and improve the used metrics and to target more relevant measurements data. Current works such as [14-17] raise that issue by proposing diverse kinds of machine learning approaches for SW defect prediction through SW metrics. However, none of them tackle the green SW metrics suggestion at runtime by using semi-supervised machine learning methods. This is the objective of the approach we herein propose.
III. THE ITEA3MEASUREPROJECT
The MEASURE (Measuring Software Engineering) ITEA3 project has started in December 2015 [1]. Its goal is to increase the quality and efficiency as well as reduce the costs and time-to-market of software engineering in Europe. By implementing a comprehensive set of tools for automated and continuous measurement, this project provides a toolset for future projects to properly measure their impact. More importantly, it opens a new field for innovation. The innovation is in the advanced analytics of the measurement data presented in that paper. Within the MEASURE project, the OMG's Structured Metrics Meta-Model (SMM) has been selected as a standard to model that.
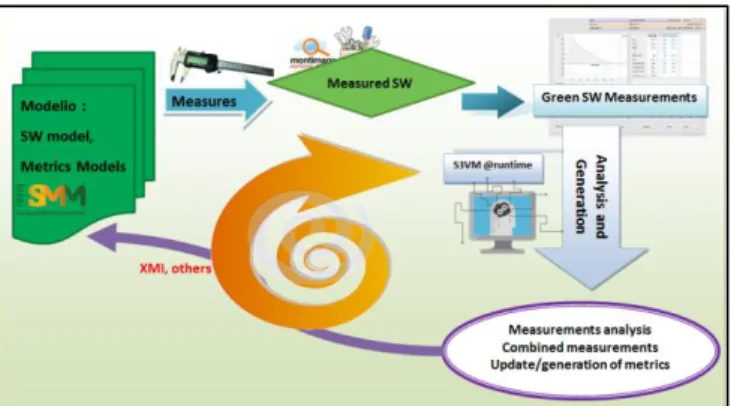
IV. OUR LEARNING BASED MEASUREMENT APPROACH As above mentioned, we aim at improving the software measurement processes by focusing on an autonomous SW green metric framework. This approach is based on a learning methodology allowing to analyze the results at runtime and during all along the software development process. Indeed, the main objective is to guide the measurements in a smart way by automatically refining it. Based on the measurements analysis and its interpretation, the next metric to be executed will be determined. It can be a novel metric which is the intersection of several metrics or one metric of the set initially defined. Then, they are provided as inputs to a new SW measurement cycle (containing notably the analysis and metric generation). By that way, a continuous measurement process on the SW architecture is defined, allowing, for each cycle, to execute the refined metrics or other metric, and to target suspicious failing aspects that could eventually cause green deficiencies. The Fig. 1 illustrates our approach. To perform the measurement cycle, our approach uses a machine learning process. From well-defined measurements classifications, based on expert decisions or known datasets, and obtained experimented results, we intend to detect suspicious or faulty values. We target specific quality aspects of the measured SW by applying, at runtime, new updated sets of metrics. The S3VM (Semi-Supervised Support Vector Machines) learning method [23] is herein used. Semi-Supervised
techniques allow a smart analyze in real time and during all the development process. The learning process occurs on the results of measures (measurements) applied on the software architecture. For that purpose, two datasets are needed: one for training, one for working. Training data are labeled and working data working are unlabeled. Based on training data, a Semi-Supervised algorithm is learning on working data, to provide a separating hyperplane that classifies data into different categories. The S3VM features aim at adding two constraints to each working data in order to minimize the classification errors. In our approach, we aim at using a set of green software metrics values, the “greentrace” dataset from the PROMISE public repository [19]. Greentrace contains the mean power consumption and the corresponding invocation count of system calls [18].
V. THE SOFTWARE METRICS META-MODEL
In our framework, our metrics will be specified in SMM using the tool Modelio [24]. One of our aims is to allow that tool to refine the running metrics into a continuous measurement process. We plan to obtain the green SW measurements using specific SW tools such as MMT provided by Montimage, a MEASURE partner.
A. The OMG SMM standard
The version 1.1.1 of the SMM specification [2] defines a meta-model for representing measurement information related to any model structured information with an initial focus on software, its operation, and its design. This specification is an extensible meta-model for exchanging both measures and measurement information concerning artefacts contained or expressed by structured models, such as MOF. SMM includes elements representing the concepts needed to express a wide range of diversified measures. With SMM, we can specify measures and their respective measurement results. The measure definitions make up the library of measures that serves to establish the specification upon which all of the measurements will be based.
As illustrated in the Fig. 2, the SMM meta-model allows to represent abstract Measures and concrete Measurements. For example, it would allow to represent a measure like Lines of Code and a measurement like File X has 537 lines of code. A SmmModel contains therefore MeasureLibraries and Observations. Measures are grouped into MeasureLibraries so that they can be shared among different
projects and tools. Each Observation represents an observation performed by an observer, with a tool on a given moment (whenObserved). An observation produces a set of
ObservedMeasures, each of them related to one specific
Measure, and for this measure, a set of Measurements.
B. The Modelio Tool
Modelio [24] is a modeling environment based on UML (Unified Modeling Language). It defines all UML concepts as mainly Interface, Class, Package, Attribute, Property, etc., and relationships between those entities as inheritance, implementation, association etc. Modelio allows to model software and business architectures and to generate XMI files from a model. From a model, it supports the code generation to C or Java. Modelio supports several OMG’s standards like SysML, MARTE, SoaML, UTP and SMM. This environment offers the possibility to extend its functionalities with the module addition which allows to create a new concept by specifying existing concepts.
VI. EXPERIMENTS AND RESULTS
Our approach is applied on a real case study as defined in [18], by using the Computational Energy Cost metric [20]. The experiments are performed on a Java-based SW. The computational cost is determined by CPU processing, memory access, and I/O operations costs.
As defined in [20], to compute the Computational Energy Cost of a Java-based software at component-level (public interface), it is necessary to compute the energy costs of the architecture JVM’s bytecodes, its native methods and its monitor mechanism execution while the interface method is invoked. The monitor mechanism, provided by the JVM, is used to manage threads synchronization.
To specify the Computational Energy Cost metric (CECm) in SMM, we define three measures which refer to those three cost types. One for the bytecodes execution cost called BytecodesMeasure (BM), one for the cost of native methods invoked called NativeMethodMeasure (NMM) and one for the monitor mechanism cost called MonitorMeasure (MM). We modeled the Computational Energy Cost metric in SMM using Modelio. The model is illustrated in the Fig. 3. This model is made of two SMM packages: Measure
Library contains all aspects about measures and Observation
contains the measure results. For each measure, a measurement is modeled by a UML class in the Observation package. Each of them is linked to its associated measure by an association UML link called ObservedMeasure. Concerning the Measure Library package, the three measures are modeling by a UML class and are associated to their unit of measure class called Joule, by an association link called UnitLink. Those are associated to a Scope element named JVM that defines the domain of measurement. The three measures compute different values of the same domain and return the same unit of measure. That is the reason why they are associated to the same Scope with a ScopeLink and Unit element. We reason in a similar way for the Characteristic element called EnergyConsumption. It computes the energy
consumption of elements of the same domain. The measure elements are matched to their characteristic by the TraitLink.
In our experiments, we aim at measuring the computational energy cost of a Java-based application as a mailbox call, which offers services such as sending, removing and saving data. During its real use by a user and as above-mentioned, our approach is learning on the greentrace dataset and obtains the three values corresponding to CECm measurements applied on that Java-based application. Each value is classified by the S3VM algorithm within two categories: suspicious value and not suspicious value. This classification is based on expert decisions concerning the threshold for this type of measurement. Herein the threshold is set to 20. Results strictly higher than 20 may reveal an issue. When the classification is done, the detected suspicious values are analyzed to determine the best next metric to run: one already defined or a correlation of several already existing metrics which is more specific to the measure of the corresponding suspicious value.
For instance, in our experiments, we obtained the following CECm measurements as illustrated in the Table 1. Based on [18, 20], we note that NMM and MM results are higher than the threshold determined by the SV3M algorithm applied on the greentrace dataset. They are then classified as suspicious values. These two costs are closely related to other green metrics. Indeed, NMM assesses the I/O utilization energy consumption and MM the data memory access energy consumption of the measured application.
TABLE I. CECM MEASUREMENTS RESULTS
Cost types Obtained measurements
BM 19.95698053846
NMM 22.09574430401
MM 21.90768412435
Thereby, the analyzing step of our prototype will generate two metrics whose their measurements focus on the concepts that highlight the obtained suspicious values:
- The I/O Usage Metric [21] measures the percentage of occupation of the I/O device and the number of messages transferred by an application over a system component set.
- The Memory Access Count Measure [22] that measures the number of memory accesses to the data memory.
They are used to execute, recursively, a novel green software measure process cycle to determine an application anomaly.
VII. CONCLUSION AND PERSPECTIVES
In this paper, we presented a novel autonomous software green measurement framework based on a machine learning methodology. It allows to improve the actual sequential and trace measurement process by analyzing the measures results in real time. We aim at improving the next measurement cycle to have information of possible failure during the development process. This smart measurement is then applied to the measured application (or system, service, embedded component, etc.) in an autonomous and recursive manner. Experiments based on the greentrace dataset are also performed to illustrate the feasibility of our approach.
Currently, our approach is based on the greentrace dataset while the common knowledge, good practices and know-how of the practitioners are not available online through a database or dataset. We plan to use such concepts to allow a better and refined learning classification (>2 classes) to improve the “metric management”. Further, through the MEASURE project, we expect to integrate our approach in a whole tool chain from the SMM modeling to the metric execution and measurements analysis.
ACKNOWLEDGMENT
The research leading to these results was partially funded by the ITEA3 project 14009, MEASURE.
REFERENCES
[1] ITEA3 MEASURE project, http://measure.softeam-rd.eu/, 2015 [2] OMG, Structured Metrics Meta-model (SMM), version 1.1.1,
http://www.omg.org/spec/SMM/1.1.1/, April 2016
[3] ISO/IEC 9126-1: Software engineering - Product quality - Part 1: Quality model, June, 2001
[4] R. M. Savola : A security metrics taxonomization model for software-intensive systems. Inf. Processing Systems 5(4), 2009 [5] R. B. Vaughn et al., Information assurance measures and metrics
- state of practice and proposed taxonomy. In the Proc. of the 36th IEEE Hawaii International Conf. on System Sciences, 2003 [6] J. Rocheteau et al., How Green Are Java Best Coding Practices,
In Proc. 3rd Int. Conf. SMARTGREENS, Barcelona, Spain 2014
[7] L. Ardito, G. Procaccianti, et al., Understanding green software development: A conceptual framework. IT Prof., 17(1), 2015 [8] C.Calero, M.A.Moraga, M.F.Bertoa and L.Duboc, Quality in Use
and Software Greenability, In Proc. RE4SuSy@RE, 2014. [9] ISO/IEC25010: Systems and software engineering -- Systems
and software Quality Requirements and Evaluation (SQuaRE) -- System and software quality models, March, 2011
[10] P.Bozzelli,Q.Gu and P.Lago, A systematic literature review on green software metrics. VU University, Amsterdam, 2013 [11] E.Bouwers et al., Evaluating usefulness of software metrics: an
industrial experience report. In Proc. of the IEEE Int. Conf. on Software Engineering (ICSE). Piscataway, NJ, USA, 2013. [12] A.Meneely et al., Validating software metrics: A spectrum of
philosophies. ACM Trans. Softw. Eng. Methodol. 21, 4, 2013. [13] Barbara Kitchenham, What’s up with software metrics ? - A
preliminary mapping study, J. Syst. Softw. 83, 1, 37-51, 2010 [14] I.H. Laradji et al., Software defect prediction using ensemble
learning on selected features. Inf. and Soft. Technology, 58, 2015 [15] Wei, Xiong, et al. An Embedded Software Power Consumption Model based on Software Architecture and Support Vector Machine Regression, International Journal of Smart Home Vol. 10, No. 3, pp.191-200, 2016
[16] Manjula.C.M. Prasad, et al., A Study on Software Metrics based Software Defect Prediction using Data Mining and Machine Learning Techniques, Int. J. of Datab. Th. and App., 8(3), 2015 [17] M. Monperrus, et al., Model-driven generative development of
measurement software, Softw & Systems Modeling, 10(4), 2011 [18] C. Zhang and A. Hindle, A green miner's dataset: mining the
impact of software change on energy consumption. In : Proceedings of the 11th ACM Working Conf. on Mining Software Repositories, 2014
[19] PROMISE, greentrace dataset, http://openscience.us/repo/green-mining/greentrace.html
[20] C. Seo, S. Malek, and N.Medvidovic. Estimating the Energy the Energy Consumption in Pervasive Java-based Systems. In Proc. of the IEEE International Conference on Pervasive Computing and Communications, PERCOM’08, USA, 2008
[21] A. Kipp, T. Jiang, and M.Fugini, Green metrics for energy-aware IT systems. In Proc. IEEE International Conference on Complex, Intelligent and Software Intensive Systems (CISIS), 2011 [22] A. Chatzigeorgiou and G. Stephanides, Energy Metric for
Software Systems. In Software Quality Journal, 10(4), 2002 [23] K. Bennett, A. Demiriz et al., Semi-supervised support vector
machines. Advances in Neural Inf. processing systems, 1999 [24] SOFTEAM, ModelioSoft, https://www.modeliosoft.com/, 2016 Figure 3 - The Computational Energy Cost metric model in SMM