HAL Id: tel-01761895
https://tel.archives-ouvertes.fr/tel-01761895
Submitted on 9 Apr 2018HAL is a multi-disciplinary open access
archive for the deposit and dissemination of sci-entific research documents, whether they are pub-lished or not. The documents may come from
L’archive ouverte pluridisciplinaire HAL, est destinée au dépôt et à la diffusion de documents scientifiques de niveau recherche, publiés ou non, émanant des établissements d’enseignement et de
Marion Vincent
To cite this version:
Marion Vincent. Measuring the Electrophysiological Effects of Direct Electrical Brain Stimulation during Awake Surgery of Low Grade Glioma. Neurons and Cognition [q-bio.NC]. Université de Mont-pellier, 2017. English. �tel-01761895�
Préparée au sein de l’école doctorale I2S Et de l’unité de recherche CAMIN
Spécialité: Systèmes Automatiques et Microélectroniques
Présentée par Marion Vincent
Mesure des Effets
Electrophysiologiques de la
Stimulation Electrique Directe du
Cerveau lors des Chirurgies
Eveillées des Gliomes de Bas Grade.
Soutenue le 7 Novembre 2017 devant le jury composé de
M. David Directeur de Recherche INSERM U1216 Rapporteur
Mme Marque Professeur Université de Technologie Compiègne Rapporteur M. Mandonnet Professeur, Praticien Hospitalier Université de Paris 7 Diderot Examinateur M. Bonnetblanc Maitre de conférence, HDR Université de Bourgogne Directeur M. Guiraud Directeur de Recherche INRIA Equipe CAMIN Co-directeur M. Duffau Professeur, Praticien Hospitalier Université de Montpellier Co-encadrant
Les gliomes infiltrants de bas grade OMS type II (GIBG) sont des tumeurs cérébrales dont le développement continu est lent. Ils envahissent progressivement les voies de la substance blanche. Il est désormais établi que les GIBGs changent de nature biologique et évoluent vers des gliomes de haut grade, avec une médiane de survie estimée à 10 ans [Duf05]. Alors que l’excision préventive de GIBGs a longtemps été discutée, cette option est désormais considérée comme la plus efficace. Ainsi, la chirurgie éveillée con-siste à retirer le tissu tumoral pour tenter de limiter son développement et retarder sa dégénérescence tout en préservant les fonctions (cognitives par exemple) : chez un patient éveillé, le neurochirurgien pratique une cartographie anatomo-fonctionnelle du cerveau en stimulant électriquement les zones proches de la tumeur, pour différencier celles qui sont fonctionnelles de celles qui ne le sont plus. Pendant la chirurgie le patient est im-pliqué et réalise des tâches comportementales d’intérêt (évaluations peropératoires). En induisant des perturbations transitoires chez le patient, la stimulation électrique directe (SED) permet de détecter en temps-réel des aires corticales et sous-corticales "essentielles pour la fonction" et ainsi de préserver la connectivité fonctionnelle. Opérer un patient conscient permet de retirer un maximum de tissu tumoral, tout en minimisant le risque de séquelles. Les effets inhibiteurs de la stimulation sont mis en évidence par les évaluations neuropsychologiques réalisées par le patient. Cependant les effets electrophysiologiques sont moins connus.
Afin de maximiser la résection et valider la connectivité anatomo-fonctionelle, il est nécessaire de connaître en temps réel et in vivo l’état électrophysiologique des réseaux fonctionnels activés. En effet, ceci permettra de comprendre la connectivité spatiale (et temporelle) ainsi que la dynamique des réseaux. On attend de telles informations qu’elle donnent une meilleure connaissance des mécanismes neurophysiologiques sous-jacents à la SED mis en jeu au niveau des réseaux à courte et longue distance.
En physiologie, un potentiel évoqué est défini par la modification de l’activité élec-trique du système nerveux en réponse à un stimulus externe. Enregistrer ces PEs donne des informations sur le fonctionnement des réseaux stimulés. Afin d’évaluer l’organisation des ces réseaux, des mesures de connectivités peuvent être utilisées.
Les potentiels évoqués fournissent une opportunité unique de suivre in vivo et de manière directe la connectivité entre aires corticales et sous-corticales. Dans le cadre de la chirurgie éveillée des GIBG, il est d’un certain intérêt de mesurer des PE:
Sur la surface corticale, lorsque la SED est appliquée aux environs du point d’enregistrement. Cela mettrait en évidence les effets locaux de la SED.
- En sous-cortical et en cortical, lorsque la SED est appliquée sur les voies de la substance blanche révélées par la résection tumorale, ou sur sa sortie corticale sup-posée. Ces mesures amèneraient de nouvelles conanissances sur les différentes étapes de la propagation de la SED dans les réseaux neuronaux et sur la connectivité sous-corticale entre les régions sous-corticales fonctionnelles.
- A distance du site de stimulation, telle que dans d’autres zones corticales distantes ou même une activité externe du cerveau. Dans ce cas, la réponse enregistrée ne serait pas un potentiel direct, mais plutôt une réponse intégrée, impliquant une plus grande population de neurones.
À ce jour, seules deux techniques d’enregistrement électrophysiologique permettent d’enregistrer des PE locaux et distants: l’électrocorticographie (ECoG, mesure directe invasive des zones corticales) et l’électroencéphalographie (EEG, mesure non invasive sur le crâne). En théorie, l’étude des caractéristiques des PE enregistrés peut également donner des informations sur la propagation du signal physiologique induit. En particulier, en corrélant les formes, les latences et les amplitudes des PE au type d’éléments neuronaux (par exemple fibre axonale, soma) et leur vitesse de conduction (par exemple myélinisée vs non myélinisés), on pourra supposer quels types de fibres sont activés.
Enregistrements ECoG peropératoires et potentiels
évo-qués
Les enregistrements présentés ci-dessous ont été réalisés sur six patients, après résection de la tumeur et une fois le patient rendormi (anesthésie générale) afin de ne pas perturber
le bon déroulement de la chirurgie. Le protocole expérimental mis en place pour réaliser les enregistrements ECoG peropératoires est détaillé ci-après.
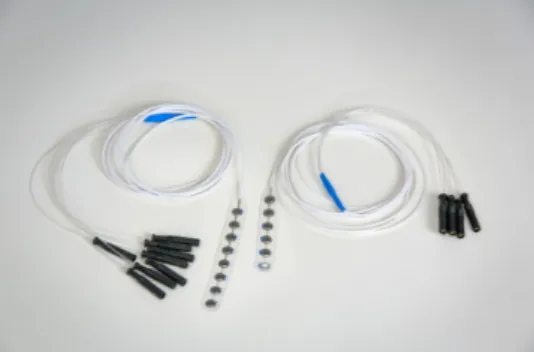
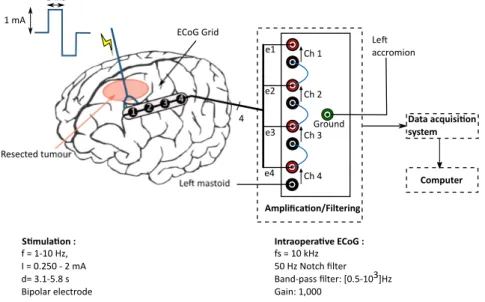
Une ou deux bandes (strip) de quatre électrodes (ECoG) sont disposées sur la surface exposée du cortex. Les enregistrements sont réalisés en mode différentiel (contacts 1 à 3) et mode référencé (contact 4). Le mode différentiel consiste à effectuer la différence des potentiels mesurés par deux électrodes actives adjacentes. Ainsi, seule l’activité élec-trique locale (sous les électrodes) est enregistrée, ce qui augmente la résolution spatiale et la qualité de la mesure. La mesure en mode référencée est quant à elle réalisée entre une électrode active, placée sur le cortex, et une électrode de référence (point électrique-ment "neutre"), localisée sur le mastoïde ipsi-latéral à la zone tumorale. Les signaux sont d’abord amplifiés (gain de 1000) et filtrés ([0.5 Hz ; 3 kHz]). La fréquence d’acquisition est fixée à 10 kHz. Un filtre réjecteur de 50 Hz est aussi activé afin de s’affranchir au maximum du bruit électrique environnant très présent au bloc opératoire.
L’effet des différents paramètres de stimulation, tels que la fréquence et l’intensité ont aussi été étudiés. La modulation fréquentielle (de 1 Hz à 30 Hz) doit permettre de voir si les PEs observés correspondent à des réponses "intégrées" par le cerveau ou des réponses synchrones d’un petit pool de neurones uniquement. En effet, on peut s’attendre à ce qu’une réponse intégrée varie en fonction de la fréquence car cette dernière porte de l’information. A l’inverse, une réponse purement électrophysiologique directe d’un petit pool de neurones ne doit pas dépendre de la fréquence de stimulation. La modulation en amplitude a pour but de mettre en évidence le seuil de déclenchement des PEs.
Pré-requis méthodologiques
Les signaux ECoG enregistrés sont composés des activités électriques basale et évoquée du cerveau perturbées par le bruit électrique ambiant et l’artefact de stimulation. Des pré-requis méthodologiques sont nécessaires afin de différencier les signaux physiologiques des perturbations induites par la chaine de mesure.
Dans ce but, l’artéfact de stimulation a été caractérisé car non seulement ce pulse, mais aussi son filtrage peut conduire à de mauvaises interprétations. Les caractéristiques techniques de la chaine d’acquisition étant connues, le filtrage de l’artéfact a donc été
simulé. Cette modélisation a montré que des oscillations dues au filtre réjecteur de 50 Hz (filtre notch) pouvaient apparaître. De plus, ces oscillations présentent le même décours temporel que les potentiels évoqués (période d’oscillation et latences d’une vingtaine de millisecondes). Cependant, afin de pemettre une visualisation des potentiels évoqués en temps-réel, l’utilisation de ce filtre est nécessaire dans l’environnement bruité qu’est le bloc opératoire. De plus, avec l’utilisation du filtre notch, le moyennage direct des stimuli n’est plus adapté, la réponse de l’artéfact s’annulant uniquement en cas de stimulation avec polarité alternée .
Une première manipulation peut aider à la distinction du signal physiologique de la réponse de l’artefact: la validité de tout potentiel évoqué peut être vérifiée en inversant la polarité du courant de stimulation, i.e. en inversant les pôles de la sonde de stimu-lation. La polarité des potentiels physiologiques est conservée, quel que soit le sens des pôles, alors que celle de l’artefact est inversée. Dans la plupart des cas référencés dans la littérature, le courant de stimulation biphasique est alterné dans le seul but d’effacer les artefacts de stimulation lors du moyennage des signaux. Cependant moyenner, dans ce cas, empêche la détermination du bruit électrique induit par le système d’acquisition.
Ainsi, une attention particulière doit être portée aux perturbations potentiellement in-duites par le système, et plus particulièrement par le filtrage. Dans notre cas d’oscillations résultantes du filtrage de l’artefact de stimulation, il est dans un premier temps nécessaire d’étudier les stimulations non pas dans leur ensemble (moyenne), mais stimulus par stim-ulus. Ceci permet d’identifier et retirer précisément ces perturbations non-physiologiques
[VGD+17].
Algorithme de correction de la réponse de l’artéfact
Retirer la réponse de l’artefact de stimulation (oscillations) consiste à soustraire le patron de sa réponse dont on ne connait pas l’amplitude. Un algorithme permettant un retrait op-timal de cette réponse a donc été développé. Ce dernier est basé sur la détection précise de la localisation de l’oscillation dans le signal suivie d’un retrait adaptatif de celle-ci. Dans l’optique d’une implémentation pour un traitement en temps réel, un calcul explicite est effectué (plutôt que des routines d’optimisation) à partir des extrema de l’oscillation. Le signal ECoG enregistré est composé de l’oscillation, du signal physiologique et de "bruit".
Pour limiter les effets de ces bruits dans la reconstruction du signal physiologique, une approximation linéaire au premier ordre en a été faite. Les composantes d’ordre supérieur ont été négligées.
L’algorithme a été appliqué avec succès sur des enregistrements ECoG peropératoires, permettant ainsi une meilleure visualisation des potentiels évoqués sur les signaux non moyennés.
Potentiels évoqués induits par la SED
Méthode d’analyse Sur tous les enregistrements ECoG réalisés, tous les canaux pour
lesquels la tension mesurée excédait les ± 5 V ont été rejetés, au regard des spécifications techniques de l’amplificateur (fiabilité de la mesure entre ± 5 V). Ceci a conduit à ne conserver que 351 stimulations sur 568, tout patient et canaux confondus (SED corticale : 230/376 (61%); SED sous-corticale : 121/192 (63%)).
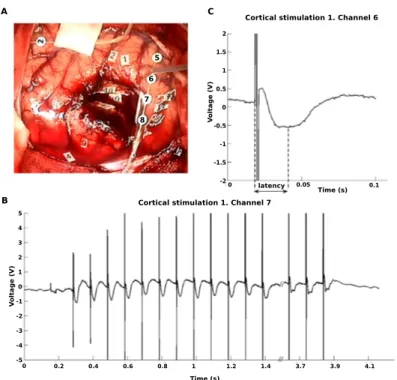
Pour chaque stimulation, les potentiels moyens ont été calculés en moyennant les stim-uli synchronisés sur le début de l’artefact de stimulation. Même s’ils sont visibles sur les signaux moyennés, les potentiels ne sont pas toujours présents après chaque artéfact. Ainsi, un seuil de significativité a été défini, afin d’accepter ou rejeter les signaux. Si un minimum de 50 % des stimuli n’induit pas de PE, alors le signal est rejeté, ceci même si le PE est visible sur la moyenne. Malgré un certain nombre de stimulations, des poten-tiels évoqués n’ont été mesurés que sur 35 d’entre elles. Deux caractéristiques, latence et amplitudes, ont été étudiées sur les potentiels mesurés. Celles-ci sont calculées relative-ment à la position de l’artéfact de stimulation, à la fois sur le signal moyenné, mais aussi indépendamment sur chaque stimulus.
Trois groupes de potentiels ont été mesurés : réponses corticales directes (DCR), po-tentiel évoqué axono-cortical (ACEP) et cortico-axono-cortical (CACEP). Les popo-tentiels corticaux ont été séparés en deux groupes suivant la distance entre le site de stimulation et leur site d’enregistrement. Les potentiels ont été considérés comme DCR pour des distances inférieures à 2 cm et CACEP pour des distances plus grandes.
Caractéristiques des potentiels évoqués Quels que soient les paramètres de
(< 2 cm) des sites d’enregistrement induit des DCR. Celles-ci apparaissent avec une la-tence de 26 ms après le stimulus. Les DCRs mesurées chez les patients inclus dans l’étude
sont semblables à celles décrites dans les travaux de Goldring et al. [GJH+61].
Cepen-dant, une augmentation de l’intensité de stimulation n’a ici jamais induit le second pic, ni les spikes.
Pour les ACEPs, deux profils d’ondes ont pu être observés. Le premier présente un unique pic N1 avec une latence d’environ 20 ms. Il s’agit très probablement des ACEPs
mesurés précédement par Yamao et al. [YMK+14] et Mandonnet et al. [MDP+16]. Le
second profil est composé du même pic N1 suivi après 20 ms d’un deuxième pic de même polarité.
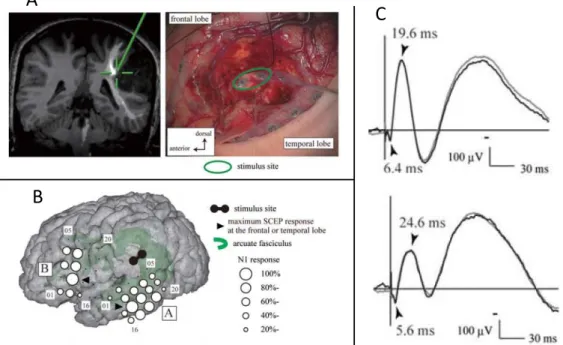
La SED corticale évoque des potentiels à des distances de plus de 2 cm. Ces CACEPs consistent en un pic avec une latence de 26 ms correspondant au pic N1 défini par
Mat-sumoto et al. [MNL+04, MNL+07]. Le second pic N2 mentionné dans ces études n’a
jamais été mesuré dans notre cas.
Ainsi le pic N1 apparaît comme une composante commune aux trois types de potentiels mesurés (DCR, ACEP, CACEP). De plus, ce pic N1 apparaît avec la même latence quel que soit le site de stimulation. Cette particularité laisse penser que la latence du pic N1 est limitée et déterminée au niveau de la sortie corticale.
Par conséquent, nous ne sommes pas en mesure de déterminer si la propagation de la stimulation induisant les DCRs se fait via les fibres U courtes, car elle peut être purement cortico-corticale. Dans le cas des ACEP, la vitesse de conduction de l’axone stimulé n’a aucune influence sur la réponse négative puisque sa forme et ses latences sont similaires aux DCRs et aux CACEPs. Enfin, pour les CACEPs, si les potentiels d’action se propa-gent sur l’épaisseur corticale, des latences plus longues et une forme plus large seraient attendues. Dans nos enregistrements peropératoires ceux-ci ressemblent à des ACEP, ce qui suggère qu’ils se propagent à travers les voies de la substance blanche sous-corticale.
Goldring et al. [GHG94] ont défini ce pic N1 comme le "potentiel négatif principal". La forme de cette première onde négative (grand PE avec une longue latence) suggère qu’aucun axone myélinisé n’a été impliqué dans cette réponse. Il est attribué à la réponse corticale des potentiels excitateurs post-synaptiques des dendrites apicales [LC62, SGO64].
Li et Chou [LC62] ont montré que pour des stimulations basses des trains de spikes suivaient ce premier pic N1.
Perspectives
La mesure électrophysiologique au bloc opératoire reste difficile : chaque patient est unique ; les signaux sont faibles et acquis dans un environnement électroniquement bruité. Au-jourd’hui, la fiabilité et la reproductibilité du protocole de mesure mis en place ont été validées. L’analyse des enregistrements recueillis sur six patients a donné des résultats prometteurs quant à la mise en évidence des effets de la stimulation électrique directe. Il est donc maintenant nécessaire de pousser plus loin l’analyse des potentiels évoqués, afin d’étudier les effets immédiats et persistants de la SED sur la connectivité entre différents sites. Ainsi, la prochaine étape devrait porter sur la relation entre les potentiels évoqués et les perturbations fonctionnelles induites chez le patient éveillé. Ceci peut être notamment fait en appliquant la SED et en enregistrant des PE sur des sites corticaux fonctionnels et non-fonctionnels précis et déterminés par la cartographie à 60 Hz sur un patient éveillé. A terme, l’état électrophysiologique (niveau d’excitabilité par exemple) d’une aire donnée pourrait être determiné en temps réel et in vivo par l’analyse des potentiels évoqués.
Mieux comprendre les mécanismes sous-jacents à la SED, notamment au travers de la mesure des réponses électrophysiologiques, doit permettre de proposer des protocoles per-opératoires plus objectivés. Cela doit rendre l’approche plus robuste encore aux variations liées au patient et à la chirurgie, et ainsi et diminuer plus encore les séquelles potentielles. Tout cela afin d’améliorer la planification chirurgicale et la qualité de vie des patients.
Résumé i
Nomenclature xii
List of Figures xiv
List of Tables xvii
General introduction 1
1 Direct electrical stimulation and brain mapping. 4
1.1 Surgery of diffuse low-grade glioma . . . 5
1.1.1 Low-grade gliomas (LGG) . . . 5
1.1.2 Awake surgery and direct electrical stimulation (DES) . . . 5
1.1.2.1 Stimulation modalities . . . 6
1.1.2.2 Functional assessment . . . 7
1.1.3 Clinical benefits of using DES in awake surgery . . . 7
1.2 Understanding the effects of DES on brain networks . . . 9
1.2.1 The brain connectome . . . 9
1.2.2 Necessity of an individual brain mapping . . . 10
1.2.3 Reliability of the functional and behavioral effects of DES . . . 11
1.2.4 DES clinical concerns . . . 12
1.3 Probing the functional networks connectivity . . . 13
1.3.1 Rationale of this work . . . 13
1.3.2 Cortical vs. subcortical DES effects: a first hypothesis . . . 13
1.3.3 Interest of electrophysiological recordings for brain mapping . . . . 16
1.4 Evoked potentials induced by direct electrical stimulation . . . 17
1.4.1.1 The action potential . . . 18
1.4.1.2 Brain electrical activity . . . 19
1.4.2 Electrical stimulation of nervous system . . . 20
1.4.2.1 Electrical stimulation technical principles . . . 20
1.4.2.2 Activation of neuronal elements by electrical stimulation . 22 1.4.3 From extracellular stimulation of an axon to brain direct electrical stimulation . . . 25
1.4.3.1 DES parameters: an empirical setting . . . 25
1.4.3.2 From biophysic theory to its application for brain ES. . . . 26
1.4.4 State of the art on evoked potentials induced by direct cortical and subcortical electrical stimulation . . . 28
1.4.4.1 Direct cortical responses . . . 28
1.4.4.2 Cortico-cortical evoked potentials . . . 30
1.4.4.3 Subcortico-cortical evoked potentials . . . 32
1.4.4.4 Limitations of evoked potentials mapping . . . 34
1.5 Objectives . . . 35
2 Intra-operative electrophysiological recordings for DES evoked poten-tials mapping 38 2.1 Recording brain activity . . . 39
2.1.1 Electrophysiological monitoring of brain activity . . . 39
2.1.2 Acquisition mode . . . 41
2.2 Data acquisition . . . 42
2.2.1 Material constraints . . . 42
2.2.2 Surgical theatre environment . . . 45
2.2.3 Data acquisition . . . 45
2.2.4 Overview on the experimental protocol . . . 47
2.3 Preliminary validation of the acquisition set-up with 10 Hz DES. . . 48
2.3.1 Methods . . . 48
2.3.1.1 Direct electrical stimulation and anatomical sites of stim-ulation . . . 49
2.3.1.2 Experimental protocol . . . 49
2.3.2 Evoked potentials induced by DES . . . 49
3 Stimulation artefact withdrawal method 53
3.1 Characterization of the amplifier’s filtering chain . . . 54
3.1.1 General theory on filtering . . . 54
3.1.1.1 First order high-pass filter . . . 55
3.1.1.2 Second order filters . . . 55
3.1.1.3 The 50 Hz–Notch filter . . . 57
3.1.2 Mathematical model of the filtering chain . . . 59
3.2 Characterization of the artefact . . . 61
3.2.1 Experiment . . . 62
3.2.2 Empirical determination of the 50 Hz–Notch filter damping factor . 63 3.2.3 Impact of the distance and orientation of the probe on the recorded signal . . . 64
3.3 Data processing . . . 67
3.3.1 Stimulation artefact detection . . . 67
3.3.2 Artefact correction method . . . 67
3.3.2.1 Model of the acquisition chain . . . 68
3.3.2.2 Artefact withdrawal . . . 69
4 Intra-operative evoked potentials induced by DES 74 4.1 Methods . . . 75
4.1.1 Direct electrical stimulation and functional mapping . . . 75
4.1.2 Intraoperative ECoG recordings and stimulation paradigms. . . 80
4.1.3 Trials selection and data processing . . . 82
4.2 Oscillation withdrawal algorithm validation on intra-operative recordings . 83 4.3 Evoked potentials . . . 84
4.3.1 Direct cortical responses . . . 84
4.3.2 Subcortico-cortical evoked potentials (ACEPs) . . . 87
4.3.3 Cortico-axono-cortical evoked potentials . . . 90
5 Discussion and conclusion 93 5.1 Methodological conclusions . . . 95
5.1.1 Methodological pitfalls when measuring evoked potentials in the brain 95 5.1.2 Assessment on the artefact withdrawal algorithm . . . 96
5.2 Evoked potentials induced by cortical or subcortical DES . . . 97
5.2.2 Stimulation’s intensity modulation and the conditions to obtain CA-CEP . . . 101 5.2.3 Frequency impact on EPs: why are 50 – 60 Hz DES commonly used?103 5.3 Towards novel ways of electrically stimulating the brain: insights from FES
of peripheral nerves . . . 106 5.4 Perspectives . . . 107
ACEP Axono-cortical evoked potential
AP Action potential
CACEP Cortico-axono-cortical evoked potential CCEP Cortico-cortical evoked potential
CSF Cerebrospinal fluid DCR Direct cortical response DES Direct electrical stimulation DM Differential mode
DTI Diffusion tensor imaging ECoG Electrocorticography EEG Electroencephalography EMG Electromyography ENG Electroneurography
EP Evoked potential
EPSP Excitatory post-synaptic potential
ES Electrical stimulation
fMRI Functional magnetic resonance imaging
iEEG Intra-operative electroencephalography IPSP Inhibitory post-synaptic potential
LA Local anaesthesia
LGG Low grade glioma
MEG Magnetoencephalography MRI Magnetic resonance imaging NoR Node of Ranvier
RM Referenced mode
RMP Resting membrane potential
SCEP Subcortico-cortical evoked potential SEEG Stereoelectroencephalography SLF Superior longitudinal fasciculus SPES Single-pulse electrical stimulation
1.1 Awake surgery of LGG and functional brain mapping. . . 6
1.2 Examples of surgical resection of the tumor, without functional consequence. 8 1.3 White matter connectivity: associative and projection pathways . . . 10
1.4 Schematic behavioural effects of cortical vs. subcortical stimulations. . . . 15
(a) Cortical mapping. . . 15
(b) Subcortical mapping. . . 15
1.5 Natural action potential. . . 19
1.6 Electrical stimulation types and parameters. . . 21
1.7 Stimulation configuration and the resulting activating function. . . 22
1.8 Strength-duration curve and electrical charge necessary to induce an AP. . 24
1.9 Strenght-duration curves for the studies listed in Table 1.2. . . 26
1.10 Representation of DCR components. . . 29
1.11 CCEP typical nomenclature. . . 30
1.12 Sucbortico-cortical evoked potentials. . . 33
2.1 Brain activity recordings. . . 39
(a) Recording techniques according to the brain “layers". . . 39
(b) Typical brain signals. From [BAK12] . . . 39
2.2 Temporal and spacial resolutions of functional neuroimaging techniques measuring electrophysiological brain activity. . . 40
2.3 EEG characteristics. . . 41
(a) EEG main frequency bands. . . 41
(b) International 10-20 system. . . 41
2.4 Nimbus i-Care stimulator. . . 43
2.5 Biosignal amplifier, g.BSamp. . . 43
2.7 Cortical electrode strip for intraoperative recording of brain activity - Dixi
Medical . . . 44
2.8 General recording set-up for one ECoG strip. . . 46
2.9 First intra-operative cortical EP induced by 10 Hz DES. . . 50
2.10 Second intra-operative cortical EP induced by 10 Hz DES. . . 51
2.11 Cortical EP distortions due to the acquisition chain. . . 52
3.1 Step response of an under-damped 2nd order system. . . 57
3.2 Twin–T Notch filter. . . 57
3.3 50 Hz–Notch filter Bode diagram. . . 59
3.4 Functional diagram of the filtering system. . . 59
3.5 Modelled filtering of the stimulation by the acquisition chain for different m values. . . 62
3.6 Experimental set-up for the stimulation artefact characterisation. . . 63
3.7 Dipole nomenclature. . . 64
3.8 Recorded voltage vs. orientation of the stimulation probe according to the recording electrodes. . . 66
3.9 General diagram of the acquisition chain. . . 68
(a) ECoG acquisition diagram. . . 68
(b) Stimulus filtering diagram. . . 68
3.10 Artefact simulation diagram. . . 69
3.11 Detection of the oscillations location in one ECoG raw signal. . . 70
3.12 Artefact withdrawal processing. . . 71
3.13 Processing of the reconstruction of the physiological signal. . . 72
3.14 Examples of oscillation withdrawal on ECoG signals, for cortical and sub-cortical DES. . . 73
4.1 Initial 60 Hz DES mapping for Patient 1. . . 76
4.2 Initial 60 Hz DES mapping for Patient 2. . . 76
4.3 Initial 60 Hz DES mapping for Patient 3. . . 77
4.4 Initial 60 Hz DES mapping for Patient 4. . . 78
4.5 Initial 60 Hz DES mapping for Patient 5. . . 79
4.6 Initial 60 Hz DES mapping for Patient 6. . . 80
4.7 DES trial rejection. . . 82
(a) Cortical DES. . . 82
4.8 DCR recorded on Patient 5. . . 85
4.9 2-peaks ACEP recorded on Patient 2. . . 87
4.10 Extracts of two raw subcortical DES, inducing ACEPs, for Patient 6. . . . 88
4.11 1-peak ACEP recorded on Patient 6. . . 90
4.12 CACEPs recorded for 3 channels, Patient 2. . . 91
5.1 EPs latencies in function of the distance from the stimulation site. . . 98
5.2 Cortical surface and neuron responses to single shocks of gradually increas-ing strength. . . 99
5.3 Amplitude of surface-negative waves recorded from surface and synaptic potentials recorded from a neuron. From [LC62] . . . 100
5.4 Surface responses for different stimulus strengh. . . 101
5.5 Effects of stimulation characteristics on CACEPs. . . 103
(a) Superficial cortical effects of the ES . . . 103
(b) Deeper cortical effects . . . 103
1.1 Chronaxie for different elements of a neuron. . . 24
1.2 Main characteristics of various DES protocols. . . 27
3.1 50 Hz–Notch filter technical characteristics. . . 64
3.2 Comparison of theoretical and recorded artefacts direction . . . 67
4.1 Stimulation paradigms . . . 81
4.2 Computed parameters of the oscillation withdrawal algorithm. . . 84
4.3 Direct cortical responses. . . 86
4.4 Subcortico-cortical potentials. . . 89
Being able to change or inhibit the activity of a region or population of neurons in the brain is an essential approach in fundamental neuroscience, because it helps the researcher to determine the functional role of neurons. This approach is also important at a more applied level, such as when assessing the functional status of tissues around a particular lesion during neurosurgery. It is well known that electrical stimulation (ES) affects neural activity by modifying the voltage gradient across the neuronal membrane. When a cur-rent crosses cells, it can change their membrane potential and trigger neuronal responses. However, this general principle can be applied via several different in vivo approaches.
In vivo brain ES was developed more than a century ago. Indeed, Fritsch and Hitzig [FH09] first developed ES of the brain (in the dog) during the 19th century (1870). By stimulating the motor cortex and eliciting movements, they showed that the brain was divided into different functional areas. Direct application of ES to the exposed surface of the brain is usually referred to as direct electrical stimulation (DES). After this pioneer-ing work, DES was used to characterise the organisation of the brain motor centres in the macaque [Fer74] and in great apes [SG01]. Leyton and Sherrington [LS17] reported the orderly mapping of different areas of the body along the precentral gyrus but noted a significant degree of overlap between the different representations (see also [Lem08]). During the same period, Krause [Kra09] and Cushing [Cus09] were among the first to perform DES on the human brain and thus elicit motor responses. Subsequent experi-ments with DES of the motor cortex in humans [PB37, Pen47] prompted the concept of a simplified somatotopic representation of the body on the cortical surface (the so-called homunculus). Very early on, some researchers attempted to relate the effects of DES to the functional and physiological properties of the cortex. Hence, Vogt and Vogt [VV19] used DES to link different brain functions to the underlying cortical architectonics. Foer-ster and Altenburger [FA35] were the first to use electrocorticography (ECoG) to record electrophysiological responses to DES in various parts of the brain distant from the motor
areas. Purpura et al. [PPF+57] used DES of the human cortex to study the contribution of dendritic potentials to the modulation of electrical activity at the surface of the brain. DES (as used by Ferrier (1874) and Penfield (1947)) is still an important technique for the functional investigation of the human brain. In the last decades, DES was successfully used to guide resection during wide-awake neurosurgery of slow-growing, infiltrating brain tumours [Duf05, DBD07].
The “Awake brain surgery” combined with direct electrical stimulation (DES) mapping consists in removing some slow-growing brain tumour tissue (low-grade glioma , LGG) to delay its development while preserving the functions: in an awake patient, the surgeon performs an anatomo-functional mapping of the brain by electrically stimulating brain areas near the tumour to discriminate functional versus non-functional areas. During the surgery, the patient undertakes behavioural tasks of interest. The DES procedure associated to the intra-operative functional assessments is a critical aspect. However, our current understanding of the electrophysiological effects of DES remains limited. For in-stance, few is known about the spreading of DES currents within the brain, particularly through subcortical networks.
In light of these observations, this work aimed at better understanding the electrophys-iological effects of DES during awake surgeries, and in the end, improving the protocol of electrical stimulation and the functional mapping. We performed electrophysiological intra-operative recordings on several cortical sites.
The structure of the thesis is as follows.
Chapter 1 gives a brief description of the diffuse low-grade glioma pathology and intro-duces the awake brain mapping surgery procedure. The biophysical principles of neural activity and ES of neural tissue are then detailed. A review of the evoked potentials measurement is finally described.
Chapter 2 deals with the design of an acquisition chain for intra-operative electrophysi-ological recordings of brain activity. The chapter also validates the developed set-up with cortical EPs recordings on one patient undergoing awake surgery of LGG. The criterion for the acquisition chain selection, the experimental setup and the protocols are explained.
In Chapter 3 a method of stimulation artefact removal is proposed, to disentangle the physiological signals from the purely electrical ones (only linked to the stimulus artefact). Chapter 4 reports the intra-operative ECoG recordings performed on six patients. Evoked potentials obtained from the post-processing of these recordings, i.e. once the stimulation artefact algorithm applied, are then presented.
Chapter 5 summarizes the results and conclusions of this thesis and proposes perspec-tives for future investigations.
Direct electrical stimulation and brain
mapping.
Contents
1.1 Surgery of diffuse low-grade glioma . . . 5 1.1.1 Low-grade gliomas (LGG) . . . 5 1.1.2 Awake surgery and direct electrical stimulation (DES) . . . 5 1.1.3 Clinical benefits of using DES in awake surgery . . . 7 1.2 Understanding the effects of DES on brain networks . . . 9 1.2.1 The brain connectome . . . 9 1.2.2 Necessity of an individual brain mapping . . . 10 1.2.3 Reliability of the functional and behavioral effects of DES . . . 11 1.2.4 DES clinical concerns . . . 12 1.3 Probing the functional networks connectivity . . . 13 1.3.1 Rationale of this work . . . 13 1.3.2 Cortical vs. subcortical DES effects: a first hypothesis . . . 13 1.3.3 Interest of electrophysiological recordings for brain mapping . . 16 1.4 Evoked potentials induced by direct electrical stimulation . . 17 1.4.1 Physiology of neuronal activity . . . 18 1.4.2 Electrical stimulation of nervous system . . . 20 1.4.3 From extracellular stimulation of an axon to brain direct
electri-cal stimulation . . . 25 1.4.4 State of the art on evoked potentials induced by direct cortical
and subcortical electrical stimulation . . . 28 1.5 Objectives . . . 35
1.1
Surgery of diffuse low-grade glioma
1.1.1
Low-grade gliomas (LGG)
Low-grade gliomas (LGG, WHO II) are slow-growing and infiltrative tumours. They fol-low three ways of evolution [Duf05]: (1) a continuous growth (about + 4 mm of diameter/ year); (2) a gradual invasion of white matter pathways ipsilateral to the tumour initially, then contralateral to the tumour via the corpus callosum and (3) an anaplastic trans-formation into high-grade gliomas. LGG systematically evolve into high-grade gliomas with a median of transformation around 7-8 years and a median of survival estimated at 10 years [WK03]. This transformation associated with the optimization of surgical techniques is the main reason for choosing the surgery. While the preventive excision of low-grade tumours has long seemed questionable, this option is now considered the most effective. The idea is to remove the tumour and the infiltrated tissue in an attempt to limit the tumour development and to delay its degeneration [DSL00]. During the period that precedes the degeneration of the tumour, and despite some minor cognitive abnormalities [TK04], the patients exhibit most of the time a normal neurological evaluation and have normal social and professional lives [WK03]. In fact, over 80% of LGG are revealed by epileptic seizures, effectively treated by antiepileptic drugs [DeA01].
The intraoperative use of DES during general or local anaesthesia has been widely recommended for the removal of slow-growing, infiltrating tumours located in eloquent areas [BR97, Duf05].
1.1.2
Awake surgery and direct electrical stimulation (DES)
During awake surgery, patients perform a number of neuropsychological tests while DES is applied to the cortical surface or to subcortical white matter pathways, in order to detect and thus preserve connectivity (especially for critical white matter pathways) (Fig. 1.1). By generating transient disturbances, DES enables the real-time detection of cortical areas and subcortical networks that are functionally essential during complex cognitive and motor tasks.
Figure 1.1: Awake surgery of LGG and functional brain mapping. 1. Awake surgery consists in removing an infiltrative tumour in an awake patient simultaneously performing neuropsychological functional tests. 2. The neurosurgeon uses DES to test areas close to the tumour and thus draws up a functional mapping of the brain. DES is applied both cortically and subcortically to detect and preserve connectivity in real-time. From the
“Lettre de l’ARC n◦11, decembre 2009 ”.
1.1.2.1 Stimulation modalities
Electrical stimulation waveforms are defined by the following characteristics: the
fre-quency F (number of pulses in one second, in Hz), the pulse-width Pw (sec.), the
inten-sity I (mA) and the total duration of stimulation d (sec.). Patterns of stimulation can be either monophasic or biphasic with alternating polarity. In biphasic stimulation, the
two pulses are separated by the inter-pulse duration ([0 − Pw] ms), adjustable according
to the stimulator properties.
Direct electrical stimulation (DES) consists in a constant-current biphasic square wave pulse delivered through a bipolar probe at frequencies of 50 – 60 Hz. Intensity is set from 1 to 6 mA (local anaesthesia), and 4 to 18 mA (general anaesthesia), with single-pulse duration between 0.3 and 1 ms. The intensity is increased by steps of 0.5 mA until stim-ulation elicits a response but without inducing seizures. DES is performed on the whole
exposed area, every 5 mm2 (as the electrode tips are spaced 5 mm apart), at least three
non-consecutive times for each site. Intensities can be increased by steps of 1 – 2 mA for subcortical stimulations [Duf04].
The duration of the effective stimulation must be defined considering the mapped function: 1 s to induce positive motor and sensitive response and up to 4 s to inhibit the cognitive ones. In the context of in vivo functional brain mapping, the understanding of the effects of DES cannot be considered apart from intra-operative evaluations. The precision of these latter is critical for understanding the effects of DES and determining
the DES parameters that can maximise an effect or a perturbation of the investigated function.
1.1.2.2 Functional assessment
Defining a stimulated area as eloquent involves an adequate individual selection of func-tional tests, according to the lesion location, the pre-operative imagery and the funcfunc-tional assessment. Sensory-motor tests are quite simple: the patient must either stay passive or perform a periodic movement. In this case, the impact of DES is determined by evaluat-ing the motion disturbances (involuntary movement, pins and needles feelevaluat-ing, etc.). Note that motor mapping can sometimes be performed under general anaesthesia. However, cognitive tasks such as calculation, language (e.g. picture naming), and visuo-spatial representation (line bisection) requires an important focus from the patient [MWD10]. Evaluation accuracy is brought by a neuropsychologist or a speech therapist who per-forms the assessment of the functional disturbance. Each cortical site is tested at least three non-consecutive times [OOLB89] to ensure reliability. If a functional disturbance is consistently induced the surgeon must then avoid the resection of the stimulated area.
As the functional mapping is performed all along the surgery (i.e. with both cortical and subcortical DES) it allows an effective monitoring of anatomo-functional gray and
white matter pathways throughout the resection [DCS+02, KLL+04]. This technique
enables functional mapping of the area near or within the tumour, so that as much non-functional, infiltrated tissue as possible can be removed while minimizing sequelae: the tumour resection is performed with regard to functional boundaries.
1.1.3
Clinical benefits of using DES in awake surgery
The value of DES for in vivo brain mapping is emphasised by the clinical observations recorded in the aftermath of wide-awake surgery. Indeed, the success of this surgical strategy depends largely on the excised tumour volume: no anaplastic transformations have been observed over a median follow-up time of 5–6 years, and postoperative MRI showed that all of the tumour has been removed [Duf05]. Given that these tumours are often widespread, large-scale resections (often around 90 cc) are frequently required [YMGD11]. Nevertheless, over 95% of all patients recover well; indeed, 3 months after surgery, none presented marked impairments on standard neurological scales [Duf05]. This point is illustrated in Figure 1.2. The good clinical outcomes observed for patients with
slow-growing tumours contrast with the "conventional" outcomes observed in the context of strokes, where most patients have permanent disabling impairments [BDD06, DBD07].
Figure 1.2: Examples of surgical resection of the tumor, without functional consequence (Karnofsky Score maintained between 90 and 100), as confirmed by neurological and neuropsychological repeated evaluations, and despite the removal of structures, which are classically considered as "critical": fronto-mesial regions, i.e. supplementary motor area
±cingulum (right or left) (Fig. 1a); insular lobe ± frontobasales and temporal structures
(right or left) ± right striatum (Fig. 1b); primary sensorimotor area (Fig. 1c), parietal lobe (Fig. 1d); primary motor area of the face (nondominant side) (Fig. 1e) or hand (Fig. 1f) Broca’s area (Fig. 1g); dominant temporal lobe left (Fig. 1h) and the corpus callosum
1.2
Understanding the effects of DES on brain
net-works
Undoubtedly, intraoperative DES fuctional mapping during awake surgery of LGG has significantly improved the resection outcome, by identifying both cortical and subcortical
structures essential for the function [DWHRZ+12]. Furthermore, DES has given us a
better understanding of the brain’s functional organisation [DSL00].
1.2.1
The brain connectome
In the long-standing localizationist organisation of the central nervous system, one given brain area corresponds to one and only one function (e.g. Wernicke’s area, involved in the comprehension or understanding of written and spoken language). Nevertheless, insights from DES functional mapping have demonstrated that this vision was in no instance re-flecting the real cerebral working.
On the contrary, brain functions are supported by vast parallel horizontally and verti-cally distributed circuits. This circuits are organised as (i) cortical epicentres likely syn-chronous connected via (ii) cortico-cortical association of white matter tracts (horizontal connections) and (iii) subcortical modulatory structures linked to the cortex (vertical connections). Thus, connectivity can be anatomically identified (Fig. 1.3):
- Cortico-cortical connectivity which anatomically links different cortical areas to-gether. It mainly consists of U-fibers and associative pathways (local short connec-tions of both sides of a sulcus, and longer intra- and inter-hemispherical connecconnec-tions respectively),
- Cortico-subcortical connectivity which consists in the projection pathway (from cor-tical areas to central grey nuclei or spinal cord).
Thanks to this anatomical connectivity, a function is not underpinned by a specific cor-tical area but by several distant areas working together via axonal connectivity. Moreover, the same hub can participate in several functions, depending on its temporary connections to other cortical areas. In other words, complex brain processes are possible only thanks to the dynamic interactions existing between subnetworks according to the task required.
By gathering cortical and axonal sites on which DES induces the same disturbances, dif-ferent complex networks have been redefined: sensorymotor, visuospatial, language and socio-cognitive systems among others (see [Duf15] for a review).
U- ibres
Association ibres
Projection ibres
Commisural ibres
Figure 1.3: White matter connectivity: associative and projection pathways
1.2.2
Necessity of an individual brain mapping
Functional imagery on healthy subjects has shown an important inter-individual anatomo-functional variability. Indeed, although the neural structures are common to all, their organization remains proper to each. This specificity is even more marked for LGG pa-tients. Indeed, the disturbances induced by inta-operative DES mapping have enabled to conclude that not only the networks interact together but can also compensate each other to a certain extent: that is the plasticity phenomenon. For example, DES performed in LGG surgery showed that cerebral functions can be redistributed to remote networks
when brain copes with slow growing lesions [THMG+14, DBD07].
Neuroplasticity is limited by the cortico-subcortical connectivity. Indeed, affecting the underlying pathways of a functional network prevents the synchronisation of the corti-cal epicentres. Identicorti-cal functional disturbances will be induced by a subcorticorti-cal lesion, independently from its anatomical localisation on the subcortical pathway. However, a cortical lesion may be counterbalanced by a redistribution of the cortical output, as long as subcortical connectivity is preserved [Duf05].
Interestingly, this phenomenon of reorganization seems to be favoured by slow-growing lesions. The astonishing ability of post-operative functional recovery could be thus ex-plained by the slow-growing property of LGG. On the contrary, fast and acute lesions, such as cerebrovascular accidents, induce permanent functional deficits or a longer recov-ery [DBD07]. Finally, the brain shows a functional post-surgical re-organisation. In case of relapse, the functional mapping established on a second LGG resection will be slightly different from the first one.
Because of these variations, it is thus mandatory to perform functional mapping with DES for each patient. Knowledge of anatomical landmarks is essential, but insufficient for an optimal resection.
1.2.3
Reliability of the functional and behavioral effects of DES
Undoubtedly, DES improves the outcomes of surgery [Duf05, SB08a, SCL+08] in terms
of maximum tumour removal and preservation of the patient’s quality of life [DGM+08,
SB08b] (for a recent meta-analysis, see [DWHRZ+12]). Furthermore, DES has given us
a better understanding of the brain’s functional organisation [DSL00]. However, do we really know how DES works in the brain?
Despite DES’s effective use in tumour resection, many aspects have not been com-pletely clarified. When DES was first used during surgery for epilepsy, it was assumed that transient disturbances were generated by applying DES to a functional (cortical) “epicenter” [OOLB89, MWD10]. This principle alone is, however, insufficient for the ef-fective performance of wide-awake surgery. Brain mapping (cortical mapping, in this case) is mainly guided by the behavioural effects obtained with DES.
However, wide-awake brain surgery does require a very detailed knowledge of cortical and subcortical neuro-anatomy in order to both (i) determine a priori functional cortical epicentres and (ii) search for subcortical pathways and fascicles linking the functional cor-tical points together before corroborating them by DES. This latter approach searches the correlation between cortical and subcortical effects of DES based on precise hypotheses about neuro-anatomical networks. It is assumed that DES "desynchronises" functional points that are structurally linked together.
In other words, to ensure consistent, reliable effects of DES and thus effectively guide the surgery, DES cannot be applied without strong a priori hypotheses and detailed knowledge of how networks are organised. The neuro-anatomical hypotheses are then confirmed using DES.
1.2.4
DES clinical concerns
As described before, the main goal of awake surgery using DES is to maximize the tu-mour resection with respect to the functional boundaries to preserve the quality of life. DES mapping relies on the surgeon’s detailed knowledge of both cortical and subcortical neuroanatomy in order to (i) determine the functional cortical epicentres a priori and (ii) search for the subcortical pathways binding these cortical outputs together before confir-mation by DES mapping.
To date, it is possible to perform LGG resection with a very good accuracy (∼ 100%) when using the standard DES technique(see section 1.1.2.1) in other words, false negatives are rarely induced by DES, which offers a good functional preservation. This is why DES is currently considered as the gold standard for brain mapping in awake surgery of LGG. However, the lack of specificity, to a low extent, is the main disadvantage of DES map-ping [MWD10]. Indeed, false positives can be induced by DES (i.e. the stimulated area is functional) whereas the resection was possible. Firstly, the stimulation could have reached an other network, essential to the function, due to the electrical conduction along axons. Secondly, the stimulated area could be functionnaly compensated by other epicentres in a close region, thanks to the plasticity mechanisms. In both cases, the resection would not have induced permanent deficits. Moreover, the intraoperative assessment of a func-tion is generally subjective (especially for cognitive tasks) and might significantly depend on the patient’s level of commitment (consciousness and cooperativeness). Finally, the parameters of ES can also have an impact on the mapping as they are important for the activation/inhibition of the neuronal elements - and thus of the network (see section 1.4.1 for details).
1.3
Probing the functional networks connectivity
1.3.1
Rationale of this work
To maximise the resection and validate the anatomical and functional connectivity, know-ing in real-time and in vivo the electrophysiological state of the activated functional net-work could be useful to understand how cortical and axonal DES net-work.
It is believed that each functional area assessed by ES is an input gate to a large-scale cortico-cortical and cortico-subcortical network rather than an isolated discrete functional site. Recording the remote effects of subcortical (axonal) ES would probe the networks recruitment and organisation.
In other words, measuring and understanding the electrophysiological effects
of DESis necessary to probe in vivo and in real-time the spatial (and temporal)
connectivity and dynamics of both short- and long-range networks.
Such information is expected to give a better knowledge of the neurophysiological mechanisms underlying DES involved at the scale of both short and long-range networks. Over time, this would enable developing operative protocol less subjective and more robust to the patient and the surgery variations, and thus, decrease the potential sequelae.
1.3.2
Cortical vs. subcortical DES effects: a first hypothesis
DES applied to white matter pathways and axons has major behavioural effects. For
instance, Thiebaut de Schotten et al. [dSUD+05] demonstrated that stimulation of the
right inferior parietal lobule or the caudal superior temporal gyrus (but not the rostral su-perior temporal gyrus) determined rightward deviations in a line bisection task. However, the strongest shifts occurred with subcortical stimulation. Fibre tracking identified the stimulated site as a portion of the superior longitudinal fasciculus. This result suggests that the subcortical effects of DES are primarily related to alteration of the communi-cation between different areas of the brain. In this case, DES might perturb a network of interconnected brain areas (rather than a single brain area) when it is applied at the cortical surface. This was confirmed by applying DES to the investigation of the connec-tome underlying language [Duf14, DMGM14].
This concept is even more evident when considering inter-hemispheric coordination (bimanual coordination, for instance). Rech et al. [RHMGD14] observed that during bimanual coordination, all patients completely stopped moving both hands during unilat-eral subcortical stimulation. These findings (i) suggest that a bilatunilat-eral corticosubcortical network connecting the premotor cortices, basal ganglia and the spinal cord is involved in the control of bimanual coordination, and (ii) demonstrate that subcortical stimulation of white matter pathways disconnects distant and remote cortical areas that are usually considered to act synergistically during bimanual coordination. Interestingly, the effects observed by Rech et al. were also specific to movement coordination.
It is often considered that DES of white matter can inhibit the corresponding cortico-cortical functional network (for a review, see [Duf15]). It would thus be possible to apply DES subcortically with a certain degree of specificity. Effects may selectively and directly affect nervous communication along white matter pathways and indirectly affect cortical areas that are connected through transiently and virtually disconnected pathways. In-formation exchange and communication within the network may thus be altered. This interpretation is explained in Figure 1.4.
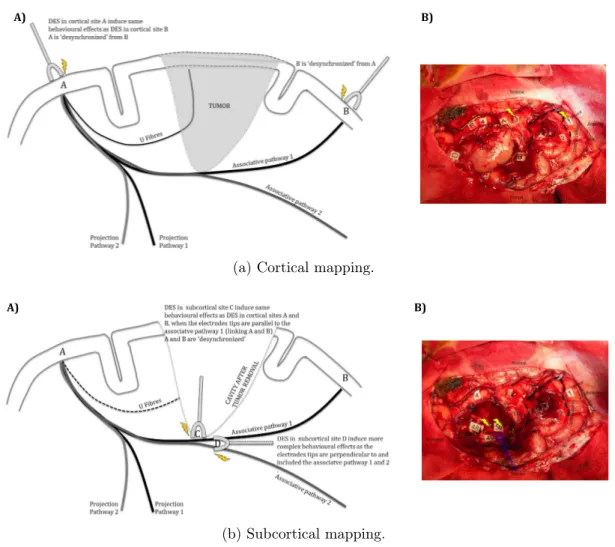
Figures 1.4a-A) and 1.4b-A) represents a schematic view of the hypothesised cortical vs. subcortical stimulation effects on functional networks. For a given specific function involving an A to B network, applying cortically DES in A “desynchronizes” A from B and impairs the function specifically. Same impairments are induced when DES is applied to the cortical site B. Both functional and behavioural effects of cortical DES are independent of the orientation of the electrode tips (an isotropic effect). Increasing the intensity yields to more complex behavioural effects. Subcortical stimulation affects the networks in a different manner. Indeed, for a given specific function involving an A to B network, application of DES to the subcortical site C (i.e. on the white matter associative pathway linking A and B) “desynchronizes” A and B and impairs the function specifically. In contrast to cortical DES, a change in the orientation of the electrode tips has different, more complex behavioural effects if associative white matter pathways are affected (an anisotropic effect). Increasing the intensity also yields to more complex behavioural effects. The same rationale can be applied when the boundaries of the cavity are near different projection pathways.
A) B)
(a) Cortical mapping.
A) B)
(b) Subcortical mapping.
Figure 1.4: Cortical vs. subcortical stimulation. Schematic behavioural effects and uses of DES during awake brain surgery (left panels) and the corresponding intra-operative views (right panels).
These hypothesis are based on the intraoperative functional mapping. Figures 1.4a-B) and 1.4b-B) represents an intraoperative view of mapping in a patient with a diffuse low-grade glioma in the parietal area. DES is set to ∼2 mA and delivered at a frequency of 60 Hz. Independently of the orientation of the electrode tips, DES (yellow lightning symbols) applied cortically to area 1 (the ventral premotor cortex) or area 3 (Wernicke’s area) induced postural (joint) disorders. It is known that these two sites are linked by the lateral part of the superior longitudinal fascicles [DMGM14]. This link is then confirmed by subcortical mapping with DES applied to a white matter pathway, also inducing postural (joint) disorders. If the current intensity is increased over ∼2 mA, more complex behavioural effects can be observed (isotropic spreading). The letters correspond to the tumour’s margins: 4 is a site for which anomia was revealed by DES, and 2 is a
somatosensorial site for the face (in the retrocentral gyrus). DES applied to area 50 (the lateral portion of the superior longitudinal fascicle) induced postural (joint) disorders, confirming the role of this pathway in linking areas 1 and 3. Electrode tips are parallel to the fascicle. When applied to areas 48 and 49 (the deeper portion of the superior longitudinal fascicle, i.e. the arcuate fascicle), DES induced phonemic paraphasia. The electrode tips are parallel to the fascicle. When electrode tips are perpendicular (blue electrodes) to the fascicles 48/49 and 50, DES induces a more complex effect, including postural (joint) disorders and phonological paraphasia. Note that this complex effect is induced without increasing the current intensity. Thus, at the subcortical level, the effects of the DES depend on the orientation of electrodes tips with respect to the fascicles (i.e. anisotropic spreading) [MP11].
1.3.3
Interest of electrophysiological recordings for brain
map-ping
In physiology, an evoked potential is defined as the modification of the electrical activ-ity of the nervous system, in response to an external stimulus. Recording the EPs give information on the working process of the stimulated pathway. To evaluate the network organisation of the human connectome, measures of connectivity can be used.
The connections between functional epicentres involved in a specific neural network can be defined by structural, functional and effective connectivity. These three approaches do not assess connectivity at the same level. Structural connectivity stands for the anatom-ical connections between pools of neurons or brain areas at the level of white matter tracts. This mapping can be performed thanks to non-invasive neuroimaging (magnetic resonance imaging (MRI) and diffusion tensor imaging (DTI)).
However, evoked potentials mapping provides a unique opportunity to track, in vivo and directly, the connectivity between both cortical and subcortical areas: i.e. how infor-mation between two connected sites A and B flows from A to B and the other way round. Thus, DES combined with intra-operative electrophysiological recordings can be used to probe in vivo and in real-time the spatiotemporal connectivity and dynamics of both short- and long-range networks. In this vein and in the context of awake brain surgery, it is of a certain interest to measure EP:
- Cortically, when cortical DES is applied close to the recording point. This would highlight the local effects of DES. If the stimulated site is supposed functional, it would also assess the delineation of the cortical area corresponding to the function. - Subcortically and cortically when DES is applied on the white matter pathways re-vealed by tumour resection, or on its assumed cortical output. These measurements would shed new light on the different stages of the propagation of DES within neural networks and on the axonal connectivity between functional cortical regions. - At remote distances from the DES site, such as at other distant cortical areas or even
external brain activity. In this cases, the recorded response would not be the direct EPs but rather an integrated response, involving a wider population of neurons. To date, only two electrophysiological recording techniques enable the recording of local and remote EPs: electrocorticography (ECoG, invasive direct measure of cortical areas) and electroencephalography (EEG, non-invasive measurement from the skull). These recording techniques of brain activity are detailed further down the document. In theory, investigating the recorded EPs features can also give information on the induced physio-logical signal propagation. In particular, by correlating shapes, latencies and amplitudes of the EPs to the neuronal elements type (e.g. axonal fibre, soma) and their conduction velocity (e.g. myelinated vs. unmyelinated), it is possible to assume which types of fibre are activated.
1.4
Evoked potentials induced by direct electrical
stim-ulation
Potentials evoked by DES consists in the electrophysiological response of a bunch of neuronal elements. Their diversity and complex structuration make understanding the effects of brain ES challenging. Indeed, it is unclear in many cases what neuronal elements are activated by the stimulation [Ran75]. Knowledge from biophysic, especially given by ES of the peripheral nervous system, can give leads on the understanding of activated neural structures.
1.4.1
Physiology of neuronal activity
1.4.1.1 The action potential
Most of the neurons in the nervous system have the same main structures: a cell body (soma), an axon, potentially wrapped by a myelin sheath, and dendrites. Once a nat-ural action potential (AP) has been initiated in the soma, it flows without attenuation along the membrane of the axon to the next neural element, at the synapse junction point. The vast majority of synapses in the mammalian nervous system are classical axo-dendritic synapses (axon synapses upon a dendrite). The junction between two neurons occurs at the synaptic cleft. The arrival of an AP at the level of the pre-synaptic element induces the release of a neurotransmitter at this junction. Depending on the nature of this molecule, the second neuron can be either hyperpolarized or depolarized. The resulting induced post-synaptic AP will be excitatory (EPSP) or inhibitory (IPSP) respectively. As the soma is reached by several synapses, the post-synaptic excitation is determined by the summation of all EPSPs and IPSPs.
If EPSPs are more important, synaptic currents produce brief changes in the distri-bution of charge along the somatic membrane, which elicits another AP up to the axon.
Voltage-gated sodium (Na+) and potassium (K+) ionic channels are sensitive to
fluctu-ations of the axon membrane potential. The APs are carried along the axon by the sequential opening and closing of these gated channels. The resting membrane potential (RMP) typically varies between -60 mV and -100 mV.
In response to the synaptic current, Na+ ions enter the cell so that the inside becomes
less negative [HH52]. The axon’s membrane potential increases as a function of the number of open channels (depolarisation). An axonal AP is triggered when the potential reaches the activation threshold of the cell, and the membrane voltage rises by up to around 30 mV. Once this maximum voltage is reached, the axon’s membrane potential drops back to the
RMP as the Na+ channels close and the K+ channels open (repolarisation). However,the
significant release of K+ ions hyper-polarises the cell, leading to a membrane potential
below the RMP. Lastly, a few K+ ions diffuse out of the cell through potassium leakage
channels, bringing the cell back to its RMP. Another axonal AP cannot be generated until the membrane potential has returned to the activation threshold; this period is referred to as the absolute refractory period. However, once this period has ended, the initiation
of a second AP is inhibited but not impossible (during the relative refractory period). These mechanisms are illustrated in Figure 1.5.
ARP RRP Depolarization Repolarization Hyperpolarization Rest potential 0 1 2 3 4 5 6 7 8 t (ms) Vm (mV) Activation threshold - 60 mV 0 mV
Figure 1.5: A natural AP: transmembrane axon potential (Vm) and ion channels
[VRH+16].
The conduction velocity of an AP along an axon is influenced by both the diameter of the axon and its resistance to current leakage. Because the axon membrane is not a perfect insulator, some current leaks out of the axon. Some axons have an insulating myelin sheath that prevents current leakage. Conduction velocities range from 0.5 to 10
ms−1in unmyelinated axons but can be as high as 150 ms−1in myelinated axons [PAF01]).
1.4.1.2 Brain electrical activity
When measuring brain electrical activity, the potential recorded at a given location (with respect to a reference potential) consists in the superimposition of all electrical activities of neuronal cells within a volume of brain tissue. The extracellular potential is thus a combination of all potentials variations from dendrites, soma, axons, etc. The character-istics of the recorded signals (brain activity) depend on the properties of these electrical sources. The amount and specificity of the recorded information depend on the distance between the recording point and the electrical point. The further away from the source, the less specific the signal is. Indeed, the electrical potential amplitude decreases with
the inverse of the recording-emitting distance and more neuronal elements contributions are recorded when this distance increases.
1.4.2
Electrical stimulation of nervous system
1.4.2.1 Electrical stimulation technical principles
Electrical stimulation (charge-injection) is always performed between two points: the working electrode and the counter electrode. The delivered current depends on the dif-ference between the two electrodes own potentials. The charge-injection in the tissue can be controlled using two different methods: the voltage-controlled stimulation and current-controlled stimulation. For brain ES, the latter one is commonly used. Indeed, as explained hereinafter, the stimulation intensity is the crucial parameter for activat-ing neurons. In case of voltage-controlled ES, the delivered intensity cannot be directly monitored, as it depends on the stimulated environment (of unknown resistivity, Ohm law).
Stimulation profiles Current can be delivered in two ways. A monophasic stimulation
(monophasic pulse) consists in a current that is passed from the working electrode to the
counter electrode for a given period a time (pulse duration or pulse width Pw). This pulse
can be followed by second pulse with a reversed direction: this two-phase stimulation is then called biphasic.
The amount of charge injected by one pulse is given by the product of its current inten-sity by its pulse width. In the biphasic case, the stimulation is balanced when the charges delivered by each pulses are equals. Balancing the amount of charges aims at avoiding electrode and tissue damages (see [MBJ05] for details on possible damages in ES).
In monophasic stimulation, the pulse shape is designed to elicit activation of the stim-ulated element (the active phase). In biphasic stimulation, one of the pulses is the active phase, while the other pulse balance the charges (reversal phase). Usually, the active phase consists in a cathodic pulse (negative), where the working electrode is driven nega-tive with respect to its pre-pulse potential and to the counter electrode. The passive phase stands for an anodic (positive) pulse, where the working electrode is driven positive. In some cases, pulses can be separated by a specific interval, the inter-pulse, and the anodic
pulse can induce activation (not discussed here, [MBJ05]).
Stimulations are characterised by some key parameters (Fig. 1.6): the frequency F ,
the pulse width Pw, the current intensity I, the inter-pulse duration dip and the stimulus
train duration (duration of the stimulation phase).
Monophasic s mula on A) Biphasic s mula on B) Current + Time 0 Charge balanced IC=IA Charge balanced with interpulse IC=IA Charge imbalanced with interpulse IC<IA IC IA 0 0 0 Cathodic current IC T = 1/F Anodic current IA 0 Train duration PW dIP Cathodic current IC PW T = 1/F 0 Train duration
Figure 1.6: Stimulation types and parameters
Multipolar stimulation Different electrode configurations can be used to perform ES.
Even if two electrodes are always necessary to deliver a current, the following N-polar configurations are defined, according to the number N of active (delivering the active pulse) electrodes (poles) involved in the stimulation (see Figure 1.7):
- Unipolar or monopolar stimulation: the working electrode is set on the targeted tissue to stimulate while the counter electrode, named the reference electrode, is placed at a distant site,
- Bipolar stimulation: both working and counter electrodes are a few-centimetres apart and located on the neuronal element. In biphasic stimulation, anodic and cathodic electrodes are reversed between the first and second phase (pulse) of stim-ulation,
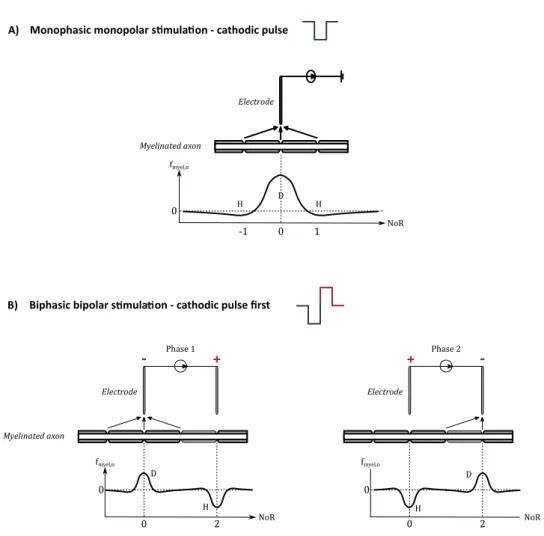
- N-polar configuration: the bipolar configuration can be extended to N electrodes, with several anodic and cathodic electrodes (at least one of each, e.g. one cathode, two anodes). Myelinated axon Electrode fmyel,n NoR 0 0 1 -1 Phase 1 + -Myelinated axon Electrode fmyel,n NoR 0 0 2 Phase 2 + -Electrode fmyel,n NoR 0 0 2
Monophasic monopolar s mula on - cathodic pulse A)
Biphasic bipolar s mula on - cathodic pulse first B) D H D H D H H
Figure 1.7: Stimulation configuration and the resulting activating function fmyel,n at the
n node of Ranver (NoR). D: depolarisation – H: hyperpolarisation.
1.4.2.2 Activation of neuronal elements by electrical stimulation
The effects of electrical stimulation of neuronal elements have been well characterized for ES of neuronal fibers (axon), especially when myelinated. Even if the brain is a
complex system of diverse neuronal elements, the knowledge from axonal ES principles can give insights on direct brain stimulation effects: how could an electrical current stimulus activate a neuronal element? In the following part, the general working principle of ES configurations and the impact of ES parameters are succinctly described. For a detailed
biophysic see Vincent et al. [VRH+16].
The activating function To understand and predict the activation of a nerve fibre
(depolarisation or hyperpolarisation by an electrical pulse), Warman et al. [WGD92] and Rattay [Rat99] have defined the concept of activating function. The activating function
fnhas been described for myelinated axons and represents spatially the axon’s membrane
state of polarisation (Fig. 1.7): depolarisation when fn > 0 (cathodic pulse),
hyperpolar-isation when fn < 0 (anodic pulse).
The anodal surround and bipolar stimulation As explained above, cathodic
monopo-lar stimulation leads to membrane depomonopo-larisation under the electrode tip and hyperpomonopo-lar- hyperpolar-isation on either side. During monopolar stimulation, APs are generated on each side of the stimulation point and propagate away in opposite directions. However, an AP gener-ated at a depolarised site on the stimulgener-ated fibre can only cross the hyperpolarised area if the latter is not too large. This effect (known as the “anodal surround”) prevents the generation of APs in a zone close to the electrode [Dur99]. Bipolar stimulation is used to force the current to propagate in a single direction. The fibre is then subjected to both cathodic and anodic stimulations. One electrode tip (the cathode) delivers a negative current and the other tip (the anode) delivers a positive one. By increasing the width of hyperpolarisation, i.e. the current amplitude, the AP generated by the cathode (and which goes towards the anode) can be blocked [Ran75].
Moreover, in the case of bipolar stimulation, the activating function decreases more rapidly in function of the distance from the stimulation point. Thus, bipolar stimulation is more focal than monopolar stimulation.
Determination of ES parameters for optimized and safe stimulation When
de-signing a stimulation protocol, both pulse intensity and duration must be chosen carefully. First of all, to be effective, the electrical stimulus has to be long enough and intense enough to induce a change in the membrane potential that exceeds the natural excitation


![Figure 1.9: Strenght-duration curves for the studies listed in Table 1.2. Adapted from [VRH + 16]](https://thumb-eu.123doks.com/thumbv2/123doknet/7716100.247962/45.892.150.750.324.762/figure-strenght-duration-curves-studies-listed-table-adapted.webp)