Innovation and Establishments' Productivity in Canada: Results from the 2005 Survey of Innovation
45
0
0
Texte intégral
(2) Pour nous joindre Téléphone : 514.987-4018 Télécopieur : 514.987-7726 Adresse électronique : cirst@uqam.ca. Adresse postale CIRST Université du Québec à Montréal C.P. 8888, Succ. Centre-ville Montréal (Québec) H3C 3P8. Adresse civique CIRST Pavillon Thérèse-Casgrain W-3042 - 3e étage Université du Québec à Montréal 455, boul. René-Lévesque est Montréal, Québec. Conception graphique : Sengsoury Chanthavimone et Martine Foisy ISBN 978-2-923333-43-4 Dépôt légal - Bibliothèque et Archives nationale du Québec, 2009 Dépôt légal - Bibliothèque et Archives Canada, 2009.
(3) Note de recherche 2009-02. Innovation and Establishments' Productivity in Canada: Results from the 2005 Survey of Innovation Pierre Therrien* et Petr Hanel**. Pierre Therrien is Chief, Science and Innovation Data Analysis at Industry Canada. His primary research interest includes: impact assessment of science and technology activities; S&T international benchmarking; and firm's innovation behavior and rewards. He is working actively with the Organization of Economic Cooperation and Development (OECD) on projects related to innovative firms and productivity. Petr Hanel is Professor of Economics at the Université de Sherbrooke and member of the Centre interuniversitaire de recherche sur la science et la technologie (CIRST). His previous work includes two books and numerous articles and studies on economic aspects of technological change and innovation, He is the co-author with John Baldwin of the book Innovation and Knowledge Creation in an Open Economy-Canadian Industry and International Implications, Cambridge University Press, second, paperback edition published in 2007..
(4) Pierre Therrien and Petr Hanel. Abstract Research teams from 18 OECD countries used the methodology introduced by Crepon-Dugay and Mairesse (CDM) to analyze the impact of innovation on labour productivity using firm data from national innovation and administrative surveys. To ensure international comparability, the OECD ‘core’ CDM model did not include variables for which data were missing in some countries. In spite of this shortcoming, the results are broadly in line with theoretical hypotheses and previous studies and show a surprising degree of similarity between countries. This paper builds on the Canadian application of the ‘core’ model used for the OECD project. It uses to the full extent all information available on manufacturing establishments from the Canadian Survey of innovation 2005 linked with the Annual Survey of Manufactures and Logging (ASML). The estimated econometric model controls for selection bias, simultaneity, size of firm and industry effects. The main findings suggest that (1) export outside of the US market, size of the firm and use of direct or indirect government support are factors increasing the probability to innovate and having positive innovation sales. (2) Exports (both to the US and outside of the US market), cooperation with other firms and organizations, and high share of the firms’ revenue coming from sales to its most important client are all factors correlated with higher innovation expenditures per employees. Moreover, firms with a higher market share at the beginning of the period are spending more on innovation by the end of the period. (3) Firms with higher innovation expenditures per employee generate more innovation sales per employee. Other factors increasing innovation sales are human and physical capital and introduction of process innovations. (4) Finally, the firms generating more innovation sales per employees achieve higher labour productivity, even when the size of firms, the intensity of human and physical capital and labour productivity at the beginning are taken into account. The results add valuable further information to and are in line with the simpler model applied to 18 other OECD countries. The paper concludes with discussion of policy implications.. Acknowledgements We thank Frances Anderson, Susan Schaan and all the team at SIEID (Statistics Canada) for their patient and efficient cooperation and our assistant Jean-Michel Goulet from Université de Sherbrooke for his assistance with computer work. Views expressed in this paper are our own and do not necessarily reflect those of Industry Canada, the Government Canada or the Université de Sherbrooke.. CIRST – Note de recherche 2009-02. page 1 .
(5) Innovation and Establishments' Productivity in Canada: Results from the 2005 Survey of Innovation. Contents. 1. Introduction ................................................................................................................................. 3 2. Overview of the literature ............................................................................................................. 5 2.1 Background and CDM model ............................................................................................................... 5 2.2 Variants of the CDM model ................................................................................................................. 6 2.3 The OECD variant of the CDM model to benchmark countries ............................................................. 8 . 3. The extended Canadian model .................................................................................................... 11 3.1 The model ......................................................................................................................................... 11 3.2 The data ............................................................................................................................................ 16 3.3 Comparison of innovating and non‐innovating firms ......................................................................... 18 3.4 Interpretation of the estimated model .............................................................................................. 19 3.4.1 Selection equation ‐ Probability to be a strict innovator (product innovator with positive innovation expenditures and innovation sales) ............................................................................................................................. 20 3.4.2 Innovation input equation .................................................................................................................................. 21 3.4.3 Innovation output equation ................................................................................................................................ 22 3.4.4 Productivity equation .......................................................................................................................................... 23 3.4.5 Overview of estimation results for SME and large firms ..................................................................................... 25 . 4. Conclusions and Policy Implications ............................................................................................ 25 Table 1 ........................................................................................................................................... 30 Table 2 ........................................................................................................................................... 31 Table 3 ........................................................................................................................................... 32 Reference List ................................................................................................................................. 34 Appendix 1 ..................................................................................................................................... 37 Results from the OECD model (results from 18 countries) ....................................................................... 37 . CIRST – Note de recherche 2009-02. page 2 .
(6) Pierre Therrien and Petr Hanel. 1. Introduction The standard of living and the quality of life in a country is closely related to its productivity. Improving labour productivity not only enables increased wages but also improves the overall economic welfare of the wage earners and their families. Faster productivity growth is also the best guarantor of future availability and improvement of public services such as the health care, education, and environmental initiatives, the top priorities of Canadians.1 The recent lacklustre productivity performance of the Canadian business sector has become a source of serious concern not only to business people and economists, but also to the government (Canada, 2007). It also stands out in international comparison. “Canada often stands out as one of the best in the class, but there are areas where it can do even better. Adjustment is needed because at the end of the day Canada faces the same challenges as most OECD countries, namely raising productivity growth and keeping fiscal and social policies on a sustainable path as the population ages.” And “[…. The] living standards in Canada measured in GDP per capita terms still remain about one fifth below US levels, even though in terms of subjective happiness measures Canadians do, if anything, consider themselves slightly better off than their neighbours to the South. The living standards gap stems from lower Canadian productivity and the productivity gap has widened over the past few years.” (Cotis, 2006).. Economists of various schools of thought are generally in agreement about most, if not all, elements of an agenda that would help to improve Canadian productivity. In his “Economist’s manifesto for curing ailing Canadian productivity” Don Drummond (2006) enumerates and discusses a series of obstacles to productivity growth and measures needed for their removal. He denounces popular myths that economists seem unable to dispel, misconceptions such as the notion that increases in productivity are at the expense of employment. In fact the opposite is true, strong growth in productivity is associated not only with high wages but also with low unemployment, as demonstrated in the U.S. which leads in productivity growth and low unemployment.. 1. For a more detailed reading of the productivity and innovation issue in the Canadian context, see Hanel (2008).. CIRST – Note de recherche 2009-02. page 3 .
(7) Innovation and Establishments' Productivity in Canada: Results from the 2005 Survey of Innovation. Innovation is one of the principal sources of productivity growth and is an area where Canadian industry lags behind its competitors according to the European Innovation Scoreboard (EIS, 2008).2 To better understand what is hidden behind these aggregate statistics, it is necessary to examine the innovation and the productivity issues at the firm level. After all, it is there that labour and capital – the principal factors of production- are put to work more or less efficiently. By introducing new and improved products and production processes, innovating firms expand existing and create new markets, as well as improve the efficiency of their production and marketing activities i.e. improve their productivity. The exploratory analysis of micro data using innovation surveys focused first on the innovation process itself, its characteristics and the conditions that encourage it as well as impediments.3 More recently, to satisfy the concerns of policy makers, the attention of researchers has been shifting to the link between innovation and firm performance. Several OECD countries, including Canada, joined research efforts in order to reach a better understanding of the process from the decision to innovate up to the effect of innovation on productivity and other performance indicators. This paper builds on the Canadian application of the model used for the OECD project. Even though it follows the same methodology as the OECD model, it uses to the full extent all information available on manufacturing establishments from the Canadian Survey of innovation 2005 (linked with the Annual Survey of Manufactures and Logging (ASML). The extended Canadian model tests and refines relationships found in the OECD project and focuses on the policy implications of the Canadian results.. 2. Note that Canada score is based mostly on R&D related variables as innovation survey-related factors were not taken into account. The authors of EIS acknowledge range of actual available data vary significantly by countries, with Canada showing poor availability of data. 3 OECD in collaboration with EUROSTAT launched in the early 90s a concerted effort to collect information on the whole innovation process at the firm level (CIS in Europe, Innovation Surveys in Australia, Canada, etc). Availability of data on innovation spurred new research aimed at understanding the innovation process, its sources, results and effects. Examples of such studies could be find in Kleinknecht (1987 and 1989) or more specifically for Canadian studies in Baldwin and Hanel (2003) and Gault, 2003).. CIRST – Note de recherche 2009-02. page 4 .
(8) Pierre Therrien and Petr Hanel. This report presents in Section 1 a literature review dealing with the issue of innovation and productivity at the firm-level, including a summary of the main results of the OECD project with particular emphasis on Canadian results. The next section presents in more detail the proposed refinement of the econometric model, while Section 3 analyzes the results from the extended Canadian model. Finally, Section 4 concludes by providing policy implications of the results and by proposing alternatives for future research avenues.. 2. Overview of the literature 2.1 Background and CDM model Initially surveys could not provide comprehensive information on the whole innovation process, so the exploratory analysis of micro data focused only on the relationship between R&D - often the most important innovation input - and firm productivity. However, as Mairesse and Sassenou (1991) who surveyed these studies noted, the methodological differences, in addition to data heterogeneity and other imperfections, made it quite challenging to arrive at satisfactory interpretations and conclusions. Introduction of innovation surveys in most industrial OECD countries4 in the early nineties provided data that enabled researchers to statistically document the multiple sources of innovation, the variety of types of innovation and their relationship with the expected and achieved impact of innovation results on the performance of innovating firms. One of the conclusions emerging from these studies suggested that instead of treating them separately, as had been customary in the literature, the effects of innovation activity on the performance of the firm can be modeled as a series of relationships that link the investment in knowledge to productivity growth. Crepon, Duguet and Mairesse (1998) (CDM) inspired by an earlier work of Griliches and Pakes (1984) integrated these relationships in a single system of three recursive equations. 1. The first stage captures firm’s decisions regarding research activities, i.e. whether to engage in R&D and if yes, then the resources allocated to this purpose. The Heckman selection equation. 4. The notable and unfortunate exceptions are the U.S and Japan, the two countries whose statistical agencies have not yet conducted nationwide innovation surveys. However, the U.S. academic researchers produced two very influential surveybased studies (Levin, Klevorick, Nelson and Winter, 1987 and Cohen, Nelson and Walsh 2000) in many ways laid the groundwork for innovation surveys.. CIRST – Note de recherche 2009-02. page 5 .
(9) Innovation and Establishments' Productivity in Canada: Results from the 2005 Survey of Innovation. estimates the probability that the firm performs R&D activities followed by the intensity of these activities. 2. The second stage estimates the knowledge production function linking the proxy for innovation (patents) to R&D and other variables. In a variant of the knowledge production function, the innovation outcome is measured by the percentage of innovations in firm’s total sales. 3. The third stage of the model estimates the productivity equation (augmented Cobb-Douglas production function) that includes innovation output –either by the expected number of patents per employee or by innovative sales– and other determinants of productivity. The estimating model uses appropriate methods to deal with selection bias, the endogenous nature of innovation and R&D and the statistical properties of the underlying data. The results show, for French manufacturing firms, a clear link between the innovation input intensity (R&D capital intensity); innovation output (patents or innovation sales); and firms' productivity: “The probability of engaging R&D for a firm increases with its size (number of employees), its market share and diversification, and with the demand pull and technology push indicators. The research effort (R&D capital intensity) of a firm engaged in research increases with the same variables, except for size (its research capital being strictly proportional to size). The firm innovation output, as measured by patents numbers or innovative sales, rises with its research effort and with the demand pull and technology indicators, either directly or indirectly through their effects on research. Finally, firm productivity correlates positively with a higher innovation output, even when controlling for the skill composition of labour as well as for physical capital intensity” (Crepon, Duguet and Mairesse (1998).. 2.2 Variants of the CDM model The CDM model has inspired several similar studies; all based on the harmonized innovation survey data collected according to common guidelines provided by the Oslo manual. Among interesting variants of the CDM framework is the comparison of the innovation-labour productivity nexus for France, Germany, Spain and UK by Griffith et al. (2006), the contribution of innovation to multifactor productivity growth in the Netherland by Van Leeuwen and Klomp, (2006) and innovation and labour productivity in Swedish manufacturing and services firms by Lööf and Heshmati (2006). The Swedish study is of particular interest. It used the CDM model as the theoretical framework but departed from that model by using instrumental variable analysis instead of the asymptotic least squares method used by CDM. As well, the study made some sensitivity analysis by using different variables and by estimating models for productivity growth (instead of productivity level). Results. CIRST – Note de recherche 2009-02. page 6 .
(10) Pierre Therrien and Petr Hanel. show that various productivity measures such as sales per employee, value added per employee, growth of value added per employee, growth of sales, growth of profit per employee, growth of employment and to a lesser degree, sales margins are all positively linked to innovation; of course, the estimated elasticity coefficients vary. In contrast to earlier studies that considered the R&D as the sole innovation expenditure, the innovation input variable in this study includes expenditures on all aspects of innovation. The elasticity of labour productivity to innovation sales in manufacturing and in services is rather similar, respectively 0.12 and 0.09. A debatable feature of the study is inclusion of various obstacles to innovation in the vector of exogenous variables. By definition, in the case of innovating firms, obstacles to innovation are not independent from innovation thus potentially resulting in a simultaneity bias. Another variant of the CDM model has been introduced by Griffith et al. (2006) hereafter GHPM, to analyze the 1998-2000 data from innovation surveys in the UK, Germany, Spain and France. The model captures well the relationships between the variables of the three stages. They express common features of innovation activity shared by the four countries. In contrast to the original CDM, GHPM estimates separate innovation functions for process and product innovations. The product innovation has a positive effect on labour productivity (measured as sales per employee) in three out of four countries (Germany being the exception). The process innovation appears to have a positive effect only in the case of French firms. Another original feature of this application of the CDM model is the inclusion of local, national and EU funding of R&D in the Heckman section of the model. These programs contribute to the decision to engage in R&D continuously. However, only the national funding appears to affect the R&D intensity.5 Finally, Van Leeuwen and Klomp, (2006) examines the impact of innovation on multifactor productivity (MFP) growth using Dutch data. Among other features, it models the feedback from firm’s sales back to innovation activity. The authors argue that their revenue per employee-based model offers a better framework for assessing the links between the results of the innovation process and the firm performance because the results of innovation are measured in revenue terms rather than. 5. In the case of France, national funding appears with a negative coefficient while the EU comes with a positive one.. CIRST – Note de recherche 2009-02. page 7 .
(11) Innovation and Establishments' Productivity in Canada: Results from the 2005 Survey of Innovation. in value added terms. The study also finds that the estimation of return on innovation investment benefits from the inclusion of more information on the technological environment of the firm. 2.3 The OECD variant of the CDM model to benchmark countries Using the Lööf and Heshmati (2006) variant of the CDM approach, teams of researchers from 18 OECD countries, including Canada, estimated a simplified common model.6 The OECD variant used the four equations and three steps framework, as in most CDM models, but the requirement of estimating a common model for all participating countries limited the choice of available variables. The OECD model used the standard dependant variables related to innovation input (innovation expenditures per employee); innovation output (innovation sale per employee) and labour productivity (measured by sales per employee). However, owing to unavailable data in some countries, it was impossible to include in the productivity equation the usual factors of production (such as intermediate inputs, human and physical capital) or alternatively to use a better dependant variable (value added per employee). Nonetheless, the main independent variables in the four equations (such as size, export, cooperation, government support for innovation, etc) were included in the model. The main result of the OECD initiative is that innovative firms in all participating countries seem to behave in similar ways. Selling on the foreign market, large size and being part of a group are characteristics that increase the probability that a plant or firm is innovating. Those characteristics, in addition to cooperating on innovation and receiving public financial support, determine the intensity of investment in innovation. Sales of innovative products contribute significantly to labour productivity. Selection bias and endogeneity issues between innovation sale and productivity were taken into account. Main elasticities –between innovation expenditures and innovation sales as well as between innovation sales and labour productivity –are usually positive and within the same broad range. Looking more specifically at each stage and comparing Canada to other countries, (see Appendix 1 for the specification of the model and summary tables) the following patterns emerge:. 6. The results of this unique joint research initiative were coordinated in a series of workshops by the WPIA-NESTI (OECD) with econometric programming and coordination by Chiara Criscuolo from the London School of Economics. A short summary of results has been published in Chapter 5 from the OECD, Science, Technology and Industry Outlook 2008 and detailed analysis can be found in (OECD, 2009, Chapter 3). See Appendix 1 for summary results for the 18 countries and Therrien-Hanel 2008 for more information on preliminary results from Canada.. CIRST – Note de recherche 2009-02. page 8 .
(12) Pierre Therrien and Petr Hanel. First stage - decision to innovate and investment in innovation -. In Canada as in the other countries the decision to innovate is positively correlated with exporting, the size of employment and the plant being part of a larger group. In addition to exporting and group membership, the intensity of investment in innovation is also enhanced by cooperation in innovation activities with other firms and research institutions and by government financial support for innovation. In Canada, as in most other countries, the largest effect on investment in innovation – measured by innovation expenditures per employee– comes from sales to foreign markets (regression coefficient of 0.45), followed by cooperating (0.17) and being part of a larger enterprise (0.15). The selection bias exists and has been corrected by Heckman’s procedure with regards to the Canadian data as well as the data for most other countries by including the Mills ratio in innovation output and productivity equations.. Second stage - knowledge production function . The log of innovative sales per employee is positively correlated with innovation expenditures per employee in all countries, meaning that firms spending more on innovation activities per employees are the ones that have more innovative sales per employees. The estimated elasticity for Canada is in the middle range (0.37)7. In Canada, as in some other countries (Finland, France, UK for instance), firms that introduced process innovations in addition to product innovations have higher innovative sales per employee. The size of firm does not have any consistent effect on the innovation sales.. Third stage equation – contribution of innovation to labour productivity . Labour productivity is positively correlated with innovation sales. Firms with high innovation sales per employee have higher productivity level than other firms. The estimated elasticity for all countries is in the range of 0.23 to 0.68, with Canada’s coefficient (0.44) in the middle of the range. Larger firms have somewhat higher productivity, but the effect of size is modest. Being part. 7. With the exception of Austria, the elasticity of innovation sales to innovation cost is statistically significant at the 1% level for all countries. The coefficients range from 0.14 for Denmark to 0.52 for New Zeeland. Note that the positive and statistically significant coefficients hold only when the endogeneity between innovation expenditures and innovation sales is rejected. The endogeneity issue when using Canadian data is addressed in the next sections.. CIRST – Note de recherche 2009-02. page 9 .
(13) Innovation and Establishments' Productivity in Canada: Results from the 2005 Survey of Innovation. of a group is also associated with higher productivity. More surprising is the negative, often statistically significant, coefficient of process innovation. Process innovation appears to have a positive effect on productivity only indirectly through its positive correlation with innovation sales in the 2nd stage equation. Summarizing Canada results, the OECD model suggests that exporting firms are more likely to introduce new and improved products and they invest more in innovation than non-exporters. Firms that cooperate in innovation and those that receive financial support from government spend more on innovation per employee than others, but the effect of these two variables is notably smaller and less significant in Canada than in other countries. The innovation sales equation shows that higher innovation expenditures and cooperation with private partners is linked to better product innovation output performance, which in turn is linked with higher labour productivity. Larger firms are significantly more likely to innovate and they achieve higher productivity than their smaller counterparts. In Canada as in most other countries, introducing process innovations enhances productivity only indirectly through its positive impact on product innovation but the direct effect on productivity appears to be small and negative. Overall, when statistically significant, the estimated regression coefficients are remarkably similar for all countries not only for the productivity equation but for the elasticity of innovation sales to innovation expenditures, investment in innovation and decision to innovate as well. Thus in spite of the data constraints and imperfections imposed for the sake of international comparability, the estimated model yields broadly comparable results for the OECD countries included in the sample. Results from the OECD model must nonetheless be interpreted with caution because important variables have been left out or have been simplified for the sake of enabling international comparison. The obvious examples are the use of a sub-optimal productivity equation (value added or total factor productivity variables would have been better candidates for productivity measures than total turnover per employee; omission of important production factors such as human and physical capital measures), and the use of binary variables when quantitative ones were available for some countries (ex. percentage of sales exported). In addition, the lack of robustness of elasticities (between innovation output and innovation input, and between productivity and innovation output) calls for further analysis and correction of the potential biases that might be caused by endogeneity between innovation-related. CIRST – Note de recherche 2009-02. page 10 .
(14) Pierre Therrien and Petr Hanel. variables. Finally, further work is needed before accepting the puzzling negative coefficients of process innovation in the productivity equation. In the following sections, the model is refined in order to assess whether the results obtained with the OECD model hold when important relationships are added and better suited variables are used.. 3. The extended Canadian model In using Canadian data not constrained by the imperatives of international comparability, we are able to introduce a more complete model, including all relevant available variables, to get more reliable results. The modifications of the core OECD model include: o A better measure of productivity (value added per employee instead of revenue per employee); o Human and physical capital variables in the productivity equation; o Whenever possible, replacement of binary variables with quantitative variables; o Addition of other relevant control variables such as outsourcing R&D; o In-depth econometric tests to assess robustness of core results on the links between innovation input, innovation output and firms' productivity (by testing the potential "endogeneity" problems between these variables that would bias results.); o Finally, testing different variables and different model to assess the counter-intuitive preliminary result of the negative coefficient of process innovation on firm's productivity. 3.1 The model The extended Canadian model includes additional and refined relationships at each stage of the analysis, and a better modeling of the productivity equation. The specification details of each equation are presented below: (A0) innov_strict=. β00 + ∑n βn0 Xn0 +ε0. (A1) log(inn_exp/emp)= β01 + ∑m βm1 Xm1 +ε1. if innov_strict=1. (A2) log(inn_sale/emp)= β02 + β2 Log(Inn_exp/emp)+ βMRMR + ∑l βl2 Xl2 +ε2. if innov_strict=1. CIRST – Note de recherche 2009-02. page 11 .
(15) Innovation and Establishments' Productivity in Canada: Results from the 2005 Survey of Innovation. β03 + β3 Log (inn_sale/emp)+ βMRMR + ∑j βj3 Xj3 +ε3. (A3) log(VA/emp)=. if innov_strict=1. Specification of equations EQ. Dependent variables. Description. (A0). 1 if inn_exp>0 and inn_sale>0; otherwise =0;. innov_strict. =. (A1) LRTOTPE log(inn_exp/emp)* = log (total innovation expenditures per employee), (A2) LISPElog(inn_sale/emp)* (A3). =. log(innovation sales per employee);. LVAPE log(value added/emp) = log (total revenue per employee). *Potentially endogenous variables Explanatory variables Xn0 = employment in log (LEMP); percentage of export to U.S. (EXPORT-US); percentage of export to other foreign markets (EXPORT_OT) ; share of total revenue from other plants in the group (INTRA_SALE); government support by grant (GRANT) or by R&D tax credit (GTXC) and finally important success factors such as seeking new markets (FAC_NEW); satisfying existing customers (FAC_EXIST); developing custom designed products (FAC_CUSTOM); plant's market share at beginning of period (MKTS02) and industry dummy variables (SIC_stan). Xl1 = employment in log (LEMP); log of employment at the beginning of period (2002); percentage of export to U.S. (EXPORT-US); percentage of export to other foreign markets (EXPORT_OT); share of total revenue from sales to the most important customer or client which is not part of your firm (MIC); cooperation on innovation (COOP); government support by grant (GRANT) or by R&D tax credit (GTXC);. plant's market share at beginning of period (MKTS02); RD. contracted-out (RD_OUT); industry dummy variables (SIC_stan). Xm2= employment in log (LEMP); the plant is part of a group, (GP); innovation expenditures per employee in log (LRTOTPE*); introduction of a process innovation (PROCESS); sources of information on innovation from public institutions (S_PUB), from market sources (S_MARKET), or in-house (S_INTRA); human capital (HC); physical capital per employee in log (LGIPE); Mills ratio (MR) and industry dummy variables (SIC_stan); Xj3 = employment in log (LEMP); the plant is part of a group, (GP ); log of innovation sales per employee (LISPE*); introduction of a process innovation (PROCESS); Mills ratio (MR); human. CIRST – Note de recherche 2009-02. page 12 .
(16) Pierre Therrien and Petr Hanel. capital (HC); physical capital per employee in log (LGIPE); labour productivity at the beginning of the period (LGVAPELAG )and industry dummy variables (SIC_stan) . ___________________________ Instruments for innovation output, LISPE in the A2-A3 system of equation, are: Z (LISPE) =[LRTOTPE, S_INTRA; S_PUB; S_MARKET]. For estimation purposes we use the generalized tobit for equation A0 and A1 (Heckit procedure). The Mill ratio variables estimated from the generalized tobit are then used in Equation A3 and A4. Equation A3 will be estimated using a simple OLS as tests performed on innovation expenditures showed that the hypothesis of exogeneity between innovation expenditures and innovation sales cannot be rejected.8 Therefore there is no need to estimate A2 by instrumenting innovation expenditures. In contrast, tests showed that innovation sale is endogeneous in the productivity equation (A4). Therefore, it is estimated by instrumental variables (iv) - two stages least square regression. A brief discussion of exogenous variables used in the four equations follows. Decision to innovate and innovation inputs Instead of merely identifying export activity by a dummy variable as in the OECD core model, the Canadian Survey of Innovation 2005 allows for the use of the actual percentage of sales to the U.S. market (EXPORT-US) and to other foreign markets (EXPORT-OT). Exporters are more innovative, more capital intensive and more productive (Tybout, 2001). This is partly due to the selection effect since only the most competitive firms can challenge foreign competition and succeed in exporting. Owing to the close integration with the U.S. economy, sales to the U.S. market may present less of a challenge than exports to other areas. The latter may require more specific competencies, including the. 8. An earlier version of this paper (Therrien-Hanel 2008) described all the tests performed to assess whether the potential endogeneity between innovation expenditures and innovation sales was important enough to adjust by using IV regression. Suffice to say that for now that tests showed no need to use the IV regression. More details on tests and results in the next sections. Exhaustive results available upon request.. CIRST – Note de recherche 2009-02. page 13 .
(17) Innovation and Establishments' Productivity in Canada: Results from the 2005 Survey of Innovation. capacity to innovate. It may also be a source of learning by exporting. According to De Loecker (2006), competition in foreign markets is an abundant source of knowledge and technology; and firms that penetrate foreign markets acquire new knowledge that makes them more efficient. According to Baldwin and Gu (2003), Canadian-owned exporters of manufacturing products, especially new entrants to foreign markets and young firms, appear to benefit from both of these effects. Previous results (OECD 2008, Peters, 2008) showed that establishments that are part of a larger entity are more likely to innovate and spend more on innovation. This may be the case for many smaller establishments that could tap into firm’s resources and expertise. In this paper we wanted to test whether the “strength” of the link with the larger enterprise plays a role in firms’ behaviour with regards to innovation and innovation spending. The strength of the link is now expressed as the share of total revenue that comes from other establishments of the enterprise (INTRA_SALE). Finally, as stressed by management literature, firms’ strategies will impact their innovation and economic performances. Choosing to focus on one important client or to diversify the number of clients is believed to have an impact on the innovation behaviour of establishments. Firms generating a high proportion of total revenue from their most important client (MIC) are likely to face less incertitude with regard to the adoption of their innovation by their dominant consumer. Often, the innovation may have been created in collaboration with or in response to the demand of their most important client. The hypothesis behind this variable is in remote analogy with characterization of Pavitt’s specialized supplier sector (Pavitt, 1984). Firm’s perception of important success factors, i.e. strategies deemed responsible for firm’s success ranking "high" on the Lickert scale, are likely to be related to the decision to innovate. The active search of new markets (FAC_NEW), satisfying existing customers (FAC_EXIST) and developing custom designed products (FAC_CUSTOM) are success strategies believed to be closely associated with the decision to innovate.9. 9. The inclusion of those variables also serves another purpose. To identify and separate innovative and non-innovative firms (for the selection equation), information on all firms is required and unfortunately, few questions in innovation surveys are responded by both innovative and non-innovative firms. Success factors are one of the few questions responded to by both types of firms, and using them was helpful in getting a better result for the entire model.. CIRST – Note de recherche 2009-02. page 14 .
(18) Pierre Therrien and Petr Hanel. Government support reduces the marginal cost of innovation hence reducing one of the principal obstacles to innovation (Czarnitzki, Hanel and Rosa, 2005). The decision to innovate may be induced by government support as is the case in some European countries (Griffith et al., 2006). Two dummy variables identifying whether firm claimed R&D tax credits (GTXC) and/or received R&D grants (GRANT) are included in the selection and innovation expenditure equations.10 Establishments, especially the smaller ones that do not conduct regular R&D activity, may contract out specific research and development tasks to private or public R&D institutes. On the other hand, access to external R&D may complement firm’s internal R&D competencies. Thus it is not a priori clear whether contracting R&D out is a substitute or a complement to intensity of innovation expenditures. In case the firm contracts out R&D, the sign and statistical significance of the regression coefficient of the dummy variable (RD_OUT) will indicate whether and how this strategy affects firm’s investment in innovation activity. Innovation’s profitability is expected to increases with firm’s market share (MKTS02). Innovation output equation The output of innovation is measured by the log of sales of new and improved products and services per employee (LISPE). The specification of explanatory variables in this equation is similar to the OECD core model. In addition to the log of innovation expenditures per employee (LRTOTPE) and the log of firm’s employment (LEMP), it includes three specific sources of innovation (S_INTRA, S_PUB, and S_MARKET) in replacement of the four specific cooperation variables that did not perform very well for Canada in the OECD core model. Earlier studies show that innovation feeds not only on R&D competencies. It also often comes from ideas and suggestions from other internal sources such as management (especially in smaller firms without a regular R&D division), sales and marketing and production staff and from various external sources. Since the metrics for innovation outcome (LISPE) is the value of new and improved product sales per employee, it is expected that it is closely associated with information from market partners such as clients and suppliers and public research institutions (Baldwin and Hanel, 2003; Landry and Amara, 2003).. 10. Unfortunately, quantitative information on the amounts of the subsidies and tax credits are not available from our data base.. CIRST – Note de recherche 2009-02. page 15 .
(19) Innovation and Establishments' Productivity in Canada: Results from the 2005 Survey of Innovation. Productivity equation First, labour productivity is now measured by value added per employee, a more appropriate measure of labour productivity than the total revenue per employee used in the OECD core model. In conformity with production function theory, both the human capital measured as the proportion of university graduates in firm’s total employment (HC) and the physical capital represented by the cost of fuel and energy per employee (LGIPE) are now included in the productivity equation.11 Firm’s labour productivity is expected to also be affected by its innovation activity, i.e. by the outcome of product innovation (LISPE) and by process innovation (PROCESS). Firms with higher productivity at the beginning of the period LVAPELAG are likely to report higher productivity at the end of the period. 3.2 The data The data are from the Canadian Survey of Innovation 2005 on manufacturing and logging industries (reference period 2002 to 2004) linked to the Annual Survey of Manufactures and Logging .12 The target population of the survey is establishments with more than 19 employees and at least $250,000 in revenues according to Statistics Canada‘s Business Register (June 2005 version). The linked survey has a total of 6109 observations. From the 6109 observations, we kept only those in the manufacturing sector with positive revenue and with more than 9 employees according to data from the Annual Survey of Manufactures and Logging to standardize the target population for all OECD countries.13 The Canadian final sample were thus of 5,355 observations.. 11. Due to data constraints, we used the expenditure on power and fuel in manufacturing activities as a proxy for physical capital. Energy consumption is closely related to physical capital and energy has been successfully used as a surrogate for capital (e.g. Hillman and Bullard, 1978). 12. The Statistics Canada Survey of innovation 2005 does not survey services firms. The innovation survey data are linked to principal statistics from the Annual Survey of Manufactures and Logging, 2002 and 2004. For more information on the survey, go to http://www.statcan.ca/english/sdds/4218.htm 13. Some firms with less than 20 employees (and also less than 9 employees) were found in the database. The survey population was defined using the June 2005 version of Statistics Canada’s Business Register. The annual Survey of Manufactures and Logging includes data from 2002 and 2005.. CIRST – Note de recherche 2009-02. page 16 .
(20) Pierre Therrien and Petr Hanel. List of variables Symbol COOP EXPORT_OT EXPORT_US FAC_CUSTOM. Description Plant co-operated on innovation activities Percentage of plant’s total revenue exported to other destinations Percentage of plant’s total revenue exported to the U.S. Developing custom designed products is the most important factors for plant’ success FAC_EXIST Satisfying existing clients is the most important factors for plant’ success FAC_NEW Seeking new markets is the most important factors for plant’ success INTRA_SALE % of plants total revenue in 2004 from other plants in the firm FINSUP Plant received funding from federal or provincial governments GP Operations of your plant are part of a larger firm GRANT The plant(firm) used government R&D grants GTXC The plant (firm) used R&D tax credits HC Human capital (percentage of full time employees with university degree) LEMP (LEMP02) Log of employment (Log of employment for beginning of period (2002)) LGIPE Proxy for physical capital (Cost of energy and fuel per employee) LISPE Log of innovation sales per employee LLPE Log of total revenue per employee LRTOTPE Log of total innovation expenditures per employee LVAPE Log of value added per employee LVAPELAG Log of value added per employee at beginning of period (2002) MIC % of plants total revenue in 2004 from the most important customer MKSH02 Plant's market share at beginning of period (share of plant's output over industry output) PROCESS Plant introduced a new or significantly improved production process, distribution method, or support activity for its goods or services RD_OUT R&D contracted out S_INTRA Internal sources of information on innovation S_PUB Information on innovation from public sources S_SUPP Sources of information on innovation from suppliers INDUSTRY. Industry dummy variables are included in all equations.. Food + Tobacco Textile Wood Paper Petro + Chem Non-metal Fab- metal M&E + Telecom 334-335) Transport NEC. Industry: Food and Tobacco (NAICS: 311-312) Industry: Textile, Clothing and Leather (NAICS: 313-316) Industry: Wood products (NAICS: 321) Industry: Paper and Printing (NAICS: 322-323) Industry: Petroleum, Chemical and Plastics & Rubber (324-326) Industry: Non-metal products (NAICS: 327) Industry: Primary metal and Fabricated metal products (NAICS: 331-332) Industry: Machinery, Electrical, Electronic computer and communication (NAICS: Industry: Transportation (including aerospace) (NAICS: 336) Industry: Furniture and NEC manufacturing industries (NAICS: 337-339). CIRST – Note de recherche 2009-02. page 17 .
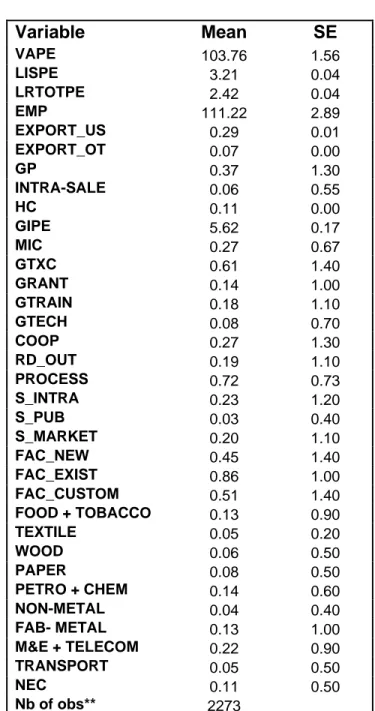
(21) Innovation and Establishments' Productivity in Canada: Results from the 2005 Survey of Innovation. 3.3 Comparison of innovating and non-innovating firms Before turning to the analysis of the econometrics results, let's first provide a brief descriptive analysis of the data presented in Table 1. First, 66% of the Canadian establishments described themselves as innovators; as they introduced a new or improved product or process in the last three years. The average productivity level (VAPE) of the innovators is 11% higher (i.e. $10,000 per employee higher) than for non-innovators.14 As for firm's characteristics, the sub-group of innovators are larger (EMP: average of 109 employees for innovators versus 70 employees for non-innovators), and more likely to be part of a larger enterprise (GP: 37% vs. 31%). Innovators have, on average, a higher share of university graduates (HC: 10% vs. 7%) in their workforce. There is, however, no statistically significant difference in physical capital intensity (LGIPE) between the two groups. Innovators are also more exposed to international market by exporting a higher share of their products (in the United States as well as in other foreign markets) than non-innovators. Regarding firms’ business strategies, both innovators and non-innovators devote a similar share of sales to their most important client (MIC: at a little less than 30% of their sales); but innovators are more likely to see the active search of new market (FAC_NEW) and developing custom-designed products (FAC_CUSTOM) as important success factors than noninnovators. Satisfying existing clients is seen as equally important for innovators and non-innovators. Table 2 provides information on the sub-sample of innovators “strict” (those with positive innovation expenditures and innovation sales). This is the sub-sample that will be used in the econometric model (more specifically for equation A3 and A4). The descriptive statistics of variables included in the econometric model are presented in Table 2. The average labour productivity of “strict” innovators is slightly lower (103.76) than productivity (106.99) of all firms that declared to have innovated15 (cf. Column 1 in Table 1). Strict innovators spent on average 11% of their total expenditures on innovation. Note the result of innovative firms being more productive than non-innovative firms also hold when computing a simple regression model where firm size, human and physical capital variables are taking into account. 14. 15 Firms that did not meet the more stringent criteria to be considered innovators in the “strict sense” (firms and plants that incurred innovation expenditures and reported innovation sales).. CIRST – Note de recherche 2009-02. page 18 .
(22) Pierre Therrien and Petr Hanel. activities and 22% of their total sales comes from sales of their new and improved –innovatedproducts.16 The comparison with all innovators shows that a slightly larger proportion of the “strict” innovators used various government support programs; only the difference with respect to R&D tax credits is statistically significant. The average log of innovation sale per employee (LISPE) is 3.21 or roughly $25,000 per employee.17 More than one out of four firms cooperated for innovation activities with other firms and institutions and almost one in five contracted out R&D. 3.4 Interpretation of the estimated model The results of the three stage-four equations model are presented in Table 3. Four models were estimated. The first two presented in Table 3, column (1) and (2), include firms of all sizes. The model in column (1) includes employment, exports, sales and productivity variables for the final year of the 2002-2004 period covered by the innovation survey. The model in column (2) introduces a time lag structure. The firm’s employment (LEMP02), market share (MKTSH02)18 and labour productivity (LVAPE02) are now measured at the beginning of the period (2002). Introducing the productivity level at the beginning of the period among explanatory variables separates the effect of innovation on productivity in 2004 from the effect of the pre-existing level of productivity in 2002, while adding firm's market share gives useful information on firm's dominant position on the Canadian market. Note however, that using the economic data for the 2002 and 2004 causes a loss of about one thousand observations and therefore direct comparisons between results from model (1) and (2) must be made with caution.. 16. According to Statistics Canada protocol, it was not possible to publish the average spending on innovation activities per employee (coefficient of variation of this descriptive variable too high). We therefore present the average share of innovation expenditures and innovation sales. Note however the dollars intensity by employee was used in the regressions. 17. See footnote above. The same issue (Statistics Canada protocol) prevent us to present a more precise figure.. 18. Note that the denominator of that variable is the 2002 Gross output (in Current Prices) by industry, and comes from Statistics Canada “Industry Productivity KLEMS 1961-2003”, data base made available to researchers under the Data Liberation Initiative on a CD support (January 2008).. CIRST – Note de recherche 2009-02. page 19 .
(23) Innovation and Establishments' Productivity in Canada: Results from the 2005 Survey of Innovation. Since other studies suggest that the size of the firm matters both for innovation and for productivity. Separate estimates for the small and medium size firms (SME employing less than 150 persons and the large ones are presented in column (3) and (4) respectively. Their interpretation follows that of the first two models. 3.4.1 Selection equation - Probability to be a strict innovator (product innovator with positive innovation expenditures and innovation sales). The sample used in the estimation of the first equation A0 includes all firms (innovating and noninnovating ones). It estimates the probability that a firm is innovating in the strict sense, i.e. that it reports sales of product innovations and that it incurred innovation related expenditures. These ‘strict’ innovation criteria are likely to introduce a selection bias. First, since only product innovations are considered, it excludes firms and plants that improved their production process (improved or new manufacturing process, logistic or other supporting activities) but did not sell product innovations. It also excludes cases where a firm introduced innovations without incurring or reporting innovation related expenditures. To derive unbiased conclusions from the estimating sample, we used the two step Heckman procedure that estimates in the first ‘selection’ equation (A0) the probability that a firm innovates and in the next step (A1) the innovation related expenditures per employee. It also estimates the Mills ratio which is then included in the rest of the model in equations (A2) and A3) in order to correct the selection bias. The probability that a firm becomes a strict innovator increases with the size of firm as measured by employment. This corroborates findings from other Canadian innovation surveys (Baldwin and Hanel, 2003; Baldwin and Gelaltly, 2003; Gault, 2003). According to the OECD core model, exporters are more likely to innovate than non-exporters. 19 The more detailed data on export activity used in the. 19. The relationship between exporting and innovating is very likely endogenous. Exporting firms benefit in their innovation activities from knowledge spillovers from foreign markets and exporting provides both incentives to innovate by extending the market size on which to sell innovations and the competitive stimuli which often makes innovation a sine qua non condition for survival and expansion on the export market. On the other hand, a firm may be in the export market thanks to former or current innovations that opened new markets and/or increased its productivity and foreign competiveness. The causality certainly goes both ways and our model does not attempt to disentangle the complex relationship between exporting and innovation. A study of a large sample of Dutch firms found that a firm’s export intensity has a positive impact on the probability of and intensity of R&D activity. The other direction of causality was found as well. A firm’s R&D activity increases the probability of exporting but not its intensity (Kleinknecht and Oostendorp, 2002). In Canada, Baldwin and Gu (2003) have shown that learning through exporting is particularly present for Canadian-owned and ‘young’ firms. Besides, exporting improves productivity, especially in domestic-controlled plants.. CIRST – Note de recherche 2009-02. page 20 .
(24) Pierre Therrien and Petr Hanel. present model show, however, that the probability of a firm being a strict innovator increases only with the proportion of sales exported outside the familiar U.S. market to other destinations. This presumably suggests that exporting to overseas markets is more demanding but also more rewarding. The integration of the plant within the firm matters as well, even though its effect on innovation is limited. Plants that generate an important proportion of their revenues from sales to other plants of their firm (INTRA_SALE) are marginally more likely to be strict innovator. The strategic orientation of a firm is an important innovation determinant. Firms that attribute their success to strategy based on the search of new markets are likely to innovate. In the same manner, firms that develop custom-designed products are more likely to innovate. In contrast, firms that focus their strategies on satisfying existing clients are unlikely to innovate. Public support for innovation through R&D tax credits or grants encourages R&D activity and increases the probability of being a strict innovator. Finally, the statistically significant coefficient of rho shows the importance of correcting the selection bias by using the Heckit procedure. Results from Model (2) show that the positive effect of size on the probability of being a strict innovator almost vanishes (barely statistically significant (10%) coefficient) when using the size of the firm at the beginning of the period. Other than the reduced coefficient of the employment variable, and some changes in the effect of exporting on the decision to innovate, there is not much difference between the two models. 3.4.2 Innovation input equation. The second equation (A1) is the outcome equation of the Heckman procedure that models firm’s innovation expenditures per employee. The estimated regression coefficients are presented in the second block of Table 3. Since investment in innovation is to a large extent a fixed cost, the intensity of investment in innovation as measured by total innovation expenditures per employee is understandably decreasing with the size of employment. The strong link between exporting outside the U.S. and investment in innovation is confirmed. However, even firms that export to the U.S. market spend more on innovation per employee than non-exporters.. CIRST – Note de recherche 2009-02. page 21 .
(25) Innovation and Establishments' Productivity in Canada: Results from the 2005 Survey of Innovation. Firms that cooperate on innovation are more likely to spend more on innovation than those that do not. This suggests that cooperation is unlikely to be undertaken as a cost saving measure, but rather to increase the scope of the project or complement firm’s competency. Similarly, contracting R&D out does not seem to be a cost reducing strategy. The positive elasticity estimate suggests that firms with high innovation expenditures intensity are also more likely to contract out R&D instead of using those R&D contracts for substituting their own innovation activities. Interestingly, while fiscal incentives and direct subsidies to innovation are positively associated with the probability of being a strict innovator (cf. the interpretation of the selection equation above), they are not associated with more innovation expenditure intensity.20 As suggested by microeconomic analysis, firms with a larger market share at the beginning of the period invest in innovation more per employee than those with smaller market share. 3.4.3 Innovation output equation. The innovation output equation shows the contribution of various variables to innovation output (LISPE) measured as the value of new and improved products - product innovations- per employee. This equation assesses, among other factors, the importance of innovation expenditures on innovation sales. The elasticity of LISPE to RTOTPE is 0.33, very similar to elasticity estimated by the OECD core model (0.37).21 Several other variables have an important effect on the output of innovation. First of all, only innovations inspired by ideas from market partners (customers, suppliers, competitors, consultants and commercial R&D laboratories) enhance the commercial success of innovation. This finding corroborates earlier results by Baldwin and Hanel (2003), underlining the importance of the. 20. When using the OECD model, the coefficient of public R&D financial support for Canada was positive and significant but with a weaker correlation (significant at 10% level only) than for other countries (see Annex for details). The effect vanished when we use the extended model. It should be noted that quantitative variables (real amount of R&D grants and tax credit) would be needed to get a better idea of the real causal effect on firm’s innovation expenditure intensity. As noted before, such data were not available with the database used. 21. The innovation expenditure variable (LRTOTPE) is potentially endogenous with the innovation sales variable (LISPE). However, tests (the “difference-in-Sargan C statistic" and a manual test regressing the estimated error of LRTOTPE on LISPE equation) indicate that the hypothesis of exogeneity can not be rejected. Furthermore, the Stock-Yogo relative bias test shows that the potential bias by using the OLS procedure would still be lower than the bias by using the IV regression. Therefore equation (3) was estimated by OLS using the observed rather than the instrumented LRTOTPE variable.. CIRST – Note de recherche 2009-02. page 22 .
(26) Pierre Therrien and Petr Hanel. commercial orientation of innovation. The fact that other internal sources of the firm (sales, marketing, production) do not seem to contribute to innovation sales may be interpreted as an indication that their contribution is already included in total innovation expenditures. More capital-intensive firms, especially those with high human capital, are more successful at commercializing innovations, and innovating firms introducing also a process innovation derive more sales from innovation than those introducing only product innovations. Finally, firms with higher productivity level at the beginning of the period (model (2)), derive more sales from innovation at the end of period than those with lower initial productivity level. This means that firms that were already outperforming other firms in productivity are more likely to be successful innovators (measured by innovation sales) in the next period. Also, it is interesting to note that adding the productivity at the beginning of the period does not change the sign and impact of other core variables; in particular the impact of innovation expenditure intensity remains similar. 3.4.4 Productivity equation. Finally, the productivity equation shows that firms with higher innovation sales per employee LISPE obtain higher labour productivity expressed as log of value added per employee LVAPE. The elasticity of the instrumented22 variable LISPE is positive and statistically significant (0.21) which is about half the value estimated in the OECD core model. Productivity increases slightly with the size of establishment, and when the establishment is part of a larger enterprise. Conforming to economic theory, both human and physical capital intensity are important co-determinants of labour productivity. As in the core model, firms introducing a process innovation (in addition to a product innovation) have lower labour productivity than other innovative firms.23 While this result is counterintuitive and in. 22. According to the tests (the “difference-in-Sargan C statistic" and a manual test regressing the estimated error of LISPE on LRTOTPE equation), LISPE and value added per employee LVAPE are endogenous. Therefore the productivity equation is estimated as a 2SLS system with LISPE instrumented in the 1st stage. 23. In the OECD core model the estimated regression coefficient of PROCESS innovation dummy variable is negative and statistically significant for all countries. To explore further the relationship between labour productivity and process innovation we experimented by replacing PROCESS by specific forms of process innovation such as: (i). New or significantly improved method of producing goods or services;. (ii). New or significantly improved logistic, delivery or distribution methods and. CIRST – Note de recherche 2009-02. page 23 .
(27) Innovation and Establishments' Productivity in Canada: Results from the 2005 Survey of Innovation. contrast with other studies (see Griliches,1998 for the U.S. Criscuolo and Gaskell, 2003 for U.K and Hanel (2000) and Baldwin and Gu (2004) for Canada), some explanations can be proposed. First, the model used focuses primarily on product innovators, and therefore the negative coefficient on productivity is relative to product innovators that do not introduce process innovation. It is therefore possible to think that firms introducing both product and process innovations are introducing complex change (and maybe more radical innovations) in their manufacturing processes, leading to a short term negative impact on labour productivity. Second, the effect of process innovation is not as well captured in the Canadian survey as it is for product innovation. To mirror the measurable effect of product innovation (as measured by sales per employee from innovative products), we would need a variable that would assess the cost saving from process innovation.24 Without such a variable, it is hard to assess the effect of process innovation that would lead directly to productivity gains. Finally, including labour productivity at the beginning of the period as an additional explanatory variable (model (2)) does not change the results discussed above. Even though labour productivity in 2002 is an important determinant of productivity in 2004, it does not significantly change the effect of innovation sales on labour productivity. The estimated elasticity of productivity on innovation sales is slightly lower (0.17), but within the same range as the elasticity estimated in the first model (0.21) with contemporaneous variables. In conclusion, the better specification and improved estimation procedures of the extended Canadian model provides robust results that confirm, with added detail, the principal conclusions of the OECD core model. It shows, in no uncertain terms, that product innovation contributes significantly to higher productivity.. (iii). New or significantly improved supporting activities for firm’s processes such as maintenance system, or operations for purchasing, accounting or computing.. (iv). Process innovation increased flexibility of production. (v). Process innovation increased speed of supplying and/or delivering goods and services.. Among the first three types of process innovation only the new or improved manufacturing method (i) has a significantly negative correlation coefficient. The other two types of process innovation are not correlated with labour productivity. When labour productivity is regressed on the specific effects of process innovations such as increased speed of delivery of goods and services or production flexibility, the correlation is still negative and statistically significant. 24. The elasticity of productivity on the cost saving from process innovation, an information available in the German innovation survey, is positive and statistically significant (see Peters 2008).. CIRST – Note de recherche 2009-02. page 24 .
(28) Pierre Therrien and Petr Hanel. 3.4.5 Overview of estimation results for SME and large firms. Previous studies suggested that the size of firm is an important determinant of innovation and that the SME do not innovate in the same way as the large firms (Acs and Audretsch, 1988; Baldwin and Hanel, 2003; Baldwin and Gelaltly, 2003). This raises the question of whether the effect of innovation on productivity is also different between the two groups. To determine to what extent the size of firm matters, the model was estimated separately for small and medium size firms employing less than 150 persons and for the larger firms. The results for SME and large firms are presented respectively in the 3th and 4th columns in Table 3 and they indeed show some notable differences between the two size categories. First, since most of large firms are exporting, exporting does not discriminate between innovators and non-innovators and investment in innovation for large firms. Similarly, human capital does not have a significant effect on innovations sales and productivity in large firms. In contrast, human capital increases innovation sales, but not labour productivity, in SMEs. While the elasticity of innovation sales to innovation expenditures is comparable between the two groups, the elasticity of labour productivity to innovation sales per employee LISPE is twice as large in big firms (0.35) than in the SME (0.18).. 4. Conclusions and Policy Implications The recent sub-par productivity performance of Canadian businesses is a source of concern as high productivity is needed to sustain the economic growth and improve, or at least maintain, our quality of life. Given that innovation and the use of new technologies is one of the main drivers to high productivity, Canadian firms’ lower investments in innovation and new technology is often seen as the main reason behind their lagging productivity performance. While aggregate numbers are certainly useful to illustrate the overall situation, they also hide huge heterogeneity within the business sector and even within individual industries.. Firms' business. strategies, resources and challenges they face affect their behaviour and ultimately their performance. It is therefore important to complement the macro view based on broad aggregate numbers with firmlevel analysis to better understand the relationships between innovation and productivity. The firm-level data from Statistics Canada Survey of Innovation 2005 provide information on the firm’s human resources, their strategies and challenges, sources and outcomes of innovation activities,. CIRST – Note de recherche 2009-02. page 25 .
(29) Innovation and Establishments' Productivity in Canada: Results from the 2005 Survey of Innovation. their costs as well as government programs they have used. An initial interesting result from the innovation survey database, is that innovative firms are more productive than non-innovative firms. Indeed, firms that introduced an innovation in the 2002-2004 period created on average $10 000 more value added per employee than those that did not innovate (Table 1). To better understand which firms are most likely to innovate, and which innovative strategies lead to better productivity performance, we used a well-known econometric framework (introduced by Crepon-Duguet- Mairesse in the 1998 study of French manufacturing firms) linking firm's investment in innovation to firm's innovation output and its impact on productivity. Our main results suggest that export (only outside of the US market); size of the firm and use of direct or indirect government supports are factors increasing the probability to innovate and having positive innovation sales. Exports (both to the US and outside of the US market), cooperation with other firms and organizations, and high share of the firms’ revenue coming from sales to its most important client are all factors correlated with higher innovation expenditures per employees. Moreover, firms with a higher market share at the beginning of the period are spending more on innovation by the end of the period. Firms with higher innovation expenditures per employee also generate more innovation sales per employee (an increase of 1% of innovation expenditures per employee is linked with an increase of 0.33% of innovation sales per employee). Firms introducing both product and process innovations also generate more innovation sales per employee than those introducing only product innovations. Other factors increasing innovation sales are human and physical capital and introduction of process innovations. Finally, results from the model show that more successful product innovators (those generating more innovation sales per employees) achieve higher labour productivity, even when the size of firms and intensity of human and physical capital are taken into account (an increase of 1% of innovation sales per employees is linked to an increase of labour productivity by 0.22%). It is worth noting that firms that are more productive at the beginning of the period are also the ones that derive more sales from innovation and are also still more productive by the end of the period.. CIRST – Note de recherche 2009-02. page 26 .
(30) Pierre Therrien and Petr Hanel. These results are in line with those obtained when using a simpler model applied to 18 other OECD countries (OECD STI-Outlook 2008, Chapter 5 (see Appendix 1 for details)).25 Results from both models (the simpler model used for benchmarking Canada internationally and the more robust model using all available information from the Canadian database presented here) show that higher innovation expenditure intensity is conductive to better innovation outcomes (higher innovation sales per employee); and in turn those highly-innovative firms are more productive. The main difference between the two models is that both the estimated elasticity of innovation output to innovation input and the elasticity of labour productivity to innovation sales are smaller, though still positive and statistically significant in the more robust model run exclusively on Canadian data. Therefore the coefficients from the OECD model should be used with caution and be treated as upper bound values. Our model also confirmed, with more details, the main factors leading to higher innovation and productivity performance.. Factors directly contributing to higher productivity are: a skilled. workforce; higher physical capital intensity; and, as said before, high intensity of innovation sales. Results from this study also showed that high innovation expenditure intensity is the best predictor of high innovation sales.. Finally, factors contributing indirectly (through innovation expenditure. intensity) to higher productivity are: tapping into global market as shown by export variables, cooperation to access external expertise and relying on market oriented external sources. The policy implication of these results is certainly interesting in a context where recent years' aggregate productivity in the Canadian business sector is considered weak (with MFP being the main culprit).. New evidence (OECD, 2007) confirms results highly publicized a few years ago. (Government of Canada, 2002) which shows that Canada has a high percentage of innovators (using a broad definition including technology adopters) but derives lower innovation sales than most OECD countries. This weak performance in selling innovative products seems to be an important barrier for higher productivity performance as shown by this study. Also of interest is the result that highly successful innovative firms (those who have high innovation sales per employee) devote more resources to innovation. Transposing this firm-level result to the. 25. Note that benchmarking Canada results with the other OECD countries must be done using the simpler econometric model in order to keep the comparison as precise as possible.. CIRST – Note de recherche 2009-02. page 27 .
Figure
Documents relatifs
A possible approach is the utilization of key performance indicators (KPIs) to measure the performance of systematic business innovation processes in virtual enterprise
The authors find a significantly positive influence of the unemployment benefit replacement rate, benefit duration and the tax variable density on unemploy- ment, a
In Ta/CoFeB/MgO/Ta films with perpendicular anisotropy bulk defect densities, and therefore depinning fields (Hdep), are relatively low 6–8. In Pt/Co/Pt films, for example, the
The empirical findings also suggest that in Belgium, Canada, Denmark, Finland, Ireland, Italy, Japan, Spain, Sweden, the UK and the US agents allow consumption to
The insurgence of the Arab uprisings that was sparked in the year 2011 marked a new chapter in the socio-cultural, economic and political life of the Arab region.
The combined trend profile from satellite measurements (Section 5.5) shows significant ozone decline in the pre-1997 period for all three broad latitude bands of -5.9 % ± 1.9 %
Within the group of persons who had been without employment a year before, those currently employed had a significantly better illness rate at the survey date than did
Finally, the resemblance of the metallicity distribution in the outer disk at high extraplanar distance (z > 5 kpc) with the disk sampled by APOGEE suggests that the metal-rich
