HAL Id: hal-03208575
https://hal.archives-ouvertes.fr/hal-03208575
Submitted on 26 Apr 2021
HAL is a multi-disciplinary open access
archive for the deposit and dissemination of
sci-entific research documents, whether they are
pub-lished or not. The documents may come from
teaching and research institutions in France or
abroad, or from public or private research centers.
L’archive ouverte pluridisciplinaire HAL, est
destinée au dépôt et à la diffusion de documents
scientifiques de niveau recherche, publiés ou non,
émanant des établissements d’enseignement et de
recherche français ou étrangers, des laboratoires
publics ou privés.
A Value-Oriented Price Forecasting Approach to
Optimize Trading of Renewable Generation
Akylas Stratigakos, Andrea Michiorri, Georges Kariniotakis
To cite this version:
Akylas Stratigakos, Andrea Michiorri, Georges Kariniotakis. A Value-Oriented Price Forecasting
Approach to Optimize Trading of Renewable Generation. 2021 IEEE Madrid PowerTech, IEEE, Jun
2021, Madrid, Spain. �hal-03208575�
A Value-Oriented Price Forecasting Approach to
Optimize Trading of Renewable Generation
Akylas Stratigakos
Center PERSEE
MINES ParisTech, PSL University Sophia-Antipolis, France [email protected]
Andrea Michiorri
Center PERSEE
MINES ParisTech, PSL University Sophia-Antipolis, France [email protected]
Georges Kariniotakis
Center PERSEE
MINES ParisTech, PSL University Sophia-Antipolis, France [email protected]
Abstract—The participation of renewable generators in elec-tricity markets involves employing a number of forecasting and decision-making tools. The standard approach consists in forecasting power output and market quantities, and then inputting the results into an optimization problem to derive optimal decisions. Typically, forecasting models are trained to optimize accuracy without considering the subsequent decision-making process. In this paper, we consider training forecasting models with a value-oriented approach that aims to minimize the suboptimality of decisions induced by a set of predicted inputs. We consider a risk-aware renewable generator participating in a day-ahead market subject to imbalance costs, and train ensembles of decision trees to forecast the imbalance penalty by directly minimizing trading costs for the provided strategy. The results indicate that our innovative approach leads to improved trading performance, compared to the standard method in which forecasting models are trained to minimize prediction errors.
Index Terms—Decision trees, electricity markets, energy trad-ing, value-oriented forecasttrad-ing, alternative loss functions.
I. INTRODUCTION
A plethora of problems related to power systems require making decisions under various forms of uncertainty [1]. The design of optimal participation strategies for renewable gener-ators in competitive electricity markets is a prevalent example [2], since it usually requires solving some form of stochastic optimization problem, typically in a “Predict-then-Optimize” framework [3]. This involves first estimating an uncertain parameter at a future time interval, in a form that can range from deterministic (point) forecasts, to predictive densities, simulation trajectories and uncertainty sets. In a second step, these forecasts are used as input in an optimization problem. When trading renewable energy on short-term markets, stochastic generation and market prices constitute typical sources of uncertainty. A significant body of work exists in this area, both for renewable energy [4] and electricity price [5] forecasting. Regarding price forecasting, most relevant work focuses on day-ahead (DA) prices. However, participation in
Parts of this research were carried in the frame of the European project RE-gions (No. 646039 and No. 775970), supported by ADEME’s ’Investissement d’Avenir’ program and the ERA-Net SES RegSys project, and the Smart4RES project (No. 864337), supported by the Horizon 2020 Framework Program.
multiple markets requires forecasting additional quantities, such as the imbalance penalty, defined as the difference between the DA price and the clearing price of the balancing market. A standard practice when forecasting the imbalance penalty is to split the problem into three components, namely direction and upward and downward regulation costs, and then model each one separately. In [6] an exponential smoothing approach is applied to capture the long-term trend and sea-sonality. A combination of a Seasonal ARIMA model with Markov Process is implemented in [7] to generate scenarios. In [8] a logistic regression model is employed to predict the imbalance direction, combined with ARIMA models for regulation costs.
A typical trading application would be a wind power plant (WPP) offering energy on the DA market subject to imbal-ance costs. In [9] the optimal risk-neutral offer is derived analytically as a quantile of the predictive density for wind generation, which also requires an estimation of the regulation costs. Extensions of this result include analytical expressions for the case of correlated DA and imbalance prices [10], con-sidering adjustment markets [11], and jointly offering energy and primary [12] or secondary [13] reserve. The design of the balancing market is also an important factor, and particularly whether it features a single or dual price balancing mechanism [14]. Under a single price mechanism, any deviations from the submitted schedule that help restore system frequency result in additional revenue. For such cases, several risk-constrained trading strategies are proposed in [8].
In many cases, however, it is not clear how to move from a prediction to an optimal decision, as increased forecast accuracy does not always correspond to increased economic value [15]. It is therefore important to also assess forecast value [16], i.e., the impact of a forecast on decision costs, in addition to statistical accuracy. In this work, we aim to take this approach one step further by directly training a forecasting model to maximize value under a provided trading strategy.
Decision-making can be improved by jointly considering the forecasting and the optimization problem, and recent works combine elements from the fields of machine learning and operations research towards this goal. In [17] two data-driven approaches are proposed for directly solving the newsvendor problem, a form of direct policy selection. In [18], a general
framework is proposed for using predictive machine learning algorithms to prescribe optimal decisions in the presence of explanatory data by solving a weighted Sample Average Approximation (SAA) of the original problem. The same work also introduces the coefficient of prescriptiveness, a unitless metric analogous to the R2 coefficient in regression, which is used to assess the relative performance of prescribed decisions. From an applications standpoint, [19] proposes a data-driven approach to increase forecast accuracy and trading value in the presence of deterministic forecasts of wind power.
In the context of statistical learning, forecasting models are trained via loss minimization, with the objective of optimizing predictive accuracy or probabilistic performance. Training is performed without considering the subsequent optimization problem, which arises later on the model chain. Two value-oriented forecasting approaches are proposed in [20] for the case of a photovoltaic (PV) generator participating in the DA market. In the first, the individual energy and price forecasting models are tuned based on the decision costs, whereas in the second, a direct policy selection algorithm is applied, mapping the input data to decisions. Both approaches are formulated as non-linear optimization problems and approximated with evolutionary algorithms. In this work, we employ a generic, novel approach to training forecasting models in a supervised learning setting, known as Smart Predict-then-Optimize (SPO) [3]. A forecasting model is trained with the goal of generating predictions that prescribe optimal decisions. An alternative loss function, called SPO loss, is used to measure the subopti-mality of decisions induced by a set of forecasted parameters. The proposed method can accommodate general multivariate and constrained optimization problems with a linear objective. Decision trees [21], including ensemble methods such as Random Forests, can be directly trained to minimize the SPO loss.
We consider the case of a virtual power plant (VPP), composed of wind and PV plants, participating in the DA mar-ket with a single price balancing mechanism. Assuming that the VPP generator has probabilistic forecasts for renewable generation at its disposal, we prescribe a profit-maximization strategy constrained in the probability space, which tunes the degree of risk-aversion. Based on this strategy, we derive the SPO loss function and train ensembles of decision trees to forecast the imbalance penalty for the DA horizon. We focus exclusively on imbalance penalties as they are very hard to predict, but the proposed framework is generic and can also accommodate energy forecasting models. We compare the effi-cacy of decisions to the standard approach, where a forecasting model is trained to minimize prediction error, and estimate a modified version of the coefficient of prescriptiveness. The results indicate that the proposed approach leads to improved decisions and increased forecast value.
The contribution of this work is threefold. First, we propose a novel approach for decision-making under uncertainty in electricity markets. Second, we derive the SPO loss function for a generic stochastic optimization problem, while previous works consider deterministic problems. Third, we advocate
using the coefficient of prescriptiveness as an insightful mea-sure of the relative efficacy compared to the base and perfect-foresight solutions.
The remainder of the paper is organized as follows. Section II presents the SPO framework, Section III formulates the trading problem and Section IV presents the results. Finally, Section V concludes and provides directions for further re-search.
II. THESPO FRAMEWORK
In this section, we provide a short description of the SPO framework and the training methodology, following [21]. For a nominal optimization problem with a linear objective, let ω ∈ Rddenote the multivariate decision vector, S the feasible
set defined by convex constraints and c ∈ Rd the
associ-ated cost vector. Minimizing the objective function results in z∗(c) = minω∈ScTω, with ω∗(c) = argminω∈S{cTω} being
the optimal decision. Since S is convex, ω∗(·) is readily solved with off-the-shelf solvers.
In reality, the cost vector c can be unknown. Instead, a train-ing set of n historical observations {(x1, c1), · · · , (xn, cn)} is
available, where x ∈ Rp is a vector of p explanatory features
used to forecast c. A forecasting model f (·) maps observations of x to c and generates a predicted cost vectorbc = f (x), which is subsequently used as input in the optimization problem, resulting in optimal decision ω∗(bc). During training, we search for an approximation bf (·) by minimizing the value of a loss function `(bc, c) over the training data. For regression, the most common loss function is the Mean Square Error (MSE), defined as `M SE(bc, c) := kbc − ck22.
The SPO loss function [3] is used to directly train a fore-casting model to minimize decision costs in the downstream optimization problem. For a predicted cost vector bc and an actual realization c, the SPO loss measures the difference in terms of cost as a result of taking decision ω∗(bc) instead of ω∗(c). For an optimization problem with a unique solution, the SPO loss function is defined as follows:
`SP O(bc, c) := cTω∗(bc) − z∗(c). (1)
A value-oriented forecasting model thus uses (1) to approxi-mate f (·). By applying the empirical risk minimization (ERM) principle, the following optimization problem is prescribed for training a forecasting model:
f∗= argmin1 N N X i=1 `SP O(f (xi, ci), ci). (2)
The SPO loss function can be non-convex and discontinuous, which poses challenges for training a machine learning algo-rithm. One approach proposed is to derive a surrogate loss function that provides an upper bound. A tractable methodol-ogy for directly training decision trees under the SPO loss is presented in [21].
Decision tree learning is a popular machine learning algo-rithm used both for regression and classification [22], as it offers intuitive and interpretable results. Decision trees work
by recursively partitioning the feature space Rp at different
components of x using binary splits. Each split creates an internal node, with the final partitions being referred to as leaves of the tree. The predicted output for a new observation of x that falls within a leaf equals the within-leaf mean or mode, for regression and classification respectively. The objective is to partition the feature space into L leaves, R1, ..., RL, by minimizing: min R1:L∈T 1 N L X l=1 min b cl X i∈Rl `(bcl, ci), (3)
where T denotes the internal structure of the tree. The popular CART algorithm [23] is used to grow decision trees by “greed-ily” selecting locally optimal binary splits. Trees are typically grown large enough to capture non-linear dependencies among training data, and are then pruned back into a simpler version, to reduce overfitting.
The SPO Trees methodology suggests growing a decision tree following a CART-like approach that selects the split that leads to the greatest minimization of the SPO loss. The average cost vector ¯cl of all observations that fall within a leaf is the
unique minimizer of the SPO loss within leaf l, as shown in [21]. This simplifies the task of training under the SPO loss and sets the basis for a tractable methodology of performing binary splits. The objective is:
min R1:L∈T 1 N L X l=1 min b cl X i∈Rl (cTi ω∗( ¯cl) − z∗(ci)). (4)
The recursive partitioning approach of CART is applied with respect to (4) by evaluating the objective value at each candi-date split and selecting the one that leads to lowest cost. For continuous features in x, a heuristic search is performed that only considers certain quantiles of the empirical distribution as candidate splits, in order to reduce the computational cost. Decision trees are prone to overfitting, i.e., they are subject to high variance, which diminishes their predictive perfor-mance. Bootstrap aggregating (bagging) is a general methodol-ogy for reducing variance in estimators. First, B new training sets are created by sampling with replacement (bootstrapping) from the original training set. Next, B models are trained and individual predictions are aggregated via averaging or majority vote. The Random Forest algorithm [24] further expands on the bagging algorithm by training on de-correlated samples, using only a subset of the feature vector x at each bootstrap iteration. The Random Forest algorithm significantly improves the predictive performance of decision trees. This methodology can be readily applied to SPO Trees to train ensembles of decision trees, which are called SPO Forests.
III. RENEWABLETRADING
We proceed by formulating the problem of a renewable generator participating in the DA market under a single price balancing mechanism, focusing on the impact of imbalance penalty forecasts. Throughout, we assume that the generator is a price-taker, hence energy offers do not affect market prices,
and probabilistic predictions for the renewable generation are available.
A. Problem Formulation
For a given delivery period t, let λD denote the DA price
and λB the single clearing price of the balancing market. The imbalance penalty is defined as ψ = λD− λB. When
the system is short, i.e., in need of upward regulation, it generally holds that λB≥ λD, therefore ψ ≤ 0. The opposite
is generally true when downward regulation is required, i.e., the system is long. However, these assumptions are regularly violated in practice, so we avoid imposing them moving forward.
Assuming energy quantities are normalized by the nominal capacity, the generator submits energy offers ED∈ [0, 1] for each delivery period t of the next day. Given the absence of temporal constraints, optimization is conducted over each time period separately, thus subscript t is dropped. The actual gen-eration is a stochastic process denoted as ˜E. The total revenue is also a stochastic process comprising two components, DA revenue and imbalance costs. Specifically:
˜
ρ = λDED+ λB( ˜E − ED) = λDE − ψ( ˜˜ E − ED). (5) From (5), we observe that when ψ < 0, if the generator overproduces, i.e., ˜E > ED, the second term becomes positive and additional revenue is received. A risk-neutral participant maximizes revenue by solving the stochastic optimization problem ED∗ = argmin(− ˜ρ). Under perfect foresight of ψ, the analytical solution to this problem prescribes offering either the nominal capacity or zero MWh [2]. Under uncer-tain market prices, the decision depends on the conditional expectation bψ as:
ED∗= (
1, if bψ ≥ 0
0, if bψ < 0 (6) By examining (6) we observe that ED∗ depends only on the sign of the predicted penalty bψ, with bψ = 0 being a trivial case. In reality, this strategy would expose participants to great risk due to large imbalances. In addition, the price-taker assumption could be violated in practice. Constraining the optimal offer can lead to a better risk-return trade-off [8]. Assuming knowledge of the predictive cumulative density function (cdf) bFE for the stochastic generation, we propose
the following analytical rule for constraining the offer in the probability space: ED∗= b q1−a, if bψ > 0, b q.50, if bψ = 0, b qa, if bψ < 0, (7)
where qba is the a-quantile of bFE, with a ∈ (0, 0.50] being
a design parameter that tunes the degree of risk-aversion. As a → 0.50, the second term in (5), which corresponds to the energy imbalance, becomes smaller and the trading strategy becomes more risk-averse. The problem of identifying the
optimal offer thus boils down to estimating the sign of the ex-pectation bψ, which can be cast either as a regression or binary classification problem. Note that the cost of misclassification is dynamic, since it depends upon the absolute value of the realized penalties. Therefore, it is important to jointly consider direction and price in the forecasting model, as a wrong sign prediction in the presence of a large penalty would lead to excessive losses.
B. Derivation of the SPO Loss Function
Let ximb ∈ Rp denote the historic explanatory data used
as input for predicting ψ. Given a prediction bψ = f (ximb) and an actual realization ψ of the imbalance penalty, we derive the optimal decisions from the analytical solution (7) as ED∗( bψ) and ED∗(ψ), respectively. The revenue (5) remains
a stochastic process, which depends on the realization of uncertain generation. One way to describe the SPO loss function is as the deviation from the expected revenue given uncertain renewable generation, which can be done either via sampling scenarios or by integrating over bFE. Alternatively,
given the additional realization of actual generation Eobs, we
can define the SPO loss, in terms of costs, as follows: `SP O( ˆψ, ψ) = −λDEobs+ ψ(Eobs− ED∗( ˆψ)) + ρ∗(ψ), (8)
which finally results in:
`SP O( ˆψ, ψ) = ψ(ED∗(ψ) − ED∗( ˆψ)). (9)
From (9) we observe that if ψ, ˆψ have the same sign, no loss incurs. If the sign is different, then the loss equals the difference between qba and qb1−a, scaled by the imbalance penalty ψ. This means that the loss also depends on the dispersion of bFE. Observations that correspond to higher
uncertainty in energy production, i.e., a larger dispersion in b
FE, are thus weighted more heavily during training. This effect
can be tuned by the selection of a. Overall, we observe that the training process is jointly affected by the sign and value of penalty ψ, the predictive density bFE, and the selected trading
strategy.
IV. EVALUATION ANDRESULTS
A. Case Study Description
The proposed methodology is evaluated for the case of a VPP located in France, comprising wind and PV plants with a total capacity of 42.3 MW, and a 24% share of PV. Probabilistic predictions are obtained from [13] using a Quantile Regression Forest (QRF) model. Four months of probabilistic predictions at a 15-min resolution are available, with the first two used for training, and the rest for out-of-sample validation.
We used data from the German electricity market spanning the period April-July 2020. Explanatory data ximb used for predicting ψ comprise historical observations for imbalance price, system imbalance volume, DA price, and DA forecasts for system load, solar, wind and thermal generation. All market data are published prior to market closure and are available at [25]. In addition, one-hot encoded categorical variables are
included to model possible calendar effects, namely day of the week, hour of the day and quarter of the hour. Since the DA market closes at 9h00 UTC on the previous day, the clearing price for the balancing market and the system im-balance volume of that day are unavailable. Instead, historical observations from two days prior to the delivery are used, as well as the value last observed at the forecast origin.
B. Benchmarks
Two additional price forecasting models are trained un-der the standard Predict-then-Optimize framework and eval-uated based on trading results obtained by applying the risk-constrained strategy described in (7). In order to better illus-trate the added value of training under the SPO loss instead of a traditional loss function, two variations of the Random Forest algorithm are considered. Specifically, the benchmarks are:
• Random Forest Regressor (RF-Reg): A Random Forest model is trained in a typical regression fashion to predict ψ by minimizing MSE loss during training.
• Random Forest Classifier (RF-Class): A Random Forest classifier is trained to predict the probability φ of the system being short. Here, splits are decided based on the reduction of the Gini index, which measures the impurity of each node [22]. Following (7), if bφ > 0.5, then the optimal offer isqba, or elseqb1−a.
Note that the decision threshold for the RF-Class model is set naively at 0.5, without considering any asymmetry in imbalance penalties. However, tuning for this threshold requires an ad hoc estimation of the value of imbalance penalties, which itself is a regression problem. As our goal is to showcase improved performance of a single model that uses an alternative loss function, we avoid developing a separate model to tune this parameter. Finally, in order to present more comprehensive results, the Expected Value (EV) offering strategy is also evaluated, with the offer being ED∗ = E( bFE). The EV strategy depends only on renewable
generation forecasts and provides a trading benchmark. Preliminary analysis indicated that modeling each 15-min interval separately does not offer added value, thus a single model is trained for all time steps. All trees are fully grown without pruning. Ensemble tree algorithms are considered fairly robust against overfitting and immune to noisy inputs, and thus do not require extensive feature selection. The number of trees B to grow is set at 300 throughout, which is adequate to capture non-linear dependencies and ensure convergence of the ensemble effect. Two hyperparameters require further tuning, namely the size m of the feature subset selected at each bootstrap iteration and the minimum number nmin of sample observations required to split an internal
node, which is conducted via grid-search with a 5-fold cross-validation. For the SPO Forests in particular, hyperparameter tuning is conducted using a custom scoring rule that evaluates the expected revenue during cross-validation. Moreover, for the SPO Forests a different model is trained for each value of the risk-parameter a in (7) and continuous features of
TABLE I
TRADINGRESULTS FOR THETESTINGPERIOD
Trading a = 0.05 a = 0.10 a = 0.20
Results EV SPO Forest RF-Reg RF-Class SPO Forest RF-Reg RF-Class SPO Forest RF-Reg RF-Class Total revenue (EUR) 354 674 369 121 367 395 355 893 370 808 366 656 357 700 363 380 362 946 357 241
CV aR5%(EUR) -78.02 -141.50 -167.80 -178.51 -111.63 -129.75 -139.34 -88.11 -101.15 -107.01 Energy bid (MWh) 9 677 6 902 10 310 9 626 7 432 10 090 9 562 8 123 9 914 9 567 Absolute bid deviation (MWh) 2 676 5 121 5 173 5 138 4 343 4 299 4 283 3 529 3 458 3 461 Revenue per imbalance (EUR/MWh) 0.85 3.26 2.90 0.68 4.24 3.32 1.24 3.11 3.05 1.40
ximb are evaluated at quantiles {0.10, . . . , 0.90}. The SPO
Forests are trained using the implementation provided at https://github.com/rtm2130/SPOTree.
C. Results
We assess the out-of-sample trading performance of the forecasting models over the 2-month testing period. The 5% Conditional Value at Risk (CV aR5%), defined as the expected
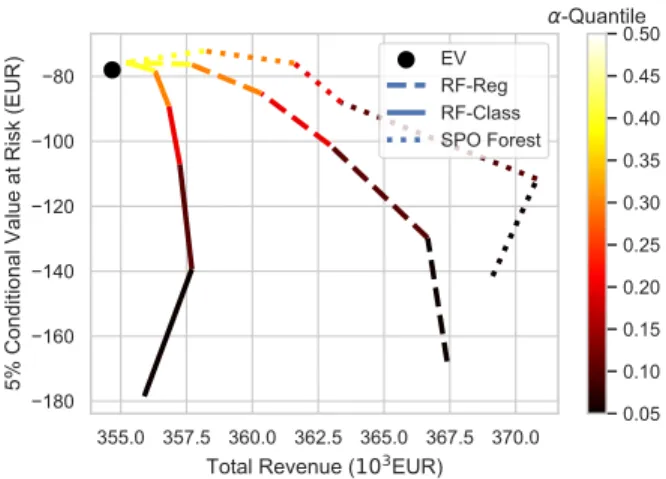
profit in the worst 5% of cases, is used to measure trading risk. Table I presents analytical results for a = {0.05, 0.10, 0.20}. Overall, the SPO Forest model outperforms the other bench-marks in terms of revenue for a given value of a, reaching up to a 4.5% increase compared to the EV strategy for a = 0.10. In general, lower values of a lead to an increase in both revenue and risk, as evidenced by a decrease in CV aR5%,
which is in accordance with our expectations for a risk-aware trading strategy. This fact is highlighted in Fig. 1, where aggregated revenue is plotted against CV aR5%for the
different levels of a. Fig. 1 shows the SPO Forest model leads to improved overall performance, both in terms of generated revenue and risk, with consistent results across the different degrees of risk-aversion. Specifically, the line that corresponds to the SPO Forests sets the efficient frontier, i.e., for a given amount of risk the SPO Forests result in the largest revenue across the different models (and vice versa). As a → 0.50, all models converge to a similar performance. The RF-Class model performs the worst overall, offering only a marginal revenue increase compared to the EV strategy, accompanied by a large increase in risk.
An interesting result observed from Table I is that the SPO Forest model results in the VPP offering the least amount of energy in the DA market across the different values of a. This could be attributed to the SPO Forest model adapting to the asymmetry between the upward and downward regulation costs. Indeed, the in-sample absolute averages for upward and downward penalties are approximately 40 EUR/MWh and 37 EUR/MWh, respectively, which probably causes the SPO Forest model to favor offers below the expected generation. We further observe that all models achieve a positive revenue per imbalance. This is attributed to the single price balancing mechanism, but is also highly dependent on the selected testing set. For example, the fact that the EV strategy achieves a positive revenue per imbalance is purely coincidental, since
Fig. 1. Risk vs Total Revenue for different values of a
in this case imbalances only depend on generation forecast errors.
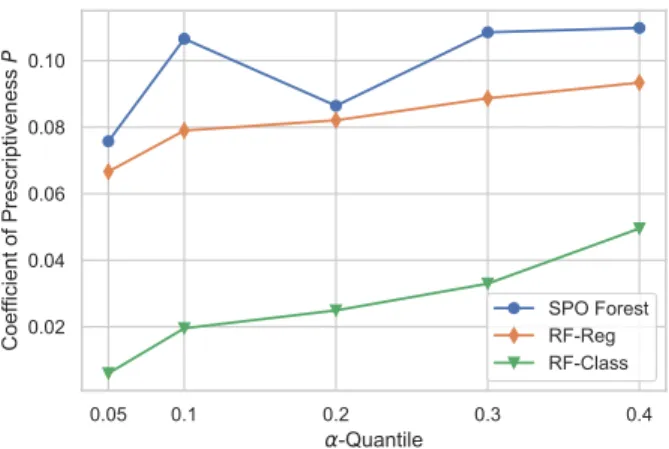
We further examine the relative efficacy of the prescribed decisions by estimating a modified version of the coefficient of prescriptiveness P [18]. For each model i and each value of risk-parameter a, we estimate the respective coefficient P as: Pi,a= 1 − b ρi,a− ρ∗a b ρEV − ρ∗a , (10) where ρ∗a is the revenue obtained by the deterministic
perfect-foresight strategy, i.e., assuming perfect knowledge of ψ, following the strategy prescribed in (7), andρbEV, the revenue
obtained by the EV strategy. Coefficient P is bounded above by 1 and can be interpreted as a measure of the relative ”distance”, defined strictly in terms of revenue, between the benchmark EV strategy and the theoretical maximum. Fig. 2 shows the evolution of P for the different forecasting models and different values of a (for a = 0.50, P = 1 in all cases). As expected, the SPO Forest model shows improved relative performance, followed by the RF-Reg model, with the difference being more pronounced for a = 0.10. The RF-Class model performs the worst overall. However, it should be noted that the coefficient P is generally low in all cases, with a maximum value of just over 0.10. This means that, even in the best case, the prescribed decisions are still relatively far from obtaining maximum revenue. This fact highlights the
Fig. 2. Estimated coefficient of prescriptiveness per risk level a
inherent difficulty in forecasting the imbalance penalty on the DA horizon, which in turn imposes practical limitations to exploiting the single price balancing mechanism for additional revenue.
V. CONCLUSIONS
In this work, we proposed a value-oriented forecasting ap-proach for prescribing optimal decisions for trading renewable energy. This involved training a forecasting model taking into consideration the subsequent optimization problem, using the SPO loss function to measure excess cost due to erroneous predictions.
We considered the case of a VPP generator offering energy in a DA market under a single price balancing mechanism and employed a profit maximization strategy constrained in the probability space. Ensembles of decision trees were trained to forecast the imbalance penalty by minimizing the SPO loss function and applying the Random Forest algorithm. In addition, we estimated the coefficient of prescriptiveness for the different models and evaluated relative performance against the benchmark and the perfect-foresight strategy. Over-all, results indicate that for a given trading strategy, using a forecasting model trained under the SPO loss function leads to better decision-making and improved performance, both in terms of revenue and risk. Moreover, the proposed approach offers an attractive alternative to the benchmark trading strategy. In future work, we aim at applying the proposed methodology in more complex case studies, such as jointly considering energy and market price forecasting, and assessing the impact of explanatory variables in trading performance.
ACKNOWLEDGMENT
The authors would like to thank HESPUL and ENGIE GREEN for contributing historical production data, Simon Camal for providing historical probabilistic forecasts and Panagiotis Andrianesis for his insightful comments.
REFERENCES
[1] W. B. Powell and S. Meisel, “Tutorial on stochastic optimization in energy—part i: Modeling and policies,” IEEE Transactions on Power Systems, vol. 31, no. 2, pp. 1459–1467, 2015.
[2] J. M. Morales, A. J. Conejo, H. Madsen, P. Pinson, and M. Zugno, Integrating renewables in electricity markets: operational problems. Springer Science & Business Media, 2013, vol. 205.
[3] A. N. Elmachtoub and P. Grigas, “Smart” predict, then optimize”,” arXiv preprint arXiv:1710.08005, 2017.
[4] G. Kariniotakis, Renewable Energy Forecasting: From Models to Appli-cations. Woodhead Publishing, 2017.
[5] R. Weron, “Electricity price forecasting: A review of the state-of-the-art with a look into the future,” International journal of forecasting, vol. 30, no. 4, pp. 1030–1081, 2014.
[6] T. J´onsson, P. Pinson, H. A. Nielsen, and H. Madsen, “Exponential smoothing approaches for prediction in real-time electricity markets,” Energies, vol. 7, no. 6, pp. 3710–3732, 2014.
[7] M. Olsson and L. Soder, “Modeling real-time balancing power market prices using combined sarima and markov processes,” IEEE Transac-tions on Power Systems, vol. 23, no. 2, pp. 443–450, 2008.
[8] J. Browell, “Risk constrained trading strategies for stochastic generation with a single-price balancing market,” Energies, vol. 11, no. 6, p. 1345, 2018.
[9] P. Pinson, C. Chevallier, and G. N. Kariniotakis, “Trading wind gen-eration from short-term probabilistic forecasts of wind power,” IEEE Transactions on Power Systems, vol. 22, no. 3, pp. 1148–1156, 2007. [10] C. J. Dent, J. W. Bialek, and B. F. Hobbs, “Opportunity cost bidding
by wind generators in forward markets: Analytical results,” IEEE Transactions on Power Systems, vol. 26, no. 3, pp. 1600–1608, 2011. [11] J. M. Morales, A. J. Conejo, and J. P´erez-Ruiz, “Short-term trading for
a wind power producer,” IEEE Transactions on Power Systems, vol. 25, no. 1, pp. 554–564, 2010.
[12] J. Liang, S. Grijalva, and R. G. Harley, “Increased wind revenue and system security by trading wind power in energy and regulation reserve markets,” IEEE Transactions on Sustainable Energy, vol. 2, no. 3, pp. 340–347, 2011.
[13] S. Camal, A. Michiorri, and G. Kariniotakis, “Optimal offer of automatic frequency restoration reserve from a combined pv/wind virtual power plant,” IEEE Transactions on Power Systems, vol. 33, no. 6, pp. 6155– 6170, 2018.
[14] ENTSO-E, “Survey on ancillary services procurement, balancing market design,” 2018.
[15] H. Zareipour, C. A. Canizares, and K. Bhattacharya, “Economic impact of electricity market price forecasting errors: A demand-side analysis,” IEEE Transactions on Power Systems, vol. 25, no. 1, pp. 254–262, 2009. [16] C. Kath and F. Ziel, “The value of forecasts: Quantifying the economic gains of accurate quarter-hourly electricity price forecasts,” Energy Economics, vol. 76, pp. 411–423, 2018.
[17] G.-Y. Ban and C. Rudin, “The big data newsvendor: Practical insights from machine learning,” Operations Research, vol. 67, no. 1, pp. 90– 108, 2019.
[18] D. Bertsimas and N. Kallus, “From predictive to prescriptive analytics,” Management Science, vol. 66, no. 3, pp. 1025–1044, 2020.
[19] M. A. Munoz, J. M. Morales, and S. Pineda, “Feature-driven improve-ment of renewable energy forecasting and trading,” IEEE Transactions on Power Systems, 2020.
[20] T. Carriere and G. Kariniotakis, “An Integrated Approach for Value-Oriented Energy Forecasting and Data-Driven Decision-Making Appli-cation to Renewable Energy Trading,” IEEE Transactions on Smart Grid, vol. 10, no. 6, pp. 6933–6944, 2019.
[21] A. N. Elmachtoub, J. C. N. Liang, and R. McNellis, “Decision trees for decision-making under the predict-then-optimize framework,” arXiv preprint arXiv:2003.00360, 2020.
[22] T. Hastie, R. Tibshirani, and J. Friedman, The elements of statistical learning: data mining, inference, and prediction. Springer Science & Business Media, 2009.
[23] L. Breiman, J. Friedman, C. J. Stone, and R. A. Olshen, Classification and regression trees. CRC press, 1984.
[24] L. Breiman, “Random forests,” Machine learning, vol. 45, no. 1, pp. 5–32, 2001.
[25] ENTSO-E. Transparency platform. [Online]. Available: https:// transparency.entsoe.eu/