HAL Id: inserm-02548889
https://www.hal.inserm.fr/inserm-02548889
Submitted on 21 Apr 2020
HAL is a multi-disciplinary open access
archive for the deposit and dissemination of
sci-entific research documents, whether they are
pub-lished or not. The documents may come from
teaching and research institutions in France or
abroad, or from public or private research centers.
L’archive ouverte pluridisciplinaire HAL, est
destinée au dépôt et à la diffusion de documents
scientifiques de niveau recherche, publiés ou non,
émanant des établissements d’enseignement et de
recherche français ou étrangers, des laboratoires
publics ou privés.
Dominant Intestinal Subset
Ahmed Abidi, Thomas Laurent, Gaëlle Bériou, Laurence Bouchet-Delbos,
Cynthia Fourgeux, Cédric Louvet, Raja Triki-Marrakchi, Jérémie Poschmann,
Régis Josien, Jerome Martin
To cite this version:
Ahmed Abidi, Thomas Laurent, Gaëlle Bériou, Laurence Bouchet-Delbos, Cynthia Fourgeux, et al..
Characterization of Rat ILCs Reveals ILC2 as the Dominant Intestinal Subset. Frontiers in
Immunol-ogy, Frontiers, 2020, 11, pp.255. �10.3389/fimmu.2020.00255�. �inserm-02548889�
Edited by: Marco Colonna, Washington University in St. Louis, United States Reviewed by: Cyril Seillet, Walter and Eliza Hall Institute of Medical Research, Australia Qi Yang, Albany Medical College, United States *Correspondence: Jeremie Poschmann jeremie.poschmann@univ-nantes.fr Régis Josien regis.josien@univ-nantes.fr Jérôme Martin jerome.martin@univ-nantes.fr
†These authors have contributed
equally to this work and share last authorship
Specialty section: This article was submitted to NK and Innate Lymphoid Cell Biology, a section of the journal Frontiers in Immunology Received: 13 August 2019 Accepted: 30 January 2020 Published: 19 February 2020 Citation: Abidi A, Laurent T, Bériou G, Bouchet-Delbos L, Fourgeux C, Louvet C, Triki-Marrakchi R, Poschmann J, Josien R and Martin J (2020) Characterization of Rat ILCs Reveals ILC2 as the Dominant Intestinal Subset. Front. Immunol. 11:255. doi: 10.3389/fimmu.2020.00255
Characterization of Rat ILCs Reveals
ILC2 as the Dominant Intestinal
Subset
Ahmed Abidi1,2, Thomas Laurent1, Gaëlle Bériou1, Laurence Bouchet-Delbos1, Cynthia Fourgeux1, Cédric Louvet1, Raja Triki-Marrakchi2, Jeremie Poschmann1*†, Régis Josien1,3* and Jérôme Martin1,3*†
1Université de Nantes, Inserm, CHU Nantes, Centre de Recherche en Transplantation et Immunologie, UMR 1064, ITUN,
Nantes, France,2Université de Tunis El Manar, Laboratoire de Génétique, Immunologie et Pathologies Humaines, Faculté
des Sciences de Tunis, Tunis, Tunisia,3CHU Nantes, Laboratoire d’Immunologie, Nantes, France
Innate lymphoid cells (ILCs) are tissue-resident lymphocytes that lack antigen-specific receptors and exhibit innate effector functions such as cytokine production that play an important role in immediate responses to pathogens especially at mucosal sites. Mouse and human ILC subsets have been extensively characterized in various tissues and in blood. In this study, we present the first characterization of ILCs and ILC subsets in rat gut and secondary lymphoid organs using flow cytometry and single cell RNA sequencing. Our results show that phenotype and function of rat ILC subsets are conserved as compared to human and mouse ILCs. However, and in contrast to human and mouse, our study unexpectedly revealed that ILC2 and not ILC3 was the dominant ILC subset in the rat intestinal lamina propria. ILC2 predominance in the gut was independent of rat strain, sex or housing facility. In contrast, ILC3 was the predominant ILC subset in mesenteric lymph nodes and Peyer patches. In conclusion, our study demonstrates that in spite of highly conserved phenotype and function between mice, rat and humans, the distribution of ILC subsets in the intestinal mucosa is dependent on the species likely in response to both genetic and environmental factors.
Keywords: innate lymphoid cells, rat, secondary lymphoid organs, intestine, ILC2
INTRODUCTION
Innate lymphoid cells (ILCs) are recombination-activating genes (RAGs)-independent lymphocytes that can be divided into three subsets, namely ILC1, ILC2, and ILC3, based on the cytokines they produce and the transcription factors (TFs) guiding their differentiation (1). ILCs are characterized by their capacity to respond rapidly to tissue damage and/or infection by producing sets of effector cytokines matching those of T helper cell subsets (2). T-bet+ ILC1
produce IFNγ in response to IL-12, IL-15, and IL-18 to promote the control of intracellular pathogens by macrophages (3). GATA-3+
ILC2 respond to IL-25, IL-33, and TSLP by producing key mediators of immune responses against helminths such as IL-5, IL-9, and IL-13 (4). Finally, RORγt+ILC3 respond to myeloid cell-derived IL-23 and IL-1β and produce IL-17 and/or IL-22,
which support epithelial defense mechanisms (5–7). ILC3 in tissues are further separated into at least two subsets: CCR6+ lymphoid tissue-inducer-like (LTi-like) ILC3 and natural cytotoxicity
receptors positive ILC3 (NCR+
ILC3) (8). A subset of regulatory ILCs (ILCreg), which produces IL-10 and TGF-β, has been described recently. These cells do not express FOXP3 and have been implicated in the resolution of inflammation during colitis (9).
ILCs are mostly found in lymphoid organs and barrier tissues such as skin, lungs, and gut, where the relative subset distribution is influenced by local micro-environmental cues (10, 11). Accordingly, human and mouse studies showed that while ILC2 are more abundant before microbial colonization in the fetal intestine (6), ILC3 dominate over ILC2 and ILC1 during adulthood. Indeed, mouse ILC3 respond rapidly to the commensal microbiota upon colonization (12) and early studies revealed that subsets such as NKp46+ ILC3 proliferate after
birth in the small intestine (13). Diet-derived metabolites such as retinoic acid also contribute to shape the intestinal ILC composition by supporting ILC3 development (14).
While ILCs have been the subject of extensive characterization in human and mouse tissues, almost no study has addressed ILC distribution and function in the rat. Recent evidence suggest that significant differences exist between rat and mouse microbiota composition that are associated with distinct cardinal features of their respective intestinal immune system, but whether it could include ILCs was not assessed (15, 16). The rat has been used as an animal model for physiology, pharmacology, toxicology, nutrition, behavior, immunology, and neoplasia for over 150 years (17,18). Because rats are frequently used by immunologists in pre-clinical models of metabolic diseases and inflammatory bowel diseases (IBD) (19–21), a better understanding of rat intestinal ILCs is thus of particular importance.
In this study, we used flow cytometry and scRNAseq to characterize ILC subsets and cytokine production in rat intestinal tissues and secondary lymphoid organs. We confirmed ILC3 as the main ILC population in secondary lymphoid organs. However, ILC2 unexpectedly dominated the ILC composition of both ileum and colon lamina propria. ILC2 enrichment in intestinal effector sites was not dependent on the rat strain thus revealing major species differences between rat and mouse intestinal ILC distribution.
MATERIALS AND METHODS
Rats
Ten to 14 weeks old female and male Sprague-Dawley (SPD), Lewis 1W (LEW) or Brown-Norway (BN) rats were used in this study. Animals were purchased from Centre d’Elevage Janvier (Le Genest-St Isle, France) or from our facility, and were kept under specific pathogen-free conditions. This study was conducted in accordance with the EU Directive 2010/63/EU for animal experiments, and the guidelines of the French Agriculture Ministry. This study was approved by the Veterinary Departmental Services committee (# E.44011).
Reagents
Cells were cultured in complete Roswell Park Memorial Institute (RPMI) 1640 Medium (Invitrogen, Carlsbad, CA) supplemented with Golgi Stop (BD sciences, Le Pont de Claix, France). For ILC1 stimulation, 50 ng/ml of rat rIL-12 (Cat# 1760-RL) from
Abbreviations:ILCs, Innate lymphoid cells; IL-22, Interleukin-22; TSLP, Thymic stromal lymphopoietin; MLN, mesenteric lymph nodes; PP, Peyer’s patches; LP, Lamina propria; SPD, Sprague Dawley; BN, Brown Norway.
R&D systems Europe (Lille, France) was used. For the ILC2 stimulation cocktail, human rTSLP, human rIL-33 and rat rIL-25 were purchased from Peprotech (Neuilly-sur-seine, France) and used at 50 ng/ml concentration. For ILC3 stimulation, 50 ng/ml of rat rIL-23 (Cat# 3136-RL) from R&D systems Europe (Lille, France), rat rIL-1β and human rTGFβ1 from Peprotech, human rIL-7 and 50 U/ml of human rIL-2 from Miltenyi Biotech (Paris, France), were used. PMA (Phorbol 12-myristate 13-acetate), Ionomycin, DNaseI, EDTA, SVF, Hank’s balanced salt solution (HBSS), Collagenase D and Collagenase II were purchased from Sigma-Aldrich (Saint-Louis, MI); all reagents indicated are at the final concentration of use.
Cell Isolation
Mesenteric Lymph Nodes Digestion Protocol
Mesenteric lymph nodes (MLN) were harvested, then dilacerated using 26G needles and digested in digestion solution containing RPMI 1640 Medium with 2 mg/ml of Collagenase D supplemented with 100 µg/ml of DNAseI for 30 min of shaking at 100 rpm and +37◦
C. Digestion was stopped 5 min before the end of cycle through the addition of Ethylenediaminetetraacetic acid (EDTA) (0.01 M). Cells were filtered on 100 µm cell strainer. Samples were centrifuged (10 min, 1,500 rpm, 4◦C)
and supernatant removed. MLN cells were resuspended in appropriate amount of FACS buffer containing 1X PBS supplemented with 2% FBS and 2% (0.1M) EDTA.
Peyer’s Patches Digestion Protocol
Peyer’s patches (PP) were first, washed in cold-PBS in a petri dish then transferred into 5 ml of solution 1 containing 1.5 mM DTT, 30 mM EDTA, and 1X PBS for 10 min incubation at 100 rpm +37◦
C. The suspension was then vortexed vigorously for 20 s and filtered through a 100 µm cell strainer. Then PPs were placed into 5 ml solution 2 (same as solution 1 but without DTT) and incubated in the same conditions. After washing, PPs were digested for 1 h in digestion solution at 100 rpm and +37◦C.
Finally, cells were filtered on 100 and 40 µm cells-strainers and suspended in FACS buffer.
Ileum and Colon Digestion Protocol
Ileum (without PP) and Colon were flushed with cold-PBS in petri dish after fat was removed. The tissues were opened longitudinally and cut into 0.5 cm pieces, then incubated once in 10 ml of solution 1 and twice with 10 ml solution 2 as described for PP to remove epithelial cells. Supernatant were discarded and the remaining tissues were digested twice in digestion solution for 30 min at 100 rpm and +37◦C in 50 ml Falcon tubes. Finally,
cells from the two digestions were pooled and filtered through a 100 and 40 µm cells-strainer and re-suspended in FACS buffer. Spleen Digestion Protocol
Spleen were digested in digestion solution for 30 min with slow shaking (50 rpm) at 37◦C in petri dish. Then, 0.01 M of EDTA
was added for the last 5 min to stop the digestion. Next, red blood cells were lysed at room temperature and cells were then filtered through a 100 µm cell strainer. Samples were centrifuged for 10 min, 1,500 rpm at 4◦C and resuspended in FACS buffer.
Lung Digestion Protocol
Lungs were cut into small fragments and digested in digestion solution for 30 min at 100 rpm and +37◦C in 50 ml Falcon tubes.
The remaining tissue fragments were smashed on 70 µm cell-strainer and washed with FACS buffer and centrifuged (10 min, 1,500 rpm, 4◦
C) and supernatant removed. Red blood cells were lysed at room temperature and cells were then filtered through a 70 µm cell strainer.
Adipose Tissue Digestion Protocol
Perigonadal and fat pads adipose tissues were used as representative visceral adipose tissue (VAT). Adipose tissues were finely dissected with a scalpel blade and digested in digestion solution containing RPMI 1640 Medium with 2 mg/ml of Collagenase II supplemented with 100 µg/ml of DNAseI for 30 min of shaking at 100 rpm and +37◦
C. Digestion tubes rested vertically 5 min at RT before discarding the upper phase containing remaining fat and adipocytes. The remaining digests were then filtered through 70 µm cell-strainers and centrifuged at 800 g for 15 min.
Flow Cytometry
Surface staining was realized with antibodies diluted in FACS buffer at 4◦
C for 30 min. First, cells were stained with a lineage antibody cocktail-FITC [TCRαβ (R7/3, in house), TCRγδ (V65, in house), CD11b/c (OX42, in house), CD172α (OX41, in house), Igκ (OX12, in house), and CD3ε (G4.18, BD Biosciences)]; CD4-PE.Cy7 (OX35, BD Biosciences), CD45-APC.Cy7 (OX1, BD Biosciences), MHC-II-PerCp (OX6, BD Biosciences), CD127-PE (R&D systems), and NKRP1-Pacific blue (3.2.3, in house). Staining of NKp46-Pacific blue (Wen23, in house) was performed at room temperature for 45 min. Cells were fixed and stained intracellularly using the Foxp3 Staining Buffer kit (eBioscience, catalog # 00-5523-00) according to the manufacturer’s instructions. For TFs staining, T-bet-APC (REA102), GATA-3-APC/Vio.Blue (REA174), and RORγt-APC (REA278) were purchased from Miltenyi Biotech (Paris, France). For cytokines detection, IFNγ-BB700 (DB1, BD Biosciences) IL-22-PerCp.Cy5.5 (Poly5164, BioLegend), IL-17A-APC (eBio17B7, eBioscience), and IL-13-APC (in house) mAb were used. For cell proliferation, Ki67-PE.Cy7 (B56, BD Biosciences) was used. Viability-Dye 506 was used to separate dead/live cells. Samples were run on the BD FACS Canto IITM (BD Biosciences) and
data collected using BD FACSDiva Software (BD biosciences). For cells sorting, MLN were negatively enriched in ILCs with the use of depleting Abs (TCRαβ, Igκ, CD8, and CD11b/c, all in house).
Real-Time Quantitative Reverse
Transcriptase-PCR
Total RNA was isolated from total tissue and sorted Lin−
CD127+ cells from MLN of SPD rats using Trizol reagent
(Invitrogen) according to the manufacturer’s instructions. Reverse transcription was performed using Murine Moloney Leukemia Virus Reverse Transcriptase (Invitrogen) following to the manufacturer’s instructions. Rag1 gene expression level was determined by relative quantitative RT-PCR using Taqman probe
(Thermo Fisher scientific) Rag1: Rn01484440_m1, reported to Hprt1: Rn01527840_m1 expression level. Taqman Fast advanced Master Mix 2X reagent mix was used (Applied Biosystem). RT-PCR was performed on the StepOne plus system (Applied Biosystem).
Single Cell RNAseq Preparation and
Analysis
scRNA-seq libraries were produced with the Chromium Single Cell 3′ Library and Gel Bead Kit v3 (10X Genomics, San
Francisco, CA). Libraries were then sequenced on a rapid run flowcell (75 bp) with an Illumina NextSeq 500.
FASTQ files were demultiplexed with CellRanger v3.0.1 (10X Genomics) and aligned on the Rnor_6.0 rat reference genome. Six thousand and four hundred and fifty six cells were recovered with CellRanger and their gene expression matrices were loaded on R 3.6.2. Single cells had an average of 69,331 mapped reads per cell with a median of 4,565 unique molecular identifiers (UMI) and a median of 1,513 detected genes per cell.
Genes expressed in <3 cells were excluded as well as cells that had <300 expressed genes or <500 total UMIs. To remove potential cell doublets we excluded cells with more than 2,000 genes and 6,500 UMIs. Additionally, only cells with <5% of mitochondrial genes were kept for downstream analysis. The resulting count matrix was processed with the Seurat R package (22). Gene expression of single cells was then log-normalized with a scale factor of 10,000 to normalize the gene expression by the total expression of the cell. The top 2,000 most variable genes were selected afterwards to perform a linear dimensional reduction by principal components analysis (PCA). The 10 first principal components (PC) were used to identify cell clusters.
Two clusters of cells were excluded from the downstream analysis, as these clusters expressed well-known B cell markers (Cd79a and Ms4a1) and were likely contaminating B cells (4% of total cells) retained throughout the sorting. Finally, five clusters of cells were kept and visualized with a UMAP (23), a non-linear dimensionality reduction technique. ILC populations were annotated based on known markers and differentially expressed genes between clusters. Differential expression analysis to identify cluster-specific genes was performed with the Wilcoxon rank sum test and the DESeq2 package. Expression profiles were analyzed using scDissector an exploratory application (courtesy of Dr. Ephraim Kenigsberg, Icahn School of Medicine at Mount Sinai, New York, NY) (24).
Statistical Analysis
Data collected were analyzed using Flow Jo software vX.6.7 (Treestar) and GraphPad Prism 6 (GraphPad Software, San Diego, CA). Significance was determined using the following non-parametric tests: Mann-Whitney test for comparison of two groups, and Tukey’s test for comparison of more than two groups with 2 way ANOVA.
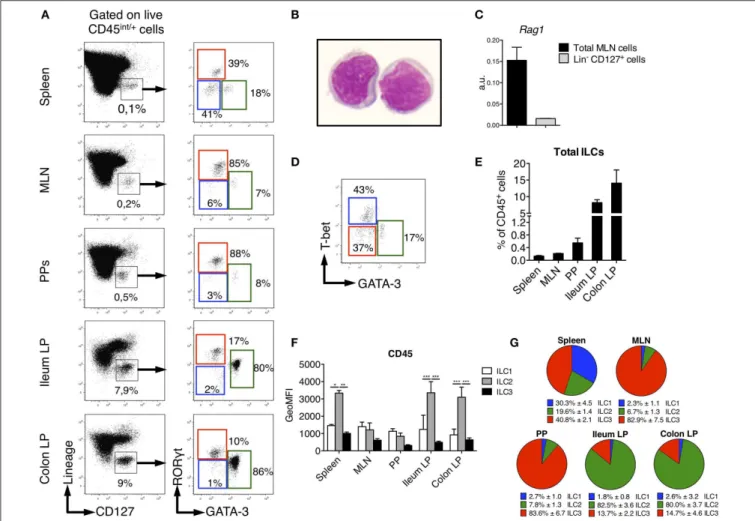
FIGURE 1 | Identification of ILC subsets in SPD Rats. To characterize ILC subsets in lymphoid and gut-associated tissues, cells were isolated from mesenteric lymph nodes (MLN), Peyer’s patches (PP), ileum and colon LP of SPD rats. (A) Representative flow cytometry plots showing the gating approach used to identify putative ILCs (Left panels) and ILC subsets (Right panels) on the basis of the expression of the transcription factors GATA-3 and RORγt in the depicted tissues.
(B) May-Grünwald-Giemsa staining (original magnification X100) of rat Lin−CD127+ILCs as gated in (A) that were sort-purified from MLN of SPD rats. (C) Rag1 gene
expression was assessed by qPCR on total MLN cells and sorted Lin−CD127+cells SPD rats (n = 3). (D) Representative flow cytometric plot showing T-bet vs.
GATA-3 expression in spleen ILC subsets from SPD rats. (E) Frequencies of total Lin−CD127+ILCs expressed as percentage of CD45+leukocytes in different
tissues from SPD rats. (n = 6). (F) CD45 mean fluorescence intensity (MFI) on ILC subsets from the depicted tissues from SPD rat. (G) Distribution of ILC subsets among total ILCs from SPD rats. n = 6 for each tissue. *p < 0.05, **p < 0.01, ***p < 0.001.
RESULTS
Distribution of Innate Lymphoid Cells in
Rat Spleen and Intestinal Tissues
We sought to identify ILCs in rat SLOs (secondary lymphoid organs) and intestinal tissues. To limit biased cell-type frequencies, we did not perform any enrichment gradient before analysis. We defined rat ILCs by staining cells with a cocktail of mAb specific for B, T, and myeloid cells and CD127, which is highly expressed by human and mouse ILCs (25, 26) (Figure 1A). We included a staining of intracellular CD3ε in the lineage cocktail to avoid any potential T cell contamination of the ILC gate (27,28). As in mice (29,30), NK cells in SLOs did not express CD127 (Supplementary Figure 1). After gating on CD45int/+ cells to exclude stromal and residual epithelial
cells, Lin− CD127+ cells were clearly identified in all tissues
analyzed (Figure 1A). May-Grünwald Giemsa staining of sorted Lin− CD127+ cells confirmed their lymphoid morphology
(Figure 1B). Almost no expression of recombination activating gene 1 (Rag1) was detected in Lin−
CD127+
cells as compared to total mesenteric lymph nodes (MLN) cells (Figure 1C). We assessed whether these candidate ILCs could be further separated based on their differential intracellular expression of the TFs GATA-3 and RORγt, which usually define human and mouse ILC2 and ILC3, respectively (31). In all tissues analyzed, we identified three populations of Lin− CD127+
as GATA-3− RORγt−, GATA-3+ RORγt−/low, and GATA-3−
RORγt+ cells, thus possibly corresponding to populations of
ILC1, ILC2, and ILC3 (Figure 1A). Additionally, staining of T-bet and GATA-3 in the spleen also defined three populations of T-bet+
GATA-3−
(ILC1), T-bet−
GATA-3+
(ILC2), and T-bet−
with the GATA-3/RORγt staining (Figure 1D). Of note, ILC2 expressed intermediate levels of RORγt in the gut lamina propria (LP), Peyer’s patches (PP) and MLN, but not in the spleen (Figure 1A). Because ILC1 were very rare and more loosely defined in intestinal tissues, we used the GATA-3/RORγt gating strategy to define ILC subsets in the rest of the study.
Rat ILCs were present at much higher frequency in the lamina propria of both ileum (9% of leukocytes) and colon (15%) as compared to spleen, PP and MLN (<1%) (Figure 1E). Consistent with human and mouse studies (32–35), rat ILC2 expressed higher levels of CD45 than ILC1 and ILC3 (Figure 1F). The relative enrichment of rat ILC subsets differed between the tissues analyzed, ILC3 being greatly enriched over ILC1 and ILC2 in MLN and PP, where they represented more than 80% of total ILCs. ILC3 were also the most abundant in spleen (40%) followed by ILC1 and ILC2 (Figure 1G). In sharp contrast, we observed an opposite distribution in ileum and colon LP where ILC2 largely dominated ILC composition (>80%), while ILC3 accounted for 15% of total ILCs and ILC1 were poorly represented.
Unbiased Characterization of Colonic ILCs
by Single-Cell RNA Sequencing
ILC2 predominance in rat ileum and colon was rather unexpected, as it contrasted with ILC proportions described in human and mouse gut (36, 37). Because of the paucity of validated surface markers available to describe further rat ILCs by flow cytometry, we decided to unbiasedly characterize FACS-sorted Lin−
CD127+
cells using high-resolution scRNAseq (Figure 2A). We focused on colonic cells because of the unexpected high prevalence of ILC2 and the higher frequency of ILC in the colon as compared to the ileum (Figure 1A). We analyzed 5,343 single cells that passed QC (see methods). Clustering analysis revealed 5 distinct clusters (C1–C5), which were visualized using uniform manifold approximation and projection (UMAP) (Figure 2B). Three well-demarcated groups of clusters were identified and, respectively, comprised clusters C1, C4, and C5 (72% of total cells), C2 (20% of total cells), and C3 (8% of total cells) (Figure 2B). Cells in clusters C1, C4, and C5 expressed high levels of important ILC2 genes including the TFs Gata3 and Bcl11b, as well as the receptors Il1rl1 (ST2) and Il17rb, and were thus annotated as ILC2 (38, 39) (Figure 2C). The C2 cluster contained cells expressing strong levels of genes well-characterized in ILC3 such as Nfil3, Tifa, Il23r, and the cytokine Il22. The high expression of the chemokine receptor CCR6 suggested colonic ILC3 were mostly LTi-like cells (40,
41) (Figure 2C and Supplementary Figure 2B). Finally, cells in cluster C3 expressed high levels of genes associated with NK cells such as Tyrobp (DAP12), Irf8, Nkg7, Fcer1g, Il2rb (CD122), Ccl5, Gzma, Gzmb, Gzmm, Prf1. Almost no cell in cluster C3 expressed the pan-ILC marker Il7r (CD127) (Figure 2C). No NK-specific mAb could be included in the lineage cocktail, and examination of CD127 expression confirmed the presence of contaminating CD127− cells in sorted cells (Figure 2A, right
panel). This suggested that NK cells in fact composed a large part of cluster C3. We thus chose to refer to these cells as group 1 ILCs to encompass both NK cells and rare ILC1 (Figure 2B
and Supplementary Figures 2A,B). Deeper analysis of ILC2 revealed additional transcriptomic heterogeneity between cells in the 3 clusters. Cells in cluster C4 mostly differed by their high expression of heat-shock protein encoding genes such as Dnajb1, Dnaja1, Hsph1, Hspd1, and Hspe1, while cells in cluster C5 expressed higher levels of Ramp1, Plek, S100a4, Tgfb1, Il18r1, Anxa1, and the cytokine Il5, suggesting a possible higher activation state (Supplementary Figure 2C). Taken together, these data confirmed that ILC2 dominated the rat ILC landscape in the colon and suggested that the rare cells identified as ILC1 by our flow cytometry analysis could account for a mixed population of NK cells and ILC1, at least in the colon.
Cytokine Production by Rat ILCs
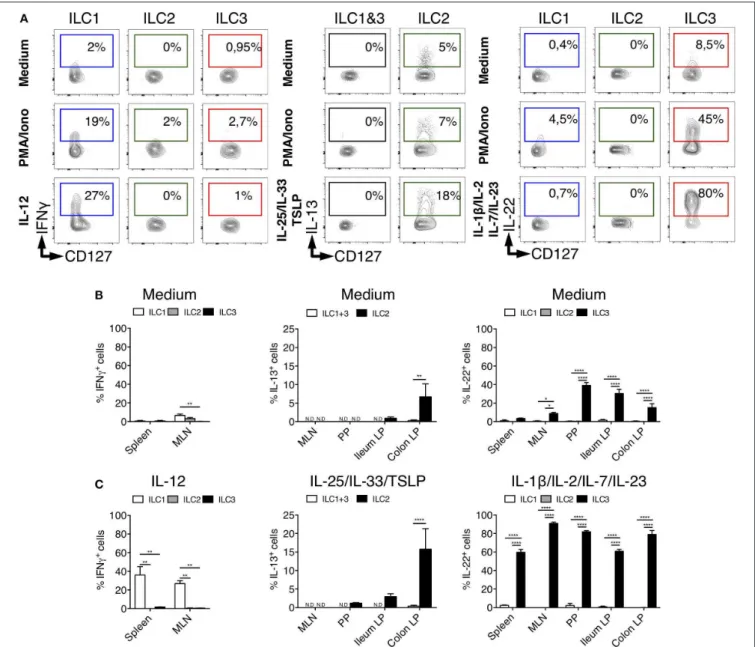
Human and mouse ILCs are characterized by their specialized production of cytokines, mimicking the profiles observed for CD4+ helper T cell subsets (42). To assess whether such a
functional specialization also existed for rat ILCs, we analyzed the production of ILC1, ILC2, and ILC3 archetypal cytokines. Because of their low frequency in intestinal tissues at steady state (Figure 1G), we limited our analysis of IFNγ production by ILC1 to the spleen and MLN. Upon activation by PMA and ionomycin, ILC1 (in spleen), ILC2 and ILC3 (in colon LP) selectively produced IFNγ, IL-13, and IL-22, respectively (Figure 3A), while little production of IL-17A was detected especially in colon LP (Supplementary Figures 2A, 3). Contrary to ILCs, however, LP CD4+T cells stimulated with the same conditions
strongly produced IL-17A (Supplementary Figure 3). Analysis of unstimulated cells also confirmed the selective production of IL-13 and IL-22 by ILC2 and ILC3, respectively (5, 43,
44) (Figure 3). Reminiscent of Il5 expression observed in a small subset of colonic ILC2 (Supplementary Figure 2A), the constitutive production of IL-13 was restricted to a small fraction of ILC2 in colon LP and to a lower extent ileum LP, while it was not detected in SLO (Figure 3B). The constitutive production of IL-22 by ILC3 was mostly detected in intestinal tissues (Figure 3B) and restricted to a small fraction of colonic ILC3 at the transcriptional level (Supplementary Figure 2A).
The production of cytokines by ILCs in tissues is mostly triggered by specific cytokines derived from myeloid, epithelial and stromal cells (45). As expected, IL-12 induced IFNγ only in ILC1 while IL-25, IL-33, and TSLP induced IL-13 production only in ILC2 (Figures 3A,C). Quite surprisingly, while cytokine stimulation induced IL-13 production by a fraction of ILC2 in the colon LP, and to a lower extent in the ileum LP, no induction was observed in ILC2 from MLN, suggesting potential distinct patterns of cytokine receptor expression between ILC2 in the LP and in SLO (Figure 3C). Finally, concordant with the selective expression of IL-23R and IL-1R by human and mouse ILC3 verified in our scRNAseq data (Supplementary Figure 2B), a cytokine cocktail containing IL-23 and IL-1β specifically induced a large majority of rat ILC3 from SLO and LP to produce IL-22 (Figures 3A,C).
Importantly, although rat ILC2 expressed low levels of RORγt in LP, MLN and PP, they did not produce 22 or IL-17A, even when stimulated with ILC3-stimulating cytokines (Supplementary Figure 3).
FIGURE 2 | scRNAseq reveals distinct clusters of ILCs from colon LP of rat. (A) FACS-sorting plots showing the sorted CD45+Lin−CD127+ILCs from the colon LP
of one SPD rat (left panel) and cells purity after sorting (right panel). (B) Uniform manifold approximation and projection (UMAP) visualizing clusters of colonic Lin−
CD127+cells analyzed by scRNAseq (n = 1 SPD rat). (C) Heatmap visualization color-coding the mRNA (UMI) counts per single cells (stacked rows) for selected
genes (columns). Visualized are randomly selected cells, which were downsampled to 2,000 UMIs/cell. Clusters are separated by gray bars and ordered by ILC subtype.
CD4, MHC-II, and NKp46 Identify Distinct
Rat ILC3 Subsets
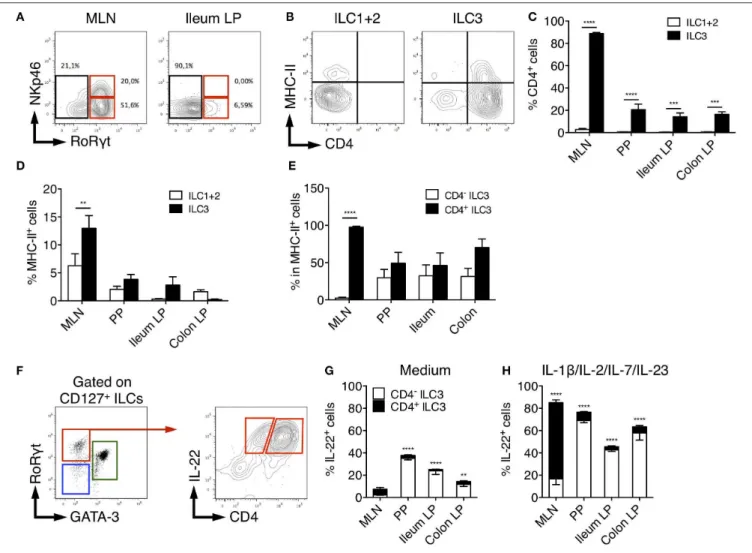
In adult mice, ILC3 can be separated in developmentally distinct NCR+ ILC3 and LTi-like ILC3 based on NKp46
expression (8). We therefore assessed NKp46 expression among rat ILCs in the different tissues. In MLN, a significant fraction (30%) of ILC3 expressed low levels of NKp46 consistent with previous studies (46). In agreement with our scRNAseq data suggesting that all colonic ILC3 were NKp46− CCR6+
LTi-like cells (Figure 2C and Supplementary Figure 2B), no NKp46 expression was detected in LP ILC3 (Figure 4A). Mouse LTi-like cells can also express CD4, at least in part (8). Accordingly, we detected CD4 expression in a subset of rat ILC3, but
not in ILC1 or ILC2 (Figures 4B,C). Concordant with mouse findings (46), the proportion of CD4+ LTi-like ILC3 was the
highest in MLN, where they constituted the majority of ILC3 (>80% of total ILC3), whereas CD4−ILC3 dominated the ILC3
composition (>70%) in PP, ileum, and colon LP (Figure 4C). MHC-II+murine RORγt+ILC3 have been recently proposed to
contribute to the establishment of gut microbiota tolerance by inducing antigen-specific CD4+
T cells apoptosis through the presentation of commensal bacteria-derived peptides (46, 47). Accordingly, a fraction of rat ILC3 expressed MHC-II and we also observed some MHC-II expression in the ILC1/ILC2 fraction (Figures 4B,D), likely due to the expression of MHC-II by ILC2 as previously reported in mice (48). Similar to mice, MHC-II
FIGURE 3 | Tissues quantification of cytokine production by ILC subsets in rats. (A) Representative intracellular staining for IFNγ (in spleen from LEW rats), IL-22 and IL-13 (in Colon LP from SPD rats) in ILC subsets as defined in Figure 1A after 4 h of culture in the absence (medium) or the presence of PMA/Ionomycin or IL-12, a cocktail of IL-25, IL-33, and TSLP or a cocktail of IL-1β, IL-2, IL-7, and IL-23. Flow cytometry quantification of cytokine-producing cells among ILC subset in the depicted tissues after 4 h of culture in the absence (B) or the presence (C) of indicated cytokine cocktails. Data are representative of 2 (PMA+ionomycin) to 6 (cytokines) independent experiments, numeric data represents means ± SEM, ND, not detected. *p < 0.05, **p < 0.01, ****p < 0.0001.
expression was restricted to the CD4+ population of LTi-like
ILC3 in rat MLN (46). However, this was not the case in PP, ileum and colon LP tissues in which MHC-II was detected in both CD4−
and CD4+
ILC3 (Figure 4E).
Finally, we compared the production of IL-22 between CD4+
and CD4− ILC3 (Figure 4F). Constitutive production of
IL-22 was mainly detected in CD4+ LTi-like ILC3 in MLN and
CD4− ILC3 in PP, ileum and colon LP (Figure 4G). In mice,
CD4+
ILC3 are considered the most mature LTi-like population and the dominant source of 22 in MLN in response to IL-23 (46) and Citrobacter rodentium infection (49, 50). Upon
stimulation by IL-23 together with IL-1β, IL-2, IL-7, rat CD4+
LTi-like cells were indeed the major producers of IL-22 in MLN. However, an opposite pattern was observed in PP, ileum and colon LP (Figure 4H).
Distribution and Function of ILCs in
Different Rat Strains
The observation that ILC2 was the dominant ileal and colonic LP ILC population in SPD rats was unexpected (Figures 1A,G). To assess whether this was a peculiarity of the SPD rat strain, we
FIGURE 4 | Characterization of rat ILC3 subsets. (A) Representative flow cytometry plots showing NKp46 and RORγt expression among total ILC cells isolated from the MLN and ileum LP of SPD rat (B) Representative flow cytometry plots showing CD4 and MHC-II expression by ILC1/2 and ILC3 cells isolated from the MLN of SPD rat. (C) The percentage of CD4+and (D) MHC-II+cells among ILC1/2 (white bars) or ILC3 (black bars) isolated from the indicated tissues of SPD rat. (E) The
percentage of MHC-II+cells amongst CD4−(white bars) and CD4+(black bars) ILC3 cells. (F) Representative flow cytometry plots showing the gating strategy to
identify CD4−and CD4+IL-22-producing cells among ILC3 isolated from the colon LP of SPD rat. (G) Frequencies of the CD4+and CD4−cells amongst IL-22
producing ILC3 after 4 h of culture in the absence (G) or the presence of the indicated stimulating cytokines (H). n = 6 per each tissue. **p < 0.01, ***p < 0.001, ****p < 0.0001.
extended our ILC analysis to Lewis (LEW) and Brown Norway (BN) (Supplementary Figure 4) rats, which are known to exhibit genetically-driven different Th cell response profiles (51). Higher frequencies of total ILCs in ileum and colon LP compared to SLO were verified for all strains (Figure 5A). Frequencies of total gut ILCs were slightly higher in SPD as compared to LEW and BN rats. In addition, strain-specific differences between ILC subset frequencies were also observed: ILC1 were enriched in SLO from LEW rats as compared to SPD and BN (Figure 5B); ILC2 were enriched in spleen and MLN of BN as compared to SPD and LEW rats (Figure 5C); SPD rats exhibited higher frequencies of ILC3 in MLN as compared to the two other strains (Figure 5D). Furthermore, in tissues known to harbor a majority of ILC2 such as lungs and adipose tissue (37,52), ILC subtype frequencies were similar between the different rat strains (Figure 5). In all three rat strains analyzed, ILC3 were thus predominant in SLOs while
ILC2 dominated the ILC pool in lungs, visceral adipose tissue (VAT), ileal and colonic LP.
We next compared IL-13 production by ILC2 in the three rat strains. With our stimulation cocktail (IL-25, IL-33, and TSLP), IL-13 production by ILC2 was extremely low in PP, and not detectable in MLN whatever the rat strain (Figures 6A,B). In the intestine, ileum ILC2 produced more IL-13 in BN rats than in LEW and SPD, whereas colonic ILC2 produced more IL-13 in SPD (Figures 3A,B, 6B). Taken together, these data suggest that even if ILC2 are largely and equally predominant in ileum and colon LP of all rat strains analyzed, their function exhibit strain and intestinal segment dependent differences.
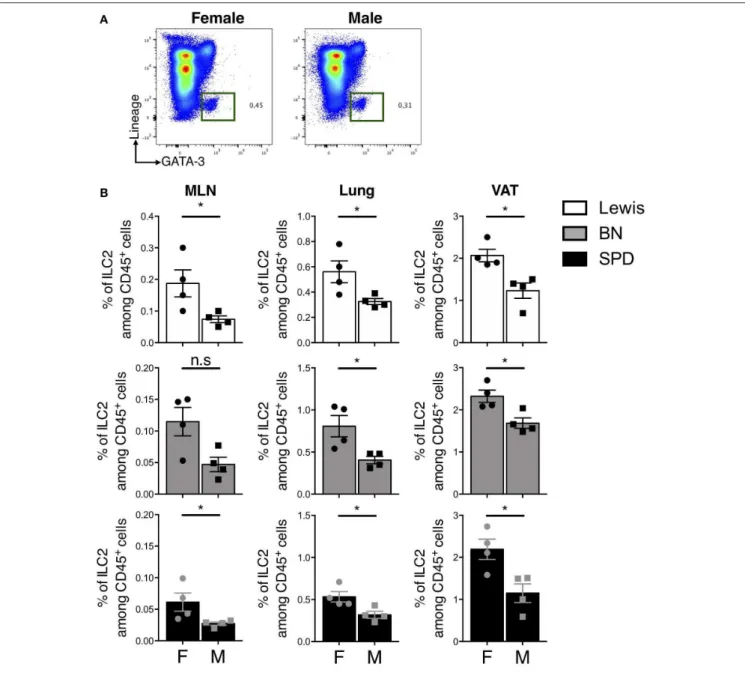
Sex-Dependent Frequencies of ILC2
Finally, we sought to determine whether sex-dependent differences of ILC2 frequencies previously reported in mice
FIGURE 5 | Tissue distribution of ILC populations between rat strains. (A) Frequencies of total Lin−CD127+ILCs expressed as percentage of CD45+leukocytes in
different tissues from LEW (white bars), BN (gray bars) and SPD (black bars) rats (B–D) Frequencies of ILC1 (B), ILC2 (C), and ILC3 (D) among total ILCs within each rat strain in different tissues. n = 6 per each tissue and rat strain except lung and VAT (n = 4). Numeric data represents means ± SEM, significance was determined at P < 0.05. *p < 0.05, **p < 0.01, ***p < 0.001, ****p < 0.0001.
FIGURE 6 | Comparison of ILC2-derived IL-13 production between rat strains. (A) The percentage of constitutive ILC2-derived IL-13 production in the indicated tissues of LEW (white bars), BN (gray bars) and SPD (black bars) rats and (B) after 4 h of stimulation with ILC2 specific cocktail. (n = 6) per each tissue and rat strain. Numeric data represents means ± SEM, significance was determined at P < 0.05. ***p < 0.001, ****p < 0.0001.
(53) also held true in rats. In line with previous results, the expression of androgen receptor (AR) was restricted to ILC2 in our scRNAseq data (Supplementary Figure 2B). Androgen signaling was shown to limit ILC2 proliferation in mouse males (53). We did not observe different frequencies of total ILCs and ILC2 between male and female rats in the gut (data not shown). However, higher frequencies of ILC2 were detected in MLN,
lungs and VAT of females as compared to males independently of the strain (Figures 7A,B).
DISCUSSION
In this study, we characterized ILC populations in rat intestinal tissues and SLO. We first confirmed that ILCs were strongly
FIGURE 7 | Sex-effect on ILC2 proportions in MLN, lung and VAT of rats. (A) Representative plots of Lin−GATA-3+(Pregated on live CD45+cells) ILC2 in the lung of
SPD female vs. male rats. (B) ILC2 frequencies in MLN, lung and visceral adipose tissues (VAT) of different rat strains. (n = 4), numeric data represents means ± SEM, statistical differences were determined by nonparametric Mann Whitney test with significance was determined. F, Female; M, Male. *p < 0.05, n.s, not significant.
enriched in rat ileal and colonic LP. Our study showed that ILC3 could be separated into NCR+
ILC3 and LTi-like ILC3, a fraction of which expressed CD4. Both subtypes were present in SLOs, where regardless of the strain, ILC3 were the dominant ILC population, while only LTi-like ILC3 were detected in the intestinal LP. The main producers of IL-22 were LTi-like ILC3 in MLN and CD4−
ILC3 in the intestine. As in mice and humans, rat ILC2 produced IL-13 constitutively and in response to stimulation by IL-25, IL-33, and TSLP. Interestingly and contrasting with previous data in mice and human (54), we identified ILC2 as the dominant ILC subset in rat ileal and colonic LP (37), a finding we confirmed and extended using unbiased scRNAseq profiling.
ILC2 are considered to be a homogeneous subset, yet differences in surface marker expression and tissue distribution have been recently reported (55). Several hypotheses can explain the distribution differences of intestinal ILCs between rats and mice. Since high frequencies of ILC2 were observed in the gut LP but not MLN and PP, this could reflect distinct responses to intestinal microbiota and/or food composition. In our study, ILC2 dominance in the rat intestine was observed regardless of animal’s origin (commercial vs. bred and maintained in our animal facility), thus excluding any bias due to variable microbiota or infection generated in our facility. A recent study from Locksley’s group actually showed that numbers of tissue ILC2 were preserved in germ-free mice, suggesting
that endogenous tissue- rather than microbiota-derived signals drive the maturation of ILC2, thus anticipating tissue-specific perturbations occurring later in life (56). However, it was shown that infection with the intestinal worm Nippostongylus brasiliensis triggers epithelial cells to release IL-25 and IL-33, which in turn cause ILC2 expansion in mice (57). Repeated injection of IL-25 in mice was shown to promote the expansion of so-called KLRG1high inflammatory ILC2 (iILC2) in lung, MLN, spleen
and liver (58). However, these iILC2 were virtually absent in untreated mice. Whether the strong enrichment of ILC2 in intestinal tissue in rats is dependent on IL-25 and IL-33 levels remains to be determined.
An interesting feature of rat ILC2 is their intermediate expression level of RORγt, mirroring those seen in mouse MLN and lungs after N. brasiliensis infection (48). Similar iILC2 could also be induced by injection of IL-25 and their low levels of RORγt expression was associated with their capacity to produce IL-17A in Th17 conditions (48). Such mixed ILC2/ILC3-like subsets producing IL-5, IL-17A as well IL-22 were also described in vivo in a model of skin inflammation induced by IL-23 in mice (59). In addition, ILC2 with ILC3-like features were recently described in human and appeared to be present in the blood of healthy volunteers (60). However, rat ILC2 from the colon LP and SLO did not produce IL-22 or IL-17 even when stimulated with a cytokine cocktail known to promote ILC3 activation, suggesting that LP ILC2 do not exhibit ILC3-like features. This absence of ILC3-like features in ILC2 was further confirmed by our scRNAseq profiling of total colon ILC. Whether prolonged stimulation of rat LP ILC2 with Th17 inducing cytokines could promote ILC3-related cytokine (60) remains to be addressed.
Regarding the opposite effect of micronutrient environment, a previous report indicated that a deficiency in retinoic acid (RA) severely diminished the frequency of ILC3 and paradoxically resulted in dramatic expansion of ILC2s in mice (14). However, such a deficiency is unlikely to explain ILC2 increased levels in rats as 1. rats were fed regular diet; 2. ILC3 were largely predominant in MLN and PP as previously shown in mice; 3. both ILC2 and ILC3 appeared to proliferate similarly in the ileal LP (Supplementary Figure 5).
We then speculated that differences between rats and mice or humans would be related to genetics. Different genetic backgrounds between rodent strains are known to affect immune cells frequencies, immune responses and further tissue localization (51). By assessing the tissue composition of ILC subsets in three rat strains, we revealed a specific distribution reflecting what was previously described for T cells. In fact, LEW and BN rats are known to harbor distinct immune response polarization in SLO. LEW rats are susceptible to Th1-mediated autoimmune diseases, while BN rats are highly susceptible to Th2-mediated autoimmune disease (51). Interestingly, we found that ILC1 were the major population of LEW rats ILCs, specifically in SLO. Likewise, spleen and MLN from BN rats contained high frequency of ILC2. These data suggest that the Th1 vs. Th2 prone feature of LEW vs. BN rat respectively, which is known to be genetically determined (61), might also relate to the relative abundance of ILC1 and ILC2 in these strains.
We also observed that spleen and MLN of SPD rats contained higher frequencies of ILC3 among total ILCs compared to LEW or BN rats. It is worth pointing out that this observation was consolidated by the fact that ILC3 subset in this strain produced higher IL-22 in the SLO compared to LEW and BN strains. Whether these differences are strain specific or related to the fact that SPD rats are outbred as compared to LEW and BN, remains to be determined. However, ILCs distribution could be more likely governed by rat specific microbial or environmental factors in the intestine as a large pre-dominance of the ILC2 population was observed in all strains.
By providing the first description of rat ILCs, including a deep transcriptomic characterization in the colon by scRNAseq, our study provides a useful resource for the community. Although ILCs appear remarkably conserved between species regarding their phenotype, function and differentiation, we suggest that relative abundance of ILC subsets at mucosal sites might differ between species likely in response to both genetic and environmental factors. Whether the enrichment of ILC2 in the gut LP of rats has an impact on immune responses to helminths, bacteria (62) or intestinal inflammation (63) deserves further investigations.
DATA AVAILABILITY STATEMENT
Raw sequencing reads of scRNA-seq data as well as UMI tables are available on the Gene Expression Omnibus under accession number GEO: GSE143920.
ETHICS STATEMENT
The animal study was reviewed and approved by EU Directive 2010/63/EU for animal experiments.
AUTHOR CONTRIBUTIONS
AA, JP, RJ, and JM designed the study. AA performed most of the experiments and graphed the data. TL performed scRNA-seq analysis. GB, LB-D, CF, and CL participated in experimental procedures. AA, GB, RT-M, JP, RJ, and JM analyzed the data and wrote the manuscript.
FUNDING
This work was realized in the context of IHU-CESTI project that received French government financial support managed by the National Research Agency (ANR). This work was also supported by the Région Pays de la Loire. AA was supported by a French-Tunisian PHU-UTIQUE grant from the 2015 Hubert Curien program (CMCU N◦15G0809).
SUPPLEMENTARY MATERIAL
The Supplementary Material for this article can be found online at: https://www.frontiersin.org/articles/10.3389/fimmu. 2020.00255/full#supplementary-material
REFERENCES
1. Hazenberg MD, Spits H. Human innate lymphoid cells. Blood. (2014) 124:700–9. doi: 10.1182/blood-2013-11-427781
2. Spits H, Cupedo T. Innate lymphoid cells: emerging insights in development, lineage relationships, and function. Annu Rev Immunol. (2012) 30:647–75. doi: 10.1146/annurev-immunol-020711-075053
3. Bernink JH, Peters CP, Munneke M, te Velde AA, Meijer SL, Weijer K, et al. Human type 1 innate lymphoid cells accumulate in inflamed mucosal tissues. Nat Immunol. (2013) 14:221–9. doi: 10.1038/ni.2534
4. Huang Y, Paul WE. Inflammatory group 2 innate lymphoid cells. Int Immunol. (2016) 28:23–8. doi: 10.1093/intimm/dxv044
5. Chen L, He Z, Slinger E, Bongers G, Lapenda TLS, Pacer ME, et al. IL-23 activates innate lymphoid cells to promote neonatal intestinal pathology. Mucosal Immunol. (2015) 8:390–402. doi: 10.1038/mi.2014.77
6. Montaldo E, Juelke K, Romagnani C. Group 3 innate lymphoid cells (ILC3s): origin, differentiation, and plasticity in humans and mice. Eur J Immunol. (2015) 45:2171–82. doi: 10.1002/eji.201545598
7. Kim CH, Hashimoto-Hill S, Kim M. Migration and tissue tropism of innate lymphoid cells. Trends Immunol. (2016) 37:68–79. doi: 10.1016/j.it. 2015.11.003
8. Melo-Gonzalez F, Hepworth MR. Functional and phenotypic heterogeneity of group 3 innate lymphoid cells. Immunology. (2017) 150:265–75. doi: 10.1111/imm.12697
9. Wang S, Xia P, Chen Y, Qu Y, Xiong Z, Ye B, et al. Regulatory innate lymphoid cells control innate intestinal inflammation. Cell. (2017) 171:201–16.e18. doi: 10.1016/j.cell.2017.07.027
10. Artis D, Spits H. The biology of innate lymphoid cells. Nature. (2015) 517:293– 301. doi: 10.1038/nature14189
11. Tomasello E, Bedoui S. Intestinal innate immune cells in gut homeostasis and immunosurveillance. Immunol Cell Biol. (2013) 91:201–3. doi: 10.1038/icb. 2012.85
12. Goverse G, Labao-Almeida C, Ferreira M, Molenaar R, Wahlen S, Konijn T, et al. Vitamin A controls the presence of RORγ+ innate lymphoid cells and lymphoid tissue in the small intestine. J Immunol. (2016) 196:5148–55. doi: 10.4049/jimmunol.1501106
13. Sawa S, Cherrier M, Lochner M, Satoh-Takayama N, Fehling HJ, Langa F, et al. Lineage relationship analysis of RORgammat+ innate lymphoid cells. Science. (2010) 330:665–9. doi: 10.1126/science.1194597
14. Spencer SP, Wilhelm C, Yang Q, Hall JA, Bouladoux N, Boyd A, et al. Adaptation of innate lymphoid cells to a micronutrient deficiency promotes type 2 barrier immunity. Science. (2014) 343:432–7. doi: 10.1126/ science.1247606
15. Nagpal R, Wang S, Solberg Woods LC, Seshie O, Chung ST, Shively CA, et al. Comparative microbiome signatures and short-chain fatty acids in mouse, rat, non-human primate, and human feces. Front Microbiol. (2018) 9:2897. doi: 10.3389/fmicb.2018.02897
16. Chung H, Pamp SJ, Hill JA, Surana NK, Edelman SM, Troy EB, et al. Gut immune maturation depends on colonization with a host-specific microbiota. Cell. (2012) 149:1578–93. doi: 10.1016/j.cell.2012.04.037
17. Jacob HJ. Functional genomics and rat models. Genome Res. (1999) 9:1013–6. doi: 10.1101/gr.9.11.1013
18. Aitman TJ, Critser JK, Cuppen E, Dominiczak A, Fernandez-Suarez XM, Flint J, et al. Progress and prospects in rat genetics: a community view. Nat Genet. (2008) 40:516–22. doi: 10.1038/ng.147
19. Hajj Hussein I-A, Tohme R, Barada K, Mostafa MH, Freund J-N, Jurjus RA, et al. Inflammatory bowel disease in rats: bacterial and chemical interaction. World J Gastroenterol. (2008) 14:4028–39. doi: 10.3748/wjg.14.4028 20. Aleixandre de Artiñano A, Miguel Castro M. Experimental rat models to
study the metabolic syndrome. Br J Nutr. (2009) 102:1246–53. doi: 10.1017/ S0007114509990729
21. Wong SK, Chin K-Y, Suhaimi FH, Fairus A, Ima-Nirwana S. Animal models of metabolic syndrome: a review. Nutr Metab. (2016) 13:65. doi: 10.1186/ s12986-016-0123-9
22. Stuart T, Butler A, Hoffman P, Hafemeister C, Papalexi E, Mauck WM, et al. Comprehensive Integration of Single-Cell Data. Cell. (2019) 177:1888– 902.e21. doi: 10.1016/j.cell.2019.05.031
23. Becht E, McInnes L, Healy J, Dutertre C-A, Kwok IWH, Ng LG, et al. Dimensionality reduction for visualizing single-cell data using UMAP. Nat Biotechnol. (2018) 37:38–44. doi: 10.1038/nbt.4314
24. Martin JC, Chang C, Boschetti G, Ungaro R, Giri M, Grout JA, et al. Single-cell analysis of Crohn’s disease lesions identifies a pathogenic Single-cellular module associated with resistance to anti-TNF therapy. Cell. (2019) 178:1493–508.e20. doi: 10.1016/j.cell.2019.08.008
25. Björklund ÅK, Forkel M, Picelli S, Konya V, Theorell J, Friberg D, et al. The heterogeneity of human CD127(+) innate lymphoid cells revealed by single-cell RNA sequencing. Nat Immunol. (2016) 17:451–60. doi: 10.1038/ni.3368 26. Cortez VS, Colonna M. Diversity and function of group 1 innate lymphoid
cells. Immunol Lett. (2016) 179:19–24. doi: 10.1016/j.imlet.2016.07.005 27. Borroto A, Lama J, Niedergang F, Dautry-Varsat A, Alarcón B, Alcover A.
The CD3 epsilon subunit of the TCR contains endocytosis signals. J Immunol. (1999) 163:25–31.
28. Martin-Blanco N, Jiménez Teja D, Bretones G, Borroto A, Caraballo M, Screpanti I, et al. CD3ε recruits numb to promote TCR degradation. Int Immunol. (2016) 28:127–37. doi: 10.1093/intimm/dxv060
29. Vosshenrich CAJ, García-Ojeda ME, Samson-Villéger SI, Pasqualetto V, Enault L, Richard-Le Goff O, et al. A thymic pathway of mouse natural killer cell development characterized by expression of GATA-3 and CD127. Nat Immunol. (2006) 7:1217–24. doi: 10.1038/ni1395
30. Allan DSJ, Cerdeira AS, Ranjan A, Kirkham CL, Aguilar OA, Tanaka M, et al. Transcriptome analysis reveals similarities between human blood CD3-CD56bright cells and mouse CD127+ innate lymphoid cells. Sci Rep. (2017) 7:3501. doi: 10.1038/s41598-017-03256-0
31. Colonna M. Innate lymphoid cells: diversity, plasticity, and unique functions in immunity. Immunity. (2018) 48:1104–17. doi: 10.1016/j.immuni. 2018.05.013
32. Mjösberg JM, Trifari S, Crellin NK, Peters CP, van Drunen CM, Piet B, et al. Human IL-25- and IL-33-responsive type 2 innate lymphoid cells are defined by expression of CRTH2 and CD161. Nat Immunol. (2011) 12:1055–62. doi: 10.1038/ni.2104
33. Walker JA, Barlow JL, McKenzie ANJ. Innate lymphoid cells–how did we miss them? Nat Rev Immunol. (2013) 13:75–87. doi: 10.1038/nri3349
34. Longman RS, Diehl GE, Victorio DA, Huh JR, Galan C, Miraldi ER, et al. CX3CR1+ mononuclear phagocytes support colitis-associated innate lymphoid cell production of IL-22. J Exp Med. (2014) 211:1571–83. doi: 10.1084/jem.20140678
35. Guo X, Qiu J, Tu T, Yang X, Deng L, Anders RA, et al. Induction of innate lymphoid cell-derived interleukin-22 by the transcription factor STAT3 mediates protection against intestinal infection. Immunity. (2014) 40:25–39. doi: 10.1016/j.immuni.2013.10.021
36. Simoni Y, Fehlings M, Kløverpris HN, McGovern N, Koo S-L, Loh CY, et al. Human innate lymphoid cell subsets possess tissue-type based heterogeneity in phenotype and frequency. Immunity. (2017) 46:148–61. doi: 10.1016/j.immuni.2016.11.005
37. Dutton EE, Camelo A, Sleeman M, Herbst R, Carlesso G, Belz GT, et al. Characterisation of innate lymphoid cell populations at different sites in mice with defective T cell immunity. Wellcome Open Res. (2017) 2:117. doi: 10.12688/wellcomeopenres.13199.1
38. Robinette ML, Fuchs A, Cortez VS, Lee JS, Wang Y, Durum SK, et al. Transcriptional programs define molecular characteristics of innate lymphoid cell classes and subsets. Nat Immunol. (2015) 16:306–17. doi: 10.1038/ni.3094 39. Califano D, Cho JJ, Uddin MN, Lorentsen KJ, Yang Q, Bhandoola A, et al. Transcription factor Bcl11b controls identity and function of mature type 2 innate lymphoid cells. Immunity. (2015) 43:354–68. doi: 10.1016/j.immuni.2015.07.005
40. Withers DR, Hepworth MR. Group 3 innate lymphoid cells: communications hubs of the intestinal immune system. Front Immunol. (2017) 8:1298. doi: 10.3389/fimmu.2017.01298
41. Penny HA, Hodge SH, Hepworth MR. Orchestration of intestinal homeostasis and tolerance by group 3 innate lymphoid cells. Semin Immunopathol. (2018) 40:357–70. doi: 10.1007/s00281-018-0687-8
42. Vivier E, Artis D, Colonna M, Diefenbach A, Di Santo JP, Eberl G, et al. Innate lymphoid cells: 10 years on. Cell. (2018) 174:1054–66. doi: 10.1016/j.cell.2018.07.017
43. Cella M, Fuchs A, Vermi W, Facchetti F, Otero K, Lennerz JKM, et al. A human natural killer cell subset provides an innate source of IL-22 for mucosal immunity. Nature. (2009) 457:722–5. doi: 10.1038/nature07537
44. Fallon PG, Ballantyne SJ, Mangan NE, Barlow JL, Dasvarma A, Hewett DR, et al. Identification of an interleukin (IL)-25-dependent cell population that provides IL-4, IL-5, and IL-13 at the onset of helminth expulsion. J Exp Med. (2006) 203:1105–16. doi: 10.1084/jem.20051615
45. Mortha A, Burrows K. Cytokine networks between innate lymphoid cells and myeloid cells. Front Immunol. (2018) 9:191. doi: 10.3389/fimmu.2018.00191 46. Mackley EC, Houston S, Marriott CL, Halford EE, Lucas B, Cerovic
V, et al. CCR7-dependent trafficking of RORγ+ ILCs creates a unique microenvironment within mucosal draining lymph nodes. Nat Commun. (2015) 6:5862. doi: 10.1038/ncomms6862
47. Hepworth MR, Fung TC, Masur SH, Kelsen JR, McConnell FM, Dubrot J, et al. Immune tolerance. Group 3 innate lymphoid cells mediate intestinal selection of commensal bacteria-specific CD4+ T cells. Science. (2015) 348:1031–5. doi: 10.1126/science.aaa4812
48. Oliphant CJ, Hwang YY, Walker JA, Salimi M, Wong SH, Brewer JM, et al. MHCII-mediated dialog between group 2 innate lymphoid cells and CD4(+) T cells potentiates type 2 immunity and promotes parasitic helminth expulsion. Immunity. (2014) 41:283–95. doi: 10.1016/j.immuni.2014.06.016 49. Zhong C, Zheng M, Zhu J. Lymphoid tissue inducer-A divergent member of
the ILC family. Cytokine Growth Factor Rev. (2018) 42:5–12. doi: 10.1016/ j.cytogfr.2018.02.004
50. Sonnenberg GF, Monticelli LA, Elloso MM, Fouser LA, Artis D. CD4(+) lymphoid tissue-inducer cells promote innate immunity in the gut. Immunity. (2011) 34:122–34. doi: 10.1016/j.immuni.2010.12.009
51. Fournié GJ, Cautain B, Xystrakis E, Damoiseaux J, Mas M, Lagrange D, et al. Cellular and genetic factors involved in the difference between Brown Norway and Lewis rats to develop respectively type-2 and type-1 immune-mediated diseases. Immunol Rev. (2001) 184:145–60. doi: 10.1034/ j.1600-065x.2001.1840114.x
52. Bénézech C, Jackson-Jones LH. ILC2 orchestration of local immune function in adipose tissue. Front Immunol. (2019) 10:171. doi: 10.3389/ fimmu.2019.00171
53. Laffont S, Blanquart E, Savignac M, Cénac C, Laverny G, Metzger D, et al. Androgen signaling negatively controls group 2 innate lymphoid cells. J Exp Med. (2017) 214:1581–92. doi: 10.1084/jem.20161807
54. Krämer B, Goeser F, Lutz P, Glässner A, Boesecke C, Schwarze-Zander C, et al. Compartment-specific distribution of human intestinal innate lymphoid cells is altered in HIV patients under effective therapy. PLoS Pathog. (2017) 13:e1006373. doi: 10.1371/journal.ppat.1006373
55. Neill DR, Wong SH, Bellosi A, Flynn RJ, Daly M, Langford TKA, et al. Nuocytes represent a new innate effector leukocyte that mediates type-2 immunity. Nature. (2010) 464:1367–70. doi: 10.1038/nature08900
56. Ricardo-Gonzalez RR, Van Dyken SJ, Schneider C, Lee J, Nussbaum JC, Liang H-E, et al. Tissue signals imprint ILC2 identity with anticipatory function. Nat Immunol. (2018) 19:1093–99. doi: 10.1038/s41590-018-0201-4
57. Licona-Limón P, Kim LK, Palm NW, Flavell RA. TH2, allergy and group 2 innate lymphoid cells. Nat Immunol. (2013) 14:536–42. doi: 10.1038/ni.2617 58. Huang Y, Guo L, Qiu J, Chen X, Hu-Li J, Siebenlist U, et al. IL-25-responsive,
lineage-negative KLRG1(hi) cells are multipotential “inflammatory” type 2 innate lymphoid cells. Nat Immunol. (2015) 16:161–9. doi: 10.1038/ni.3078 59. Bielecki P, Riesenfeld SJ, Kowalczyk MS, Vesely MCA, Kroehling L, Yaghoubi
P, et al. Skin inflammation driven by differentiation of quiescent tissue-resident ILCs into a spectrum of pathogenic effectors. bioRxiv. (2018) 461228. doi: 10.1101/461228
60. Bernink JH, Ohne Y, Teunissen MBM, Wang J, Wu J, Krabbendam L, et al. c-Kit-positive ILC2s exhibit an ILC3-like signature that may contribute to IL-17-mediated pathologies. Nat Immunol. (2019) 20:992–1003. doi: 10.1038/s41590-019-0423-0
61. Mathieson PW, Thiru S, Oliveira DB. Regulatory role of OX22high T cells in mercury-induced autoimmunity in the brown Norway rat. J Exp Med. (1993) 177:1309–16. doi: 10.1084/jem.177.5.1309
62. Frisbee AL, Saleh MM, Young MK, Leslie JL, Simpson ME, Abhyankar MM, et al. IL-33 drives group 2 innate lymphoid cell-mediated protection during Clostridium difficile infection. Nat Commun. (2019) 10:2712. doi: 10.1038/s41467-019-10733-9
63. Camelo A, Barlow JL, Drynan LF, Neill DR, Ballantyne SJ, Wong SH, et al. Blocking IL-25 signalling protects against gut inflammation in a type-2 model of colitis by suppressing nuocyte and NKT derived IL-13. J Gastroenterol. (2012) 47:1198–211. doi: 10.1007/s00535-012-0591-2
Conflict of Interest:The authors declare that the research was conducted in the absence of any commercial or financial relationships that could be construed as a potential conflict of interest.
Copyright © 2020 Abidi, Laurent, Bériou, Bouchet-Delbos, Fourgeux, Louvet, Triki-Marrakchi, Poschmann, Josien and Martin. This is an open-access article distributed under the terms of the Creative Commons Attribution License (CC BY). The use, distribution or reproduction in other forums is permitted, provided the original author(s) and the copyright owner(s) are credited and that the original publication in this journal is cited, in accordance with accepted academic practice. No use, distribution or reproduction is permitted which does not comply with these terms.