HAL Id: hal-01421739
https://hal.archives-ouvertes.fr/hal-01421739
Submitted on 17 Mar 2020
HAL is a multi-disciplinary open access
archive for the deposit and dissemination of
sci-entific research documents, whether they are
pub-lished or not. The documents may come from
teaching and research institutions in France or
abroad, or from public or private research centers.
L’archive ouverte pluridisciplinaire HAL, est
destinée au dépôt et à la diffusion de documents
scientifiques de niveau recherche, publiés ou non,
émanant des établissements d’enseignement et de
recherche français ou étrangers, des laboratoires
publics ou privés.
Virtual synchronous generators dynamic performances
Raouia Aouini, Khadija Ben Kilani, Bogdan Marinescu, Mohamed Elleuch
To cite this version:
Raouia Aouini, Khadija Ben Kilani, Bogdan Marinescu, Mohamed Elleuch. Virtual synchronous
generators dynamic performances. Electrical Sciences and Technologies in Maghreb (CISTEM), 2014
International Conference on, Aug 2014, Tunis, Tunisia. pp.1 - 6, �10.1109/CISTEM.2014.7077025�.
�hal-01421739�
Virtual Synchronous Generators dynamic
performances
Raouia AOUINI1, Khadija BEN KILANI1, Bogdan MARINESCU2, Mohamed ELLEUCH1
1Université de Tunis El Manar, ENIT, L.S.E.-, LR 11 ES 15, BP 37-1002, Tunis le Belvédère, Tunisie, 2
ENS-Cachan SATIE 61 Avenue du Président Wilson 94235 Cachan Cedex, France Email: aaouinii @yahoo.com, [email protected], [email protected],
Abstract--In this paper, dynamic performances of virtual synchronous generator are investigated. The virtual synchronous generator is based on the synchronverter (VSG) concept which is an inverter that mimics a synchronous generator (SG). The real and reactive power delivered by VSGs connected in parallel and operated as generators can be automatically shared using the well-known frequency and voltage drooping mechanisms. The VSG method is tested in comparison with the standard SG of the same parameters and capacity on a two bus test network. A comparative assessment is presented in terms of local performances and the fault critical clearing time (CCT). The results indicate good local performances and the contribution of the synchronverter to enhance the stability margin of the neighbouring AC zone.
Keywords— synchronverter, synchronous generator,
frequency/voltage drooping.
I. INTRODUCTION
OR economic, technical and environmental reasons, more renewable energy sources are being connected to power systems, generally via power electronic converters. The International Energy Agency (IEA) predicts that gross renewable electricity output will continue to pick up speed in the medium term to 2018, rising by approximately 40% and forecasts installed renewable capacity increasing from 1 580 GW in 2012 to 2 350 GW in 2018 [1]. Consequently, the AC/DC/AC converted power injected into AC networks has been increased. This means that more and more inverters will be connected to the grid and will eventually dominate power generation. When focusing eyes on system stability analysis, compared with traditional transmission network; one of the most features for renewable energy sources is the randomness output active and reactive power supplied to AC grids. Thus, as inverters are used to interface with grid, inverters dynamic behavior has important influences on system performance. Since inverter’s corresponding part in transmission networks, synchronous generator SG is also an energy transforming devices. Thus it’s natural to mimic SG character when designing inverter controller.
Generally, inverter controller can be divided into three types. The first one is called constant-PQ controller which controls inverter output active and reactive power as given values.
The controller is based on a current-controlled voltage source converter (CC-VSC), to inject the required real and reactive powers via current control [2]. The second is to mimic SG external characteristic and called droop controller. When system frequency or node voltage amplitude is out of its normal range, this type of inverter will automatically adjust its output active or reactive power, and try to control these electrical qualities back into normal ranges [3]. The last type is to mimic SG characteristics directly and called synchronverter [4], or virtual synchronous generator [5, 6]. Since the operation of AC systems via SGs voltage/frequency regulation is rather well known [7], the synchronverter concept led to new applications. For example, in [8], a STATCOM controller is synthesized from the mathematical model of synchronous generators operated in a compensator mode.
In this paper, we investigate the transient stability of a two-bus power system, considering two configurations of coupling system: coupling of AC-AC system and hybrid DC-AC system. For each configuration, local performances are studied and transient stability of the systems is assessed in terms of the CCT. The VSG parameters are adapted to the conventional SG parameters. Static and dynamic responses of the VSG and the SG are compared under different operating conditions. The VSG benefits its operation frequency and voltage drooping mechanisms for load sharing. It is shown that local performances obtained by VSG are better than the ones of SG. The transient stability margin is improved with the VSG, compared to the SG. Moreover, it is not necessary to have a large inertia as for a physical SG, where a larger inertia means that more energy is stored mechanically. A small inertia is good for overall grid stability.
The rest of the paper is organized as follows: in Section II, the synchronverter concept is briefly overviewed. Test power systems are presented in Section III, where different tests validations are presented in Section IV.
II. OVERVIEW OF THE SYNCHRONVERTER CONCEPT
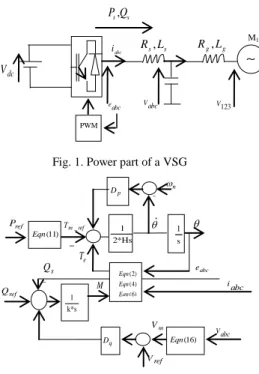
A synchronverter VSG is an inverter of which regulations are chosen such that the resulting closed-loop mimics the behavior of a conventional SG. The VSG concept consists of a power part, as shown in Fig. 1, and an electronic part, i.e., the controller, as shown in Fig. 2. It is assumed that the DC bus of the synchronverter is constant.
An inverter plus an LC filter is the power part of the VSG as shown in Fig. 1. VSC inverter technologies shown in Fig. 1 are used. The overall structure is shown to be equivalent to a SG with capacitor bank connected in parallel with the stator terminal [4]. The phase terminal voltage Vabc = [Va Vb Vc] T
is
abc abc s abc s abc
di
V R i L e
dt
, (1) where iabc = [ia ib ic] T is the vector of the stator phase
currents, Ls, Rs are, respectively, the inductance and the
resistance of the stator windings and eabc = [ea eb ec] T is the
back emf. The controller includes the mathematical model of a three-phase round-rotor synchronous machine described by 2H Tm TeDp, (2) , e abc T M i sin, (3) sin abc e Ms , (4) , s abc P Msi sin, (5) ,cos s abc Q Msi . (6) where
Tm is the mechanical torque applied to the rotor,
Te is the electromagnetic torque,
e are the three-phase generated voltage, is the rotor angle,
s=d/dt is the derivation operator,
P and Q are the active and the reactive power, respectively, H is the inertia constant of all the parts rotating with the rotor, M is the field excitation,
is the angular speed of the machine and also the frequency of the control signal eabc sent to the pulse width modulation
(PWM) generator,
iabc is the stator current vector flowing out of the machine,
The equations of sin and cos are defined as
2 2
sin sin sin( - ) sin( + )
3 3 T , 2 2
cos cos cos( - ) cos( + )
3 3
T
.
The operator .,.denotes the conventional inner product in 3.
The electronic part controls the switches in the power part. These two parts interact via the signals eabc and iabc.
The VSG given in Fig. 1 is connected to the grid via the impedance (Lg, Rg) such that
123 1 ( ) abc abc f V i i C s , (7) 123 123 1 ( ) ( g g ) abc i V V R L s . (8)
To mimic the droop of the SG and to operate the VSG in a useful way, a controller that generates Tm and M is needed
such that system stability is maintained and the desired values of real and reactive power are followed. Thus, the VSG operations are discussed.
Fig. 1. Power part of a VSG
Fig. 2. Electronic part of a VSG [4]
A. Frequency drooping and regulation of real power
The static frequency droop control loop is proposed where
_ ( )
m m ref p n
T T D
s
. (9) Thus, VSG shares load with the other generators of the AC grid to which its is connected in proportion, with the static droop coefficient Dp. Typical values for the frequency droopare a 100% increase in power for a frequency decrease between 3% and 5% (from nominal values). In (10), Tm_ref is
the mechanical torque applied to the rotor and obtained from the set point (or reference value) of the real power Pref by
dividing it with the nominal mechanical speedn, as shown in Fig. 2. _ ref m ref n P T . (10) The transfer function of the frequency regulation is:
1 / 1 2 1 p m e p f D T T Hs D s . (11)
The frequency loop time constant is: 2 * f p H D
. (12) The choice of τf determines the dynamic response of the loop.It is proportional to the moment of inertia H. A large τf is
equivalent to having a large H, which makes the control less sensitive to the variations in the grid frequency and the system more stable. However, the response is slow. A small τf is
equivalent to having a small H, which leads to fast frequency tracking. dc V e abc , s s P Q abc i M1 123 V PWM , s s R L R Lg, g Vabc ref V ref P M iabc e T 1 2*Hs p D (2) (4) (6) Eqn Eqn Eqn 1 k*s _ m ref T (11) Eqn 1 s m V q D Eqn(16) abc e ref Q s Q n Vabc
B. Voltage drooping and regulation of reactive power
The reactive power Qs is controlled by a voltage droop
control loop using a voltage droop coefficient Dq, in order to
regulate the field as
1 ( m s) M Q Q ks , (13) ref ( ref ) m q m Q Q D V V , (14) where Vm is the output voltage amplitude computed by using a
phase locked loop. Another elementary method is as follows: Assume that VaVmsina, VbVmsinband VcVmsinc, then
(sin sin sin sin sin sin )
a b b c c a m a b b c c a
V V V V V V V
²
(cos( ) cos( ) cos( ))
2 m a b b c c a V (15) ²
(cos( ) cos( ) cos( ))
2 m a b b c c a V .
When the terminal voltages are balanced, i.e, when
2 2
3 3
c a b
, then the last term above is zero and we obtain 2 3( m a b a c b c V V V V V V V . (16) The time constant of the voltage loop is proportional to
* v n q k D
.
(17) Hence the choice of τvaffects the dynamic response of the
amplitude tracking.
III. THE TEST POWER SYSTEM
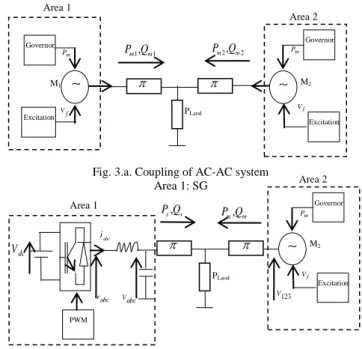
The proposed test systems consist of two finite control areas are designed as Area 1, Area 2 feeding a common area load via AC lines, as illustrated in Fig. 3. Two cases are considered:
- Case 1: Area 1 is a SG equipped with a standard power frequency and voltage reactive power controls.
- Case 2: Area 1 is a VSG emulating a SG, modeled by (1)-(16).
The AC systems are chosen to have identical AC generator, with nominal voltage, short-circuit powers and frequency and given by V = 100 kV, Scc = 200 MVA, f = 50 Hz.
For the VSG parameters, they are firstly adapted to match standard SG parameters [7], [9]: a 5% governor droop, an inertia constant H=3.2 s and a voltage regulation gain of 3%.
IV. SIMULATION RESULTS
The main advantage of the VSGs is to put into evidence the structure of classic SGs for which the controls are well known. The VSG operations are verified in a test power shown in Fig.3.b. Dynamic and transient performances of VSG are compared with SG of same capacity for different faults.
A. Response of VSG vs SG A.1 Load share of the VSG
An important mechanism for VSGs and SGs for evenly sharing load (in proportion to their nominal load) is to vary the
Fig. 3.a. Coupling of AC-AC system Area 1: SG
Fig. 3.b. Coupling of DC-AC system Area 1: VSG
real power delivered to the grid according to the grid frequency. The VSG and the SG coupled via an AC lines as shown in Fig. 3.b are set in a parallel arrangement and are initially at nominal frequency f0 =1.007 p.u with power
outputs, respectively, Ps=0.36 p.u and Pm=0.12 p.u given in
Table I. When an active load increase PL 0.13 .p u, at t=10 s,
causes the units to slow down, the governors increase output until they reach a new common operating frequency f’. The system responses are shown in Fig. 4 and 5. The frequency of the SG followed the VSG frequency, and the real and reactive power tracked their set points. The amount of load picked up by each unit depends on the droop characteristic such that
0 ' L s m P f f f D D . (18) The VSG and the SG increased their real power output by 0.064 p.u that is 6.5% of the power rating
' * s s s s P P P f D , (19) ' * m m m m P P P f D . (20) The amount of load increase, correspond to a 0.32 % drop of the frequency. The load share of the VSG and the SG are
summarized in Table. I. Hence, s s m m
P D P D
, where Ds and Dm
are , respectively, the static droop of VSG and SG, which are equal to 1/5% . When a sudden change in load occurred, at t= 10 s, as shown in Fig. 5, the reactive power dropped by about 0.042 p.u because the local terminal voltage Vabc was about
0.1 % higher than the nominal value, which depends on the droop characteristic 1 1.0012 0.04 . 0.03 q V Q p u D . (21) 1, 1 m m P Q M1 PLaod 2, 2 m m P Q Governor Excitation V f m P M2 Governor Excitation m P f V Area 1 Area 2 eabc , s s P Q dc V abc i 123 V PWM Vabc PLaod , m m P Q M2 Governor Excitation m P f V Area 1 Area 2
Table I: Load sharing
Fig. 4. Responses of the SG in case 2
Fig. 5. Responses of the VSG in case 2 A.2 Local performances of VSG and equivalent SG
To test local performances, a +0.15 p.u step is applied to the reference of the active power and a +0.1 p.u step is applied to the reference of the voltage of the VSG at t=10 s. Fig. 6 shows the responses of active powers and speeds responses of the VSG and the SG. It can be noted that the VSG speed attaint the steady state faster than the SG speed. Fig. 7 shows the responses of reactive powers and voltages responses of the VSG and the SG. It can be observed that better dynamic responses with the VSG concept are obtained, e.g. more damped dynamics oscillations and fast responses are attained with VSG. We note that the overshoot in the voltage response is of limited magnitude.
A.3 Transient stability
The robustness of the VSG is evaluated by assessing the transient stability of the whole test power system, following severe fault. The latter is quantified by the Critical Clearing Time (CCT), which is the maximum time duration that a short- circuit may act without losing the system capacity to recover to a steady-state stable operation. To evaluate the CCT, a three phase short-circuit fault was simulated near the load. According to this study, the fault critical clearing time for case 1 (AC-AC) estimated at CCTAC-AC = 230 ms is less
than for a mixed system case 2 (DC-AC) with a CCTDC -AC =
350 ms. 0 10 20 30 40 50 60 70 80 90 100 0.05 0.1 0.15 0.2
Active power of SG [p.u]
0 10 20 30 40 50 60 70 80 90 100 0.995 1 1.005 1.01 1.015 1.02 Speed of SG [p.u] 0 10 20 30 40 50 60 70 80 90 100 0.995 1 1.005 1.01 1.015 1.02 Speed of SV [p.u] 0 10 20 30 40 50 60 70 80 90 0 0.1 0.2 0.3 0.4 0.5 0.6 0.7 0.8
Active power of SV [p.u]
0 10 20 30 40 50 60 70 80 90 100 -0.14 -0.12 -0.1 -0.08 -0.06 -0.04 -0.02 0 0.02 0.04
Reactive power of SV [p.u]
0 10 20 30 40 50 60 70 80 90 100 0.998 0.9985 0.999 0.9995 1 1.0005 1.001 1.0015 1.002 1.0025 1.003 Voltage of SV [p.u] f0 (p.u) Ps (p.u) Pm (p.u) f Eq. (17) (p.u) s P Eq. (18) (p.u) m P Eq. (19) (p.u) P’s (p.u) P’m (p.u) 1.007 0.36 0.12 0.0032 0.064 0.064 0.43 0.18
Fig. 6. Comparison of case 1 & 2 for a +0.15 p.u step in Pref
Fig. 7. Comparison of case 1 & 2 for a +0.1 p.u step in Vref
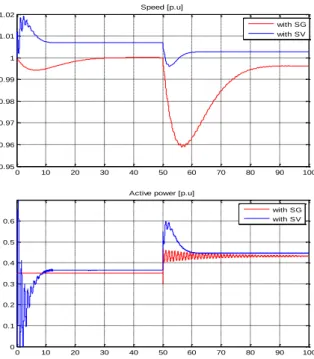
As a result, the VSG concept improved also the transient stability of the neighboring AC system. Furthermore, a severe short-circuit of 200 ms duration is applied. Fig. 8 shows the responses of active power and speed in case 1 and 2. It can be observed that the transient oscillations obtained with the VSG are more damped than the ones obtained with the SG. The active power response of SG is more oscillatory than the VSG; oscillations are attributed to electromechanical dynamics of the rotor to reach steady state, for the case of VSG, power control is electronic.
Fig. 8. Comparison of case 1 & 2 for a 200 ms short-circuit
Fig. 9. Responses of the VSG with different inertia constant
B. Response of VSG to system faults
The VSG shown in Fig. 3.b is tested with different inertia values H in order to improve transient stability of the system.
B.1 Effect of inertia values
Fig. 9 shows the responses of the VSG to a +0.13 p.u load change and with different inertia constant. We note that local performances with a small inertia are better.
0 10 20 30 40 50 60 70 80 90 100 0.95 0.96 0.97 0.98 0.99 1 1.01 1.02 Speed [p.u] with SG with SV 0 10 20 30 40 50 60 70 80 90 100 0 0.1 0.2 0.3 0.4 0.5 0.6
Active power [p.u]
with SG with SV 49.5 50 50.5 51 51.5 0.995 1 1.005 1.01 1.015 Voltage [p.u] with synchronverter with SG 48 50 52 54 56 58 60 62 -0.015 -0.01 -0.005 0 0.005 0.01
Reactive power [p.u]
with synchronverter with SG 0 10 20 30 40 50 60 70 80 90 100 0.985 0.99 0.995 1 1.005 1.01 1.015 1.02 1.025 Speed [p.u] with synchronverter with SG 0 10 20 30 40 50 60 70 80 90 100 0 0.1 0.2 0.3 0.4 0.5 0.6 0.7 0.8
Active power [p.u]
with synchronverter with SG 50 55 60 65 0.35 0.4 0.45 0.5 0.55
Active power of SV [p.u]
H=3.2s H=1s 45 50 55 60 65 70 0.996 0.998 1 1.002 1.004 1.006 1.008 Speed of SV[p.u] H=3.2s H=1s
In addition to the previous simulations and in order to better investigate the transient stability, the critical clearing times are obtained with different inertia constant. The results are resumed in Table II and confirm the improvement of transient stability with a small inertia. As a result, it is not necessary to have a large inertia as for a physical SG, where a larger inertia means that more energy is stored mechanically. We can observe that a small inertia is good for overall grid stability.
Table II: CCTs with different constant inertia
B.2 Frequency regulation by PID governor
Standard parameters of SG presented above are applied to the VSG. For performances improvement, the static droop control loop is replaced by the PID governor. Results presented in Fig. 10 shows that local performances of VSG with the same parameters of SG are improved with PID governor.
V. CONCLUSION
This paper presented a dynamic performances study of the virtual synchronous generator. The latter is based on the synchronverter control strategy. The study is based on a comparative analysis of a SG/VSG two-area system, feeding a common load. For each configuration, dynamic performances to different system fault are studied and the transient stability of the system is assessed in terms of the fault critical clearing time. Due to the controllable features, the virtual synchronous generator of the same capacity and parameters with a standard SG can be used to improve the dynamic system oscillations, the response time and the transient stability of interconnected AC systems in terms of increasing the fault critical clearing time.
VI. REFERENCES
[1] “Worldwide electricity production from renewable energy”, fifth teeth inventory, 2013 edition.
[2] Emilio. J. Bueno, Felipe Espinosa, Francisco J. Rodriguez, Jesds Ureila, Santiago Cobreces, "Current Control of Voltage Source Converters connected to the grid through an LCL-filter" , 35rh Annual IEEE Power Electronics Specialists Conference, 2004.
[3] Q-C. Zhong, “Robust droop controller for accurate proportional load sharing among inverters operated in parallel”, IEEE Transactions on Industrial Electronics, volume 60, pp. 1281-1290, (2013).
[4] Q.-C. Zhong, and G.Weiss, "Synchronverters: Inverters that mimic synchronous generators," IEEE Trans. Ind. Electron., Apr. 2011, vol. 58, no. 4, pp. 1259–1267.
[5] Fang Gao, M. Reza Iravani. “A control strategy for a distributed generation unit in grid-connected and autonomous modes of operation”, IEEE Transactions on power delivery, volume 23, pp. 850-859, (2008)�
[6] Yong Chen, Ralf Hesse, Dirk Turschner, et al. “Improving the grid power quality using virtual synchronous machines”, Proceedings of the 2011 International Conference on Power Engineering, Energy and Electrical Drives, pp. 1 -6, (2011).
[7] P. Kundur, "Power system stability and control", Mc Graw-HillInc, 1994. [8] P-L. Nguyen, Q-C. Zhong, F. Blaabjerg, and J-M. Guerrero, " Synchronverter-based Operation of STATCOM to Mimic Synchronous Condensers", 2012 7th IEEE Conference on Industrial Electronics and Applications (ICIEA).
[9] IEEE Recommended Practice for Excitation System Models for Power System Stability Studies, IEEE Power Engineering Society, 21 April 2006.
Fig. 10. Responses of the VSG with PID governor
VII. APPENDIX Network data (Fig. 3)
Area 1&2: Generator: Rated 200 MVA, 20 kV, line voltage=100 kV, frequency=50 Hz, Rs=0.75, Ls=0.2 H, Xl (p.u): leakage Reactance = 0.18 Xd (p.u.): d-axis synchronous reactance = 1.305, T’d0 (s): d-axis open circuit sub-transient time constant =0.296, T’d0 (s): d-axis open circuit transient time constant = 1.01, Xq (p.u): axis synchronous reactance = 0.053, Xq (p.u): q-axis synchronous reactance = 0.474, X’’q (p.u): q-q-axis sub transient reactance =0.243, T’’q0 (s): q-axis open circuit sub transient time constant=0.1, Coupling Delta/ Yg
Primary resistance (p.u) =0.002, Primary inductance (p.u) =0.12 Secondary resistance (p.u) =0.002, Secondary inductance (p.u) =0.12 M =2H (kWs/kVA): Mechanical starting time = 6.4.
Governor control system
Dm(%): permanent droop =5, servo-motor: ka = 10/3, ta (s) = 0.07, regulation PID: kp = 1.163, ki= 0.105, kd= 0
Excitation control system
Amplifier gain: ka = 200, amplifier time constant: Ta (s) = 0.001, damping filter gain kf = 0.001, time constant te (s) = 0.1
Generator transformers Rated 400 MVA, 20/ 100 kV Load: PL=200 MW
AC transmission lines: Resistance per phase (Ω/km) =0.03, Inductance per phase (mH/km) =0.32 , Capacitance per phase (nF/km) =11.5
Pi line length= 100 km
AC filter: reactive power=40 MVAR
DC system: voltage= ±100 kV, rated DC power=200 MW
48 50 52 54 56 58 60 62 64 66 68 70 -0.12 -0.1 -0.08 -0.06 -0.04 -0.02 0
Reactive power of SV [p.u]
with static droop with PID governor
45 50 55 60 65 70 75 80 0.9995 1 1.0005 1.001 1.0015 1.002 1.0025 Volatges [p.u]
with static droop with PID governor
50 55 60 65 70 75 0.35 0.4 0.45 0.5 0.55 0.6 0.65
Active power of SV [p.u]
with static droop with PID governor
H (s) 3.2 2 1.5 0.032
CCT (ms) 175 250 300 unstable