ISBN: 978-85-89274-32-6
Editor: Incaper Format: digital/printed May 2019
INCAPER EDITORIAL BOARD - CEO
President: Nilson Araujo Barbosa
Technology and Knowledge Transfer Management: Sheila Cristina P. Posse Research, Development and Innovation Management: Luiz Carlos Prezotti Technical Assistance and Rural Extension Management: Celia J. Sanz Rodriguez Editorial Coordination: Aparecida de Lourdes do Nascimento
REPRESENTATIVE MEMBERS: Anderson Martins Pilon André Guarçoni M.
Cíntia Aparecida Bremenkamp Fabiana Gomes Ruas
Gustavo Soares de Souza José Aires Ventura
Marianna Abdalla Prata Guimarães Renan Batista Queiroz
GRAPHIC DESIGN, ELECTRONIC EDITING, FINAL ARTWORK AND COVER
Laudeci Maria Maia Bravin
ENGLISH TRANSLATION
Marcelle Gualda Pasolini
CATALOGING
Merielem Frasson da Silva
PHOTO CREDIT
Augusto Barraque, Incaper and authors’ collection © 2019 - Incaper
Capixaba Institute for Research, Technical Assistance and Rural Extension
Rua Afonso Sarlo, 160 - Bento Ferreira - CEP: 29052-010 - Vitória-ES - Brasil - Caixa Postal: 391
Telephone: 55 27 3636 9888; 55 27 3636 9846 - coordenacaoeditorial@incaper.es.gov.br | www.incaper.es.gov.br
All rights reserved under the Law No 9610, which protects the copyright. Any reproduction, in whole or in part, of this book
or of one or several of its components, by whatsoever process, is forbidden without the express authorization of Incaper or publishers.
GOVERNMENT OF THE STATE OF ESPÍRITO SANTO
Governor of the State of Espírito Santo
Renato Casagrande
DEPARTMENT OF AGRICULTURE, SUPPLY, AQUACULTURE AND FISHERIES - SEAG State Secretary for Agriculture, Fisheries,
Aquaculture and Fisheries
Paulo Roberto Foletto
CAPIXABA INSTITUTE FOR RESEARCH, TECHNICAL ASSISTANCE AND RURAL EXTENSION - INCAPER President director
Antonio Carlos Machado
Technical director
Nilson Araujo Barbosa
Administrative and financial director
Cleber Guerra
EDITORIAL COORDINATION AND PROOFREADING OF STANDARDIZATION
Liliâm Maria Ventorim Ferrão
Conilon Coffee / technical editors, Romário Gava Ferrão ... [et al.]; english translation Marcelle Gualda Pasolini. - 3edition updated and expanded. - Vitória, ES : Incaper, 2019.
974p.: il. color.
Translated from: Café Conilon, 2017 - Incaper. System Required: Adobe Reader
Access mode: https://bibliotecaruitendinha.incaper.es.gov.br/ ISBN: 978-85-89274-32-6
1. Brazil. 2. Espírito Santo (State). 3. Coffee Cultivation. 4. Conilon Coffee I. FERRÃO, Romário Gava (Ed.). II. FONSECA, Aymbiré Francisco Almeida da (Ed.). III. FERRÃO, Maria Amélia Gava (Ed.). IV. DE MUNER, Lúcio Herzog (Ed.). V. Capixaba Institute for Research, Technical Assistance and Rural Extension. VI. Title.
CDD: 633.73 Incaper - Rui Tendinha Library
International Cataloging Data in Publication (ICP)
Elaborated by Merielem Frasson da Silva - CRB-6 ES/675 C129
8
Biotechnology Applied to
Coffea canephora
Maria Amélia Gava Ferrão, Luís Felipe Ventorim Ferrão, Ludymila Brandão Motta,
Aymbiré Francisco Almeida da Fonseca, Romário Gava Ferrão and Elaine Manelli Riva Souza
1 INTRODUCTION
In the coffee breeding, it is of fundamental importance the use of techniques that accelerate the evaluation and selection of superior genotypes, considering its social and economic importance and the time demanded of research because it is a perennial culture that often requires years so that the characteristic of interest can be expressed. Many desirable characteristics in the conilon coffee tree, as in other species, result from the combined action of more than one gene and their interactions with the environment, being sometimes difficult to understand, evaluate and select. The sequencing of genomes and the advent of molecular markers bring complementary approaches to classical genetics for the understanding of this complex relation.
Knowledge generated from molecular markers, combined with information on phenotypic characteristics, provides basic data for the evaluation of genetic variability, genotype clustering, selection and cross planning.
With recent advances related to large scale DNA sequencing technologies integrated with quantitative genetics tools, it is expected to contribute with a new impetus in coffee research, increasing the efficiency of the predictive capacity and, concurrently, the selection in order to maximize the genetic gain per unit of time.
In this chapter, an approach will be carried out about the topic molecular biology focusing on the following topics: genetic and molecular markers, genomic resources, genomic selection and their applications in coffee cultivation.
2 GENETIC MARKERS
Any allelic form originating from a genome can be used as a genetic marker, that is, a phenotypic data, a protein or a DNA fragment that encodes or not a gene and which has a single or repeated sequence in the genome. Many genes and non-coding DNA sequences are represented in a species by two or more different allelic forms, corresponding to the same
chromosomal locus, which characterizes the phenomenon called genetic polymorphism. For convenience, a locus is considered polymorphic when the frequency of its most common allele is equal to or less than 99% in the population. Therefore, any DNA fragment can theoretically be used as a molecular marker, as long as it reveals polymorphism between individuals. In general, the number of these fragments is limited and they should be devoid of epistatic or pleiotropic effect (FERREIRA; GRATTAPAGLIA, 1998; BORÉM; CAIXETA, 2009).
Markers can be defined as instruments capable of mapping and characterizing a phenotype. Genetic markers are denominated and they can be divided into two basic types: morphological and molecular. Genetic markers are any characteristics, biochemical processes or DNA fragments that allow the distinction of genetically different individuals (BORÉM, 1997). When a marker behaves according to the basic inheritance laws enunciated by Mendel, it is considered as a genetic marker and can be monitored throughout the generations (FERREIRA; GRATTAPAGLIA, 1998). Genetic markers identify chromosomes regions that differentiate one or more individuals and are transferred to offspring according to Mendel’s Laws.
In the beginning, only the morphological markers were known, which contributed in an effective way to the establishment of the theoretical principles of genetic mapping and genetic linkage analysis. Genetic analyzes were performed using easily identifiable markers, usually controlled by a single gene, often dominant, such as flower color and resistance to some diseases (CAVALLI, 2003). The flowers color and the seed shape, for example, are morphological markers expressed only in the adult plant and evaluation is necessary for a relatively long time.
From the discovery of molecular biology techniques, new methods for detecting genetic polymorphism1 or genetic variations within the same population (FERREIRA; GRATTAPAGLIA,
1998), called molecular markers (DNA markers), have emerged. Molecular markers can be divided into those based on the products of gene expression, such as proteins and enzymes, and those based on specific fragments of the DNA and RNA molecules.
Biochemical or protein markers are those that analyze the product of gene expression. The most used are the isoenzymes, which, according to Ferreira and Grattapaglia (1998), are effective to identify the genetic variability of populations, gene flow and the processes of natural hybridization. Isoenzymes continue to be an important tool for variety identification, germplasm evaluation and for the detection of genetic linkage, among others. Despite their high cost, biochemical markers, as well as morphological markers, have the disadvantage of presenting little variability. This is because they do not have enough markers to identify a large number of alleles of several genes of interest. Another limitation of this technique is the low stability of the enzymes, great environmental influence in the enzymatic activity and differentiated expression associated to the different stages of plant development.
Molecular markers are linked to DNA characteristics, which serve to differentiate individuals and are genetically inheritable (MILACH, 1998a). This is because they mark regions
1The term polymorphism refers to the presence of more than one allelic form, it is detected phenotypically, by a morphological
of the genome associated with a specific characteristic of interest, strictly representing genetic variation, not suffering environmental influence. The polymorphism observed with the use of markers comes from the DNA sequence. Thus, these markers are independent of the development stage of the plant, its tissue type and environmental variations. Another advantage of these markers is the high stability of the DNA, which, after being extracted, can be stored for reuse.
Morphological markers were widely used until the 1960s and were the main sources of selection used by plant breeders, as well as contributing to the initial knowledge of genetic linkage and to the construction of the first genetic maps. With the development of more modern markers, morphological markers were at a disadvantage because they were limited in species, which reduces the possibility of associations between these markers and characteristics of economic importance (FERREIRA; GRATTAPAGLIA, 1998). However, in spite of these limitations, they are still used in combinations with other more precise ones, such as molecular ones, combining laboratory and/or statistical results with those observed in the field, from the morphological markers.
There are currently several molecular markers that can be used in the selection of genetic characteristics of agronomic interests, with different purposes in the coffee tree breeding, highlighting the sources of resistance to pests and diseases, drought tolerance, uniformity and maturation period, caffeine content in beans, quality, among others.
3 MAIN MOLECULAR MARKERS
Molecular markers have been widely used in agricultural research since the 1980s. In parallel, several useful techniques have been developed to detect ambiguities in plant collections, relate kinship between genotypes, determine the identity of a cultivar and construct genetic maps. There are several techniques available, each of them using a peculiar strategy to detect DNA polymorphisms. The main types of molecular markers can generally be classified into three groups: (a) those based on hybridization techniques; (b) based on the amplification of DNA by Polymerase Chain Reaction (PCR) or Chain-growth Polymerization Reaction; and (c) based on sequencing. An important point to be considered in choosing one technique over another is the adequacy of the molecular marker type to the research objective. It will be clear in the description of the molecular markers that each methodology is based on different principles, which makes the consistency and time for the achievement of results flexible; polymorphisms level; cost and ease of implementation; and the reproducibility of the data obtained for each marker class.
The first class of markers used in plant breeding studies was based on hybridization. The technique called Restriction Fragment Length Polymorphism (RFLP) is considered one of the oldest and is based on the combination of the use of restriction enzymes and hybridization with specific probes. For this, the genetic material is extracted, digested and the fragments are selected via agarose gel. Subsequently, these fragments are transferred to cellulose membranes,
where they will be hybridized with DNA probes. The probes are fragments of single copy DNA which, before being used in hybridization, are marked with radioactive or luminescent nucleotides to detect genomic sequences homologous to them. In this hybridization process, it occurs the pairing of the homologous sequences of DNA present in the membrane and of the target DNA, previously digested by restriction enzymes. The polymorphism is detected from the DNA presence or absence, marked with radioactivity or emitted luminescence due to the pairing of these sequences, which generates bands in different regions of the membrane. From the construction of different probe libraries, it is possible to potentially cover the entire genome of the species to be studied. The great advantage of the RFLP technique is its codominance, which favors the distinction between a heterozygous genotype and a homozygote. On the other hand, the large amount of DNA required and the need for intensive laboratory steps made the technique unattractive (FERREIRA; GRATTAPAGLIA, 1998; CAIXETA et al., 2009).
A second class of markers arose from the advent of the PCR technique and the facilities that this methodology aggregated. The PCR reaction aims to synthesize billions of copies of a DNA fragment by means of amplification reactions in the presence of the DNA polymerase enzyme. Developed in the 1980s by Kary Mullis, the method, in general, replicates in vitro the replication process of DNA that occurs in vivo. For this in vitro amplification to occur, the same components involved in the genetic replication of DNA, that is, the target DNA of the species studied, a primers pair (that will delimit the region to be amplified), the DNA polymerase enzyme and their cofactors and the nucleotides that will constitute the new DNA strand. From different cycles of temperature, the DNA will be denatured, the primers will recognize their complementary sequence on the single strand and will anneal to it, and at the end, a new DNA strand will be synthesized. Each cycle involves three phases: the double strand denaturation,
primers pairing with the complementary sequences and synthesis of new DNA strand. These
cycles will be repeated many times and DNA amplification will occur by geometric progression and will result in billions of copies. The techniques based on PCR require a small amount of initial DNA, which favors cases where there is few genetic material available. This technique is an indispensable tool in the breeding program because it is high speed, easy and reliable, with numerous applications ranging from the identification of species to its use in combination with several molecular markers, having, nowadays, several markers of derived DNA (FERREIRA; GRATTAPAGLIA, 1998; CAIXETA et al., 2009).
One of the earliest markers to benefit from the advent of PCR was Random Amplified
Polymorphic DNA (RAPD) whose methodology is derived from PCR protocol, but with two distinct
features: i) using a single primer in instead of a pair of primers flanking a specific sequence; and (ii) the single primer has a short (~10 bp) and arbitrary sequence, which eliminates the need for previous knowledge of the genome of the species under study (WILLIAMS et al., 1990; WELSH; MCCLELLAND, 1990). The RAPD had applications from obtaining and analyzing germplasm banks to constructing genetic maps and locating genes of interest. The technique advantages are simplicity, due to the ease of execution; the speed in obtaining data; the moderate cost; large number of markers randomly distributed across the genome; and the immediate applicability to any type of organism, since the primers are arbitrary sequences. However, the
low information content per loco, caused by the dominant nature, and the low reproducibility were two factors that made the technique limited and contributed to its disuse (FERREIRA; GRATTAPAGLIA, 1998; CAIXETA et al., 2009).
A RAPD derivation has been proposed under the name Sequence Characterized Amplified
Regions (SCAR). SCARs are genomic DNA fragments located on a genetically defined site, which
are identified by amplification via RAPD using a pair of specific oligonucleotides as primers . Thus, SCAR markers are derived from the RAPD markers sequencing aiming the synthesis of specific primers for amplification by PCR. Unlike RAPD, SCAR markers present greater reproducibility and, therefore, are more promising (CAIXETA et al., 2012).
Another class of markers based on PCR amplification was called Amplified Fragment Length
Polymorphism (AFLP). Described by Vos et al. (1995), the AFLP stands out for the large number
of polymorphisms obtained by assay. To do so, the technique consists essentially of four steps (digestion, linking of adapters, amplification and electrophoresis) and is based on the selective amplification of a subset of genomic fragments generated after restriction enzyme digestion. The large number of bands or peaks observed in AFLP evaluations makes the “multiplex index” of these markers, that is, the number of markers simultaneously analyzed in a single electrophoretic run, is one of the highest among molecular marker technologies. The disadvantage of this method is its dominance, as occurs in the RAPD, reducing the level of genetic information detected by site. In addition, it is considered a high cost technique requiring additional steps of DNA digestion and selective amplification. This is due to the frequent number of artifacts present in the interpretation of the results, which generates difficulties and subjectivity in the identification of polymorphisms (CAIXETA et al., 2012).
The final marker based on PCR to be mentioned is the Microsatellite technique also called
Simple Sequence Repeats (SSR), wherein the microsatellites are repeated tandem sequences
ranging from one to six pairs. Abundant and well distributed in the genome, the SSRs stand out because they are highly polymorphic regions and, therefore, of great applicability in genetic mapping studies and genotypes discrimination. In this technique, a pair of specific primers (from 20 to 30 bases) amplifies complementary repeating regions of the genome through the PCR reaction. The amplification products have polymorphisms in the size of the fragment, thus allowing the differentiation of genotypes. Thus, each microsatellite marker will constitute the amplification of a multiallelic locus and a large informational content, given its codominant expression (allows to differentiate homozygotes and heterozygotes) (FERREIRA; GRATTAPAGLIA, 1998; CAIXETA et al., 2012). What limits, in part, its use in a larger scale is the obtaining of
primers, because it is an expensive and time-consuming laboratory process considering from
the construction of genomic library until its design and tests. However, massive sequencing of genomes and deposition of sequences in public databases allowed the design of primers
in silico without the need for genomic library construction. The use of this approach in the
development of microsatellite markers in coffee is reported by Ferrão et al. (2015). In this work, sequences from the Brazilian Genome Coffee Project were used for the development of 101 SSR markers in Coffea arabica . These markers transferability rate in conilon coffee was 89%.
sequencing methods directly influenced the emergence of the third and most promising class of molecular markers,that is, those based on DNA sequencing. Named as Single Nucleotide
Polymorphism (SNP), these markers have as a genetic base the most elementary changes of
the DNA molecule, that is, variation in the DNA sequence that affects only a nitrogenous base (Adenine, Cytosine, Thymine or Guanine).
The discovery of SNPs as molecular markers is not a recent phenomenon and was mainly motivated by the development of sequencing techniques. The abundant and well distributed form with which they were found in different species confirmed the importance of this markers class and reinforced this methodology promising character. Of codominant and commonly biallelic expression (two alleles per locus), it is now known that, for most organisms, SNPs represent the most frequent form of genetic variation. Although they are biallelic and therefore less informative than SSRs (multiallelic), the imminent success of this class of molecular markers has occurred, mainly, in the possibility of automation and large-scale use. Unlike traditional methods, which were inefficient and expensive for large-scale genotyping, methods for identifying SNPs (commonly referred to as High Throughput Genotyping) have gained scientific appeal for flexibility for studies with large sets of individuals (hundreds or thousands) using high density of markers (hundreds of thousands).
Due to the increasing importance and popularity, a large number of SNP genotyping methods are currently described in the literature. In contrast to the above-mentioned markers, where there is a standard protocol with minor modifications from one laboratory to the next, in the case of SNPs genotyping, a relatively high number of techniques are described in the literature. It is not within the scope of this chapter to enter into the details of biochemical and molecular methods involved in this process. In general, however, the majority of techniques combine two steps: i) molecular reaction for allele discrimination; and ii) identification methods of these alleles. Currently, dozens of genotyping methods that combine methodologies for SNPs discrimination and identification are listed in the literature. Further details on the biochemical nature of these processes are described in Tsuchihashi and Dracopoli (2001), Vignal et al. (2002) and Caixeta et al. (2012).
The number of commercial platforms developed for genotyping purposes is also high and opens up good perceptions for obtaining thousands of SNPs at moderate costs and time. In plant breeding, the use of solid commercial arrays are specially popular and flexible to allow the researcher to ponder the required amount of SNPs by the number of individuals and cost. Among the most commonly used trading systems are the Golden Gate and Infinitum platforms, both based on Illumina’s beads technology. Despite the advantages and the great appeal of the research groups, the development of these platforms is still restricted to some species. In the specific case of conilon coffee, this kind of commercial services are not yet available, which makes it impossible to apply them directly to genetic studies. Besides the unavailability for some species, another drawback is the fact that the markers fixed in these arrays are specific to a base population. Thus, if the genetic background of the material under investigation is very different from that used for the arrays development, it may be observed ‘bias” and low yield in the SNPs identification (DESCHAMPS et al., 2012).
A promising method of SNPs genotyping with high scientific appeal in recent years has been termed genotyping by sequencing. Originated from the advent of modern sequencing technologies, the SNPs identification was benefited by the reduction of costs by data point and the development of Next Generation Sequencing (NGS) technology.
In general, genotyping by sequencing methods can be divided into four stages: i) reduction of genomic complexity; ii) PCR; iii) NGS sequencing; and iv) bioinformatics. Currently, some commercial companies, such as GBS (Cornell University, Institute of Biotechnology, USA), RAD-seq (Floragenex, USA); Rapid Genomic (Florida University, USA) and DarT-RAD-seq (Diversity Arrays
Technology, University of Canberra, Australia) perform this type of service. In order to detail
the technology operation and its applicability in coffee cultivation, the method employed by GBS will be described as follows. GBS is a methodology for the identification of SNPs that combines the use of restriction enzymes for the construction of reduced genomic libraries and the use of NGS platforms in the polymorphic regions identification (ELSHIRE et al., 2011). The technique has proved robust among different species and capable of generating hundreds of thousands of molecular markers in a simple, fast and reproducible way. An important point of this approach is that, unlike traditional methods, the discovery of markers and genotyping are performed in a single step. Thus, the fundamental objective of this methodology is not to identify new markers and then transfer them to fixed platforms of genotyping (arrays), but to simultaneously perform the discovery of polymorphisms and the obtaining of genotypic information. This one-step approach makes GBS truly fast and flexible for genetic studies on different species. Besides that, the possibility of marker findings within the study material itself reduces certain ‘bias’ of genotyping when compared to array - based methodologies (POLAND; RIFE, 2012).
To do so, the technique is performed in a series of steps that will be briefly described. The first and most important is obtaining high quality genomic DNA. The use of commercial kits that guarantee quality and quantity is recommended. After extraction, the diluted DNA is fixed in standard PCR plates (96 wells) where each of the 95 wells will correspond to an individual’s DNA sample and one well of the plate will be used as a control (white). After strict quality control, in which the samples quality and concentration are measured, each sample is digested using type II restriction enzymes which, among the characteristics, generate cohesive extremities and are sensitive to methylated regions. The choice of which enzyme to use is a critical point of the process and will determine the coverage and amount of SNPs obtained at the end of the process. Typically, the most commonly used endonucleases are ApeK1 and MspI (frequently cut) as well as PstI and EcoT221 (rarely cut). After the digestion process, the DNA, already fragmented, is then bound to specific adapters called barcodes. Each barcode will be a small, non-redundant DNA sequence that will uniquely identify the samples. The use of these small identifier sequences allows multiple samples to be processed in a single sequencing platform. After the adapter binding step, all samples are then mixed and a PCR reaction is performed, thus allowing to increase the number of desired fragments, against the remaining fragments. The primers used in this step are complementary to the sequence of the adapters and also to the oligonucleotide sequences present in the sequencing platform. Subsequently, the PCR
products are purified, and the size of the generated fragments are checked. DNA sequencing is the last GBS laboratory step. After obtaining the sequences, the bioinformatics steps are started.
Prospecting molecular markers from raw sequences involves several processing steps and the use of various computational tools. The term pipeline is commonly used to refer to a series of steps for manipulating such biological data in a specific programming environment. In general, these pipelines include: quality control of raw sequences; grouping of sequences by
barcodes; alignment between sequences and/or against a reference genome; filtering of the
SNPs considering the parameters of minimum allele frequency (mAF), number of data lost and the coverage of the sequencing; and finally the SNP calling in hapmap and/or VCF formats. In the specific case of GBS, these pipelines are available, and the TASSEL software can be used for this purpose (GLAUBITZ et al., 2013).
One point to be considered in data analysis and the main problem of GBS is the amount of data lost. This type of problem is due to the low coverage of the sequencing, caused by two distinct factors: sampling and biological. Sampling refers to the analysis of large genomes or ‘bias’ in fragment size. On the other hand, the data lost due to biological causes are generated mainly by the existence of non-shared genomic regions between the analyzed genotypes or even by the existence of differential polymorphic cleavage sites. A commonly used alternative is the use of data imputation, which can be defined as replacing the missing data with estimates of plausible values to be included (imputed) to the missing data. In other words, this technique aims to “complete” the databases and make it possible to analyze the complete data. A large number of imputation methods are described in the literature. Another approach would be to modify the standard protocol to reduce the complexity of GBS libraries. To do so, a viable alternative would be to avoid using high levels of multiplexing and/or sequencing the library several times. Both proposals would result in a greater amount of data per sample (greater depth) and, consequently, lower percentage of data lost. However, despite the efficiency, it is emphasized that these changes increase the genotyping cost.
In coffee, the vast majority of genetic studies still rely on traditional markers. Among them, SSRs stand out as the most popular, followed by AFLP, RAPD and SCAR. Comparative studies about the efficacy of these methodologies show that, for studies on genetic diversity in Coffea
canephora, the RAPD, AFLP and SSR markers are efficient in discriminating the genetic material
of the Robusta and Conilon groups. However, despite the efficiency, the differential number of polymorphisms and the informational content should be considered when choosing one of the technologies (FERRÃO et al., 2013). In the case of the use of SNPs, the number of coffee works with coffee is considered irrelevant when compared to other crops, such as corn, soybean, rice and wheat. The first studies with GBS in C. canephora were initiated by Incaper and partners in the year 2014, with important preliminary results, mainly, by the coverage and number of SNPs obtained.
It should be emphasized that the concepts discussed about genotyping by sequencing generally apply to any of the commercial services. The choice of GBS (IGD, Cornel) to the detriment of other methodologies was due to the availability of specific documentation on the subject, as well as open bioinformatics softwares/pipelines and a large number of scientific
works involving different species.
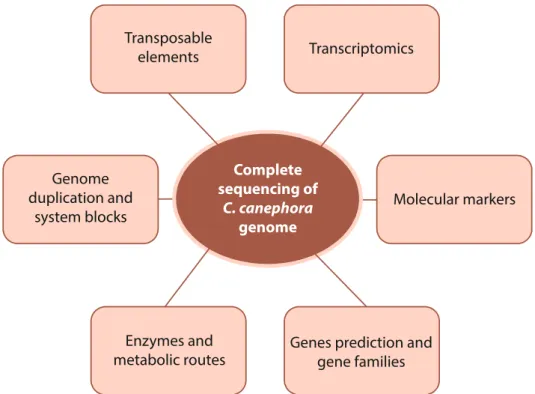
A relevant point in this scenario refers to the complete sequencing of the genome of the species (DENOEUD et al., 2014), which opens new perspectives for the development and application of the SNPs markers.
In the next topics, the importance of molecular markers in genetic diversity studies, mapping and detection of Quantitative Trait Loci (QTLs) will be more detailed. The potential of this approach in the assisted selection by markers (MAS) in breeding programs will be contextualized in the discussion on genomic selection.
4 APPLICATIONS OF MOLECULAR MARKERS IN Coffea canephora
The research institutions are attentive to the development of new technologies that benefit, in addition to coffee growers and consumers, the area of genetic improvement. Thus, biotechnological techniques such as molecular markers offer researchers possibilities for better understanding and maintenance of genetic variability to be explored in a breeding program from genes presenting agronomic characteristics to be used as tools for early selection (RUAS et al., 2000). Breeders are interested in transferring a certain characteristic to elites, and molecular markers can be used in hybridization programs to select progenies with the parent of interest gene (s). Another role of molecular markers in coffee research is the organization of a germplasm bank that offers the genetic differences between each variety of the species for future selection programs (MILACH,1998).
In the coffee studies, several types of molecular markers have been developed and used, such as RFLP, RAPD and the most used in the most recent studies have been the SCAR, AFLP, ISSR, SSR and SNPs (LASHERMES et al., 2000b; MONCADA; MCCOUCH, 2004; MALUF et al., 2005; AGGARWAL et al., 2007; VIDAL et al., 2007; MUSOLI et al., 2009; TORNINCASA et al., 2010; FERRÃO et al., 2013, 2014; IVAMOTO et al., 2013; MOTTA et al., 2014; TESFAYE et al., 2014). Molecular markers have been used with different purposes and species, and in recent years the studies with the C. canephora species and with genetic material from the Incaper breeding program have been increasing.
4.1 GENETIC DIVERSITY
For the molecular analyzes, segregant populations, crosses, clonal materials, among others can be used. Orozco-Castillo, Chalmers and Powell (1994), working with different genetic materials, verified specific amplification products for C. canephora in C. arabica indicating interspecific gene flow and introgression in coffee. It was observed that the RAPD technique was efficient to differentiate subgroups of C. arabica, useful also to detect introgression and to characterize the geographic origin of the coffee. The RAPD markers were initially widely used in the research with arabica coffee, and there are a number of works of germplasm characterization and genes of interest identification, among others (OROZCO-CASTILLO; CHALMERS; POWELL, 1994; AGWANDA et al., 1997; DINIZ et al., 2000; SILVESTRINI et al., 2000; SERA et al., 2003). In C.
canephora, the RAPD technique has been used in the genetic diversity and characterization of
germplasm analysis (SILVA et al., 2000; FERRÃO et al., 2005; FERRAO et al., 2009).
The mode of inheritance in Arabica coffee and so-called arabustas (C. canephora x C. arabica) was also investigated using molecular markers (RFLP) (LASHERMES et al., 2000a). The results indicated that the homologous chromosomes of C. arabica matched due to pairing regulators and that they should be controlled by one or more genes.
The ‘Timor Hybrid’ resulting from spontaneous interspecific cross between C. arabica and
C. canephora and their progenitors were evaluated by Lashermes et al. (2000b) for genetic
similarity using the AFLP technique. From introgressive markers, 9% to 29% of the genome of
C. canephora were found in introgressive C. arabica genotypes. This study was important for the
area of Arabica coffee breeding, since the AFLP provided the analysis of the gene introgression level of the hybrid from the obtaining of markers for the coffee, also being an appropriate technique for the characterization of its germplasm.
In addition, the RAPD, AFLP, and Microsatellites markers were used to characterize the genetic divergence of different accesses of the Incaper Germplasm Active Bank (COMBES et al., 2000; FERRÃO et al., 2005; FERRÃO et al., 2009; FERRÃO et al., 2013; SOUZA et al., 2013; MOTTA et al., 2014). The results showed that the analyzed genotypes are distributed in several genetically dissimilar groups and are sources of valuable variability for breeding programs. It is noteworthy that in the Institute’s breeding program, genetic divergence has been studied through biostatistical procedures using molecular data associated with morphoagronomic characteristics and multivariate procedures.
Ferrão et al. (2013) evaluated the efficiency of RAPD, AFLP and SSR markers in genetic studies with C. canephora. SSR, because it is a codominant and multiallelic marker, was considered the most informative of the three and presented the best results in studies of genetic diversity. Frequent and randomly distributed across the genome, SSRs combined informativity, broad genome coverage, robustness and reproducibility, which makes the marker suitable for studies with the species.
Markers linked to genes associated with qualitative characteristics of agronomic importance for coffee were identified, such as the self-incompatibility in robusta coffee (LASHERMES; COUTURON; MOREAU, 1996a), plant size (RUAS et al., 2000), resistance to nematodes (LASHERMES, 2002, 2003; DINIZ, 2004; LIMA et al., 2015) and resistance to Hemileia
vastratrix (TEDESCO et al., 1999; MORENO et al., 2000; FERRÃO et al., 2013). The first report of
QTLs identification associated with resistance to H. vastratrix in C. canephora resulted in the selection of resistant genotypes, which presents perspectives for SAM programs and, in the future, positional cloning (FERRÃO et al., 2013).
In Latin America, the nematode of the branches, Meloidogyne exigua, causes great agronomic damage in most arabica coffee plantations. Curi et al. (1970) found that cultivars of C. canephora are resistant to this nematode, unlike cultivars of C. arabica, which are susceptible. The ‘Timor Hybrid’, which is a variety known to be resistant to pests and diseases, has demonstrated resistance to M. exigua, as seen in C. canephora. Noir et al. (2003) and Diniz et al. (2005) developed a work in which, with the application of AFLP markers linked to the locus
of resistance to M. exigua (Mex-1), they evaluated the origin of introgression of this resistance between the ‘Timor Hybrid’ and their parents (C. arabica and C. canephora). The confirmation of the highest resistance of C. canephora accessions was from the detection of resistance AFLP markers in this species, while no marker was detected in C. arabica. The resistance to M. exigua ‘in the ‘Timor Hybrid’ line was imparted to the Mex-1 locus.
The identification of molecular markers linked to resistance to Melodoigyne M. exigua contributes as a great tool in coffee breeding programs and in the selection of more resistant materials. Within this approach, SCAR markers were developed for the main species of
Meloidogyne existing in the Americas: M. exigua, M. incognita, M. paranaensis, M. enterolobii, M. arenaria, M. arabicida and M. izalcoensis. The available information constitutes a rapid and
accurate methodology for the diagnosis of coffee tree infections caused by these nematodes (ZIJLSTRA et al., 2000; RANDIG et al., 2002; RANDIG; CARNEIRO; CASTAGNONE-SERENO, 2004; CORREA et al., 2013). With conilon coffee, using genetic materials from Incaper, several basic researches were carried out, especially those of Lima et al. (2015) that, by studying the reaction of different tolerant and susceptible clones to drought for nematodes using reproduction factor and histopathology, verified multiple resistance to several nematodes in the Incaper 14 and ES N201004 clones.
The genetic diversity within C. canephora was also verified via differential gene expression. During the induction of a water deficit condition, differential expression was detected for more than 40 genotypes, and it was possible to observe for some of them different patterns of expression among the studied clones of the Incaper breeding program, with a variable level of drought tolerance (22 , 14, 73, 120, among others). It has been found that in the complex network of drought responses, the best efficiency of stomatal and transpiration control of tolerant clones are probably related to the signaling pathways of ABA and nitric oxide (MARRACCINI et al., 2012). Corealated study showed that clone 73 presents efficient transpiration control, protection against photo inhibition, induction of antioxidant and osmoprotective systems and importance of the ABA signaling pathway in response to drought (VIEIRA et al., 2013).
The identification of genetic markers linked to characteristics of interest, such as resistance to rust, nematodes and drought tolerance in C. canephora, will contribute effectively to the selection of germplasm in a shorter period of time and with greater efficiency.
4.2 GENETIC MAPPING AND QTL ANALYZES
Genetic maps are made up of linking groups, which represent the order and distance between genetic markers and allow a better understanding of the segregation and physical relationship of the alleles. Although they do not provide information at the molecular level of the genes, the maps stand out because they aid in the foundation of comparative and evolution studies; understanding of biological processes; and chromosomes organization. If the maps carry a high amount of information, they provide simplification in the genetic manipulation (FERREIRA; GRATTAPAGLIA, 1998). Among the practical applications in plant breeding, it is possible to highlight the opportunities for the selection of parents, SAM and the genes of
interest cloning.
With the advent of molecular techniques, the construction of genetic maps basically involved four stages: i) genetic markers screening; ii) development of a segregating population with loci in linkage imbalance. For this, the use of contrasting parents is essential in order to maximize the polymorphisms levels; iii) inheritance analysis of genetic markers, in which markers are selected according to the frequencies expected for the segregation of a single locus in a population; iv) calculation of distance and ordering of markers based on recombination percentage (LIU, 1998). For the development of segregant populations, in plant breeding, two basic types of population are used: those from controlled (inbreed) crosses and the so-called segregating (exogamic) F1. The first type includes the F2 populations, backcrosses, double-haploid and Recombinant Imbreed Lines - RILs, while the latter includes the full sib, half sib and populations from intercrossing families.
Most of the genetic maps already developed originated from populations of controlled crosses, in which the parents are pure lines. For this case, the generated binding disequilibrium can be estimated in the segregant populations, thus allowing binding analysis (LIN et al., 2003). In addition, in the case of diploid species and with two segregating alleles, the binding phases are known which facilitates the analysis. However, in cultivation such as passion fruit, eucalyptus, sugarcane, citrus, coffee (C. canephora) and other forest species, it is not possible to obtain populations derived from inbred lines due to several biological factors such as self-incompatibility, inbreeding depression or long juvenile period. In these cases the genetic-statistical analyzes for the construction of maps are based on populations developed by the biparental cross between non-homozygous individuals (outcrossing) generating segregating F1 formed by individuals who are full sib or half sib.
For this type of population, the establishment of genetic maps presents two important peculiarities. The first of these is the number of marker alleles, which can range from one to four in diploid species, and the different patterns of segregation that these alleles can follow. Detailed review and classification of these segregation patterns is described by Wu and Ma (2002). The second particularity is related to the lack of knowledge of the linkage phases of the markers, since these are not known a priori for the parents. An important alternative for the construction of maps in non-inbred species was proposed by Grattapaglia and Sederoff (1994) and was called a double pseudo-testcross or pseudocross test. This method proposes the use of only those markers that segregate as experimental populations (1: 1) in the genetic linkage analyzes. For this, two linkage maps are constructed, one for each parent, depending on which one has the heterozygous allele for the marker locus. In this case, the configuration of the crosses need not be defined, at first, as in classic crosses, but rather inferred a posteriori with the analysis of markers segregation in the progenies.
This is a widely used approach in practice, since it allows the immediate use of methodologies and softwares developed for experimental populations. The ease of implementation made the methodology preferred in C. canephora mapping studies. Thus, the first genetic map developed for the species was constructed using 85 doubled haploid progenies and a set of 47 RFLP and 100 RAPD markers (PAILLARD et al., 1996). Other genetic maps are reported by
Lashermes et al. (2001); Lefebvre-Pautigny et al. (2010); Priyono et al. (2010); Anthoëne et al. (2014). Despite the advances, the genetic maps cited are considered to be poorly saturated when compared to other plant species. The development of a genetic map of reference, with more individuals and markers, is reported by Denout et al. (2014) along with the publication of the coffee genome sequencing. The map cited is considered to be high density, covering 349
scaffolds and comprising about 64% (365 Mb) of the genome assembly. For this, a segregating
F1 population composed of 93 genotypes was used. Genotypes of the Congolese and Guinean varietal groups were used as parents for the development of the experimental population. Different classes of markers were used in the genetic mapping, including Restriction Associated
DNA sequencing (RADseq), RFLP, SSR and SNPs. A total of 3230 loci, distributed in 11 linkage
groups, were identified, resulting in coverage of 1471 cM with a mean interval between two markers of 0.46 cM.
One of the most important applications of genetic maps is the understanding of quantitative traits in the mapping studies of QTLs. Quantitative (or complex) are defined as those characteristics determined by a high number of genes and that are influenced by environmental factors to different degrees. The phenotypes resulting from the expression of these genes present a continuous variation in population rather than discrete classes, as observed in simple Mendelian trait characters. The continuous variation makes it impossible to group the genotypes into classes, making the individual per se a unit of study of little value. Thus, for studies of complex characteristics, it is necessary to use quantitative models that contemplate a type of inheritance that is determined by the segregation of several loci, each of which has a small effect on the genotype. For this, these models are based, in most cases, on the principles of population genetics, with emphasis on the means, variances and covariance estimates.
QTL is the region in the genome (locus) responsible for the control of this type of character and as mapping of QTL, and studies that focus on the identification, positioning and estimation of effects and interactions (epistasis) of quantitative traits. The theoretical basis of these studies is based on the elucidation of an oligogene or polygene (controller gene of a complex inheritance character) through a monogene (controller gene of a simple inheritance character) that are physically linked. In other words, the detection and mapping of QTLs are done based on the analysis of the joint segregation of the molecular markers loci (monogenes) and phenotypic values (oligogenes or polygenes) observed. However, the premise underlying these analyzes is the existence of linkage imbalance between markers and QTLs. In the absence of this prerequisite, the marker and QTL alleles will occur in combinations equivalent to the independent distribution, thus making no association between the two loci (MACKAY et al., 2009).
Like the experiments with linkage maps the theoretical reference for QTL analyzes in plants basically involves the use of experimental populations derived from inbred line. The reasons are the same as those quoted earlier. Thus, in general, QTL mapping studies include statistical methods from the simplest techniques, such as the analysis of individual marks (ANOVA and simple linear regression), to the more complex models, which involve the analysis of multiple
regions of the genome simultaneously (interval mapping).
For the C. canephora species, the number of mapped QTLs is still considered moderate. Among those that are reported in the literature, emphasis is given to studies with the locus S of incompatibility (LASHERMES et al., 1996); restoration of pollen viability (COULIBALY et al., 2003); morphological characteristics (AMIDOU et al., 2007; ANTHOËNE et al., 2014); capacity of somatic embryogenesis (PRIYONO et al., 2010); and for beverage quality (LEROY et al., 2011; ANTHOËNE et al., 2014). Among these, the studies related to the beverage quality deserve to be highlighted for the economic importance and attention they have been gaining in the conilon coffee breeding programs. The first work that proposed to study the genetic architecture of this character in C. canephora was reported by Leroy et al. (2011). In this study, QTLs associated with organoleptic and biochemical characteristics could be identified and are promising candidates for application in breeding programs. In addition to the individual QTLs, the study also reports the existence of genomic zones, in which QTLs related to different characteristics were colocalized. Among them, a range of 45 to 60 cM in Linkage Group K accumulates important QTLs associated with agronomic and biochemical characteristics. Another region of great value was located in Linkage Group I and QTLs related to acidity, bitterness, caffeine, and chlorogenic acids were colocalized. The demonstration that the genetic variability of chemical compounds, such as caffeine and chlorogenic acids, is related to the genetic variability of beverage quality (acidity and bitterness) is considered the main result of the study.
Despite the increasing advance of SAM methods, mapping studies of QTLs still deserve attention because of their investigative nature. Even with the rapid advancement and proven efficiency of genomic selection methods, which will be further detailed later, it is emphasized that studies with QTLs are especially interesting in understanding the genetic architecture of a character. Position, number, effect, and quantitative character interactions (epistasis) are exclusive information to QTL mapping analyzes and may direct a breeding program to the extent that they assist in the selection practice and report the genetic progress achieved during the generations. In addition, they can aid in the elucidation of complex issues, such as genotype x environment interaction, number of genes involved, and allelic interactions.
4.3 GENOMIC SELECTION
One of the most promising applications of biotechnology in plant breeding is in studies that use molecular data to aid in the selection of superior genotypes. One of the methodologies the represents this purpose is called Genomic Wide Selection (GWS).
Traditionally, the selection and monitoring of gains in breeding programs are performed considering only phenotypic information. Despite the importance and effectiveness of these procedures, more accurate results can be obtained as molecular information is incorporated into genetic prediction models. The first proposal for this purpose was described in the 1990s with the advent of molecular marker techniques and was called Marker Assisted Selection (MAS) (LANDE; THOMPSON, 1990). In general, the approach is based on the development of mapping populations and subsequent association between phenotype and genotype, in order to identify
molecular markers that are close to quantitative character controllers (QTLs) loci. Despite the importance of understanding the genetic bases that control a character, SAM presents some limitations that prevented its routine application in breeding programs, such as: i) the need to establish linkage analysis between marker and QTL, which makes the results valid only for the family (population) under study; and (ii) the identification of QTLs that explain a large portion of the genetic variation, which is rare due to the polygenic nature and environmental influence, which characterize most of the characters of agronomic importance (RESENDE et al., 2012).
Due to the mentioned aspects and seeking to use the attractive of molecular genetics in breeding, Meuwissen et al. (2001) proposed a new methodology for genotypic selection based on molecular data, which was later popularized as GWS. On the one hand, traditional QTL analyzes are based on the detection, mapping and use of QTLs with great effect on selection. On the other hand, GWS can be defined as the simultaneous selection of hundreds or thousands of markers (SNPs preferably), that densely cover the genome so that most genes of a quantitative locus are in imbalance of linkage with a part of the markers (MEUWISSEN et al., 2001). The idea, in this scenario, is that markers associated with QTLs, regardless of the magnitude of their effects, are able to explain almost the entire genetic variation of a quantitative character. The practical result of this method is its application in any family or population of interest, high selective accuracy, efficiency for low heritability traits and exclusion of previous analyzes of genetic mapping and QTL detection.
The popularization and importance of this methodology in studies of genetics and plant breeding can be emphasized when considering the expression of genetic progress or selection gain (GS) given by the product between the selection differential (DS) and heritability (h2). A
derivation of this formula of genetic progress is given by the expression GS = kr gg S/L, where
k is the standardized selection differential, r is the selective accuracy, S is the genetic standard
deviation of the population character and L is the time necessary to complete a selective cycle (RESENDE et al., 2012). Considering this expression, the use of GWS can change the four components of the formula. In perennial species, for example, the benefit is in particular the increase in selective accuracy (r) and the significant reduction of time (L). According to Resende et al. (2012), the increase of r occurs due to the incorporation of the genomic kinship matrix in the prediction methods, while the L component is reduced because the selection is performed in early stages (seedling or plantlet stage).
In the case of coffee tree, due to the long juvenile period, the first field evaluations are performed after three years of planting, which makes the launching of varieties somewhat slow (10-15 years). The efficient use of this tool would allow the selection of elite plants still in the seedling stage, besides acting under characteristics of low heritability or difficult to measure. The practical results of GWS in breeding could be summarized as: high selective accuracy, that is, greater than accuracy through phenotypic selection (MEUWISSEN et al., 2001; HABIER et al., 2007; GODDARD; HAYES, 2007); time saving and reduction of costs.
Such aspects, mentioned above, make GWS a product of the third millennium with real perspectives of success in applied programs of conilon coffee breeding. To that end, the requirements for its implementation basically involve determination and analysis of three
populations:
i) Estimate population: also called a training population, discovery or reference, formed by a moderate number of individuals that will be genotyped and phenotyped for the characteristics of interest. The information generated will constitute a database used in the construction of a prediction model, in which each molecular marker will have its estimated effect for the character of interest.
ii) Validation population: of a size slightly smaller than the estimate population, this sample contemplates individuals who must also be genotyped and phenotyped for the characteristic of interest, generating a set of data, whose purpose is to compute the efficiency of the equation of prediction developed in the previous stage. For this, the Genetic Genomic Values (GGV) of individuals are estimated using the predicted effects of the estimate population equation. The correlation of GGV with true phenotypic values provides the so-called accuracy of genomic selection. In other words, it can be considered a measure of fidelity between the predicted phenotypic value through the prediction model of the first stage and the real phenotypic value measured in the field. The magnitude of this measure provides important information under the power of GWS to predict the phenotypes of a given character based solely on genotypic data.
iii) Selection population: it contemplates the individuals that will be selected in the breeding program, through selected markers based on the good value of accuracy of the previous phase. In this case, the prediction equations derived in the estimate population are then used in the prediction of the GGVs or future phenotypes of the selection candidates. It is emphasized that, at this moment, there is no need for individuals phenotyping, since the genetic merit and the selection of each genotype will be measured by the prediction of the GGVs. The use of molecular information only in the selection process allows this step to be performed even in the seedling or plantlet phase.
It is important to mention that these three stages, although conceptually distinct, do not require populations that are physically separated, that is, a single population can perform all three functions at the same time. Evidence suggests that the accuracy of genomic prediction increases as the number of genotypes of the estimate population rises. Additionally, another factor to be taken into account in the computation of accuracy is the existence of a direct relationship between the estimation and selection population.
In coffee breeding programs, these populations can be derived from cycles of recurrent selection, clonal tests, diallel analyzes, and controlled crosses.
Given the implementation steps of GWS, it is noted that the key factor of the approach is the construction of reliable prediction models that contemplate the effects estimation of the markers. Traditionally, this prediction was performed in two stages, involving the identification of significant markers and then their combination in a multiple regression model, in which markers are the predictor variables, and the phenotypes the variable response (LANDE; THOMPSON, 1990). However, the focus in the last decades has been genomic selection methods, in which all markers are included in a prediction model in a single step.
regression models is the use of the method Ordinary Least Squrare (OLS) or Maximum Likelihood
Estimation (ML). However, in this scenario, where the number of effects to be estimated (number
of markers) is much higher than the number of observations (phenotypic measurements), the use of the classical theory of linear models becomes inadequate, mainly due to problems of dimensionality (observations <parameters) and collinearity of predictor variables. To overcome these difficulties, some solutions have been proposed. The most significant of them is to treat the markers effects as random in the penalized and Bayesian regression models.
According to Resende et al. (2012), an ideal model for GWS should contemplate three attributes: i) accommodate the genetic architecture of the character in terms of genes of small and great effect and their distributions; ii) regularize the estimation process in the presence of multicollinearity and large number of markers using, for this, shrinkage type estimators; and iii) be able to perform the selection of covariates (markers) that affect the characteristic of interest. In this context, the main GWS methodologies can be divided into three classes: explicit regression (penalized and Bayesian estimation methods), implicit regression (Kernel regression and neural networks), and regression with dimensionality reduction (main components and partial least squares).
Comparative studies among prediction models have already been carried out in different scenarios for different species and characteristics. However, what is observed is the absence of an optimal method that is efficient for all situations. Currently, the use of explicit regression methods has been preferred in studies involving real data. Among these, the G-BLUP method is the most commonly used, mainly, for the ease of implementation in software for the analysis of mixed models. In addition, the Bayesian methods (BayesA, BayesB, BayesC) have been highlighted, mainly, by the greater flexibility with which assumptions are added to the predictive models. The practical result of these choices will allow the model to accommodate distinct genetic assumptions, such as a large number of null effect markers or, for example, all small effect SNPs. These differences of presuppositions make some models behave better than others depending on the genetic architecture of the quantitative character considered (DE LOS CAMPOS et al., 2013).
Applied GWS studies are frequently reported in research on animal genetics and, to a lesser extent, on plant species. In plant breeding, we highlight the studies carried out on corn, wheat, soybean and eucalyptus. Despite the relevance, the number of theoretical and applied studies in coffee is in the initial phase.
5 GENOMIC RESOURCES
Methods for analyzing the structure and function of large-scale genes, collectively called as genomic technology, have provided enormous information production and generation of DNA sequence databases that enable the identification of genetic determinants and/or associated with characteristics of agronomic interest.
of the nitrogenous bases that make up the entire genome or, at least, large stretches of it. The expressions structural genome and functional genome are used to denote, respectively, projects of complete sequencing and genome sample sequencing. Both strategies demand large volumes of data to be collected in the form of sequences.
5.1 FUNCTIONAL SEQUENCING OF COFFEE - BRAZILIAN GENOME COFFEE
PROJECT
Brazilian researchers from different research and teaching institutions sequenced the coffee genome in a large network project from 2002 to 2004. As at the time the cost was too high to sequence the entire genome, it was decided to sequence only part of the genome (functional sequencing), that is, there was the sample genome sequencing, known as Expressed Sequence
Tags (ESTs), with only genes expressed by the organism being sequenced. Expressed genes
are those that are active at the time and in the conditions of the analysis. Thus, ESTs are DNA sequences representing pieces of messenger RNA (mRNA), which reveal the genes expressed in a tissue or organ in a certain physiological or pathological situation (VIEIRA, 2003).
The first step of the Brazilian Genome Coffee Project was to obtain EST libraries, which were developed from mRNAs extracted and isolated from cells and tissues of different plants at different stages of development and environmental conditions of C. arabica, C. canephora and C. racemosa. This strategy, although not encompassing the entire genome of the species, allows for the identification of genes related to biological processes of interest, more quickly and efficiently. In C. canephora, for example, we have worked more specifically on tolerant and drought-sensitive plant tissues. Thus, genes directly related to drought tolerance mechanisms can be isolated from the specific sequences obtained from resistant and susceptible plants and can be used both as molecular markers during the selection process and as candidate genes to participate in a research program involving the genetic transformation of plants. The expression of the genes of interest is compared in genotypes that present phenotypic differences for the trait under study.
The first stage of the Brazilian Genome Coffee Project, conducted from February 2002 to February 2004, was led and coordinated by the Consórcio Brasileiro de Pesquisa e Desenvolvimento do Café - CBP&D-Café2 (Brazilian Coffee Research and Development
Consortium) and implemented by Embrapa Recursos Genéticos e Biotecnologia (Embrapa Genetic Resources and Biotechnology) and by the Fundação de Amparo à Pesquisa do Estado do São Paulo - Fapesp (Foundation for Research Support of the State of São Paulo). The project also
2The consortium, created in 1997, involves 12 States of the Federation and is composed of 40 research and development institutions,
among them the founders of the Empresa Brasileira de Pesquisa Agropecuária - Embrapa (Brazilian Agricultural Research Corporation), Empresa Baiana de Desenvolvimento Agropecuário - EBDA (Bahia Agricultural Development Company), Instituto Capixaba de Pesquisa, Assistência técnica e Extensão Rural - Incaper (Capixaba Institute for Research, Technical Assistance and Rural Extension), Empresa de Pesquisa Agropecuária de Minas Gerais - Epamig (Agricultural and Livestock Research Company of Minas Gerais), Instituto Agronômico de Campinas - IAC (Agronomic Institute of Campinas), Instituto Agronômico do Paraná - Iapar (Agronomic Institute of Paraná), Empresa de Pesquisa Agropecuária do Estado do Rio de Janeiro - Pesagro-RIO (Agricultural Research Company of the State of Rio de Janeiro), Secretaria de Apoio Rural e Cooperativismo - MA/SARC (Rural Support and Cooperativism State Department), Universidade Federal de Lavras - UFLA (Federal University of Lavras) e Universidade Federal de Viçosa - UFV (Federal University of Viçosa).
counted on the intense participation of the State Universities of São Paulo (Unicamp, USP and Unesp), Instituto Agronômico do Paraná - Iapar (Agronomic Institute of Paraná), Universidade Federal de Lavras - UFLA (Federal University of Lavras), Universidade Federal de Viçosa - UFV (Federal University of Viçosa), Instituto Agronômico de Campinas - IAC (Agronomic Institute of Campinas), Empresa de Pesquisa Agropecuária de Minas Gerais - Epamig (Agricultural and Livestock Research Company of Minas Gerais) and Instituto Capixaba de Pesquisa, Assistência Técnica e Extensão Rural - Incaper (Capixaba Institute for Research, Technical Assistance and Rural Extension) in the technical discussions and in the supply of genetic material for the construction of gene libraries. The materials used for the construction of the C. arabica and C.
racemosa cDNa libraries originated from the germplasm collection of IAC and C. canephora
from Incaper (VIEIRA et al., 2005).
The Brazilian Genome Coffee Project generated 130.792, 12.381 and 10.566 EST sequences of C. arabica, C. canephora and C. racemosa, respectively, assembled in 33 thousand unigenes (VIEIRA et al., 2006) and was the first worldwide sequencing of the functional genome of coffee. This allowed the identification of over 30,000 genes, responsible for the various physiological mechanisms of coffee growth and development. The obtained database originated from the sequencing of several cDNA libraries, that is, DNA sequences corresponding to the genes expressed in the various tissues of the plant (leaves, roots, fruits, flowers and healthy branches and submitted to biotic and abiotic stresses - pests, diseases, cold, heat and drought) at various stages of development.
After the sequencing, the second step of the project, called “annotation”, has started, which consisted in delimiting the genes and assigning functions to the sequences. This process aims to add to the database value generated under the Brazilian Coffee Genome project by performing the annotation process of more than 30 thousand different gene sequences identified in order to facilitate access to and use of data by several researchers involved in coffee breeding programs (CAIXETA et al., 2003). The annotation process of a sequence is based on a computerized program comparison with voluminous databases containing millions of other sequences. If a significant similarity is found, there are indications that the sequence to be annotated may have the same function. Subsequently, the information generated is carefully examined by several laboratories engaged in mining or data mining (at this stage, similarities between species of interest genes and genes from other previously identified species are compared).
The activity of a gene is expressed at different levels, including RNA, proteins and metabolites. The key role of DNA is the storage of genetic information. To do this, specific regions of the DNA, the genes, are copied into RNA molecules, more specifically into mRNA, by a process known as transcription. These RNAs undergo modifications, and the information contained in the RNA molecule is then translated into a sequence of amino acids forming the proteins, which may also suffer modifications (LEE, 2001; CAIXETA et al., 2003).
Thus, additional studies have been carried out to reliably define the gene function, with the use of other high performance biotechnological tools, called transcriptome, proteome and metabolome, in which: i) transcriptome - conducts studies on gene expression, which measures the RNA concentration of the tissue or organism in question; comprises the set of
RNA molecules from a genome or tissue; ii) proteome - conducts studies on the protein profile of an organism; refers to proteins expressed by a genome or tissue; and iii) metabolome - aims to identify and quantify the total composition of metabolites of an organism; metabolites can be defined as end products of gene expression.
In the Brazilian Genome Coffee Project, the main objectives defined in the initial research plan were to determine the genes expressed in the various tissues and organs, as well as in situations of biotic and abiotic stresses, and to construct high quality coffee genetic maps aiming to increase the density of molecular markers to aid the improvement of new varieties (VIEIRA, 2003; VIEIRA et al., 2006).
5.2 FUNCTIONAL SEQUENCING OF COFFEE BY DIFFERENT RESEARCH GROUPS
In recent years, different research groups have produced large sets of EST sequences in coffee, besides the Brazilian. The CENICAFÉ research group produced 32.961 ESTs of C. arabica cv. Caturra, originated from the tissues of leaves, fruits and flowers, assembled in 10.799 unigenes (MONTOYA et al., 2006). At the French Research Institute for Development (IRD), 10.420 ESTs were produced from C. canephora cDNA libraries, obtained from fruits and leaves, which were assembled in 5.534 unigenes (PONCET et al., 2006). Nestlé and Cornell University produced 47 thousand ESTs (13,175 unigenes) (LIN et al., 2005). From the two cultivars of C. arabica (Red Catuai and Red Bourbon), 1.587 ESTs were produced to develop a cDNA microarray containing 1.506 ESTs of leaves and embryonic roots (DE NARDI et al., 2006).
Currently, some databases are available to the scientific community. GenBank, for example, provides access to 187.715 ESTs of C. arabica, 70.407 ESTs of C. canephora, and C. racemosa with 10,838 ESTs (http://www.ncbi.nlm.nih.gov/genbank). Similarly, Cornell University, in partnership with Nestlé, provided about 47 thousand ESTs from five cDNA libraries of C. canephora (http:// www.sgn.cornell.edu/content/coffee.pl). From the grouping and assembly of these 47 thousand ESTs, 13.175 unigenes were identified, which were used in the comparative analysis with repertoires of Arabidopsis and tomato (Solanum lycopersicum) genes. In the computational comparison, we observed a greater conservation of the sequences between C. canephora and tomato (both Euasterid clade) than between C. canephora and Arabidopsis (Eurosid clade). This considerable number of sequences represents a valuable resource for establishing a catalog of genes for the genus Coffea. However, in the absence of robust prediction software for Coffea- specific genes, it is recommended that they be performed with prediction algorithms, trained with the Eurosids genes (GUYOT et al., 2009). In the computational comparison, we observed a greater conservation of the sequences between C. canephora and tomato (both Euasterid clade) than between C. canephora and Arabidopsis (Eurosid clade). This considerable number of sequences represents a valuable resource for establishing a catalog of genes for the genus
Coffea. However, in the absence of robust prediction software for Coffea - specific genes, it is
recommended that they be performed with prediction algorithms trained with the Eurosids genes (GUYOT et al., 2009).