HAL Id: hal-00952176
https://hal.archives-ouvertes.fr/hal-00952176
Submitted on 26 Feb 2014
HAL is a multi-disciplinary open access
archive for the deposit and dissemination of sci-entific research documents, whether they are pub-lished or not. The documents may come from teaching and research institutions in France or abroad, or from public or private research centers.
L’archive ouverte pluridisciplinaire HAL, est destinée au dépôt et à la diffusion de documents scientifiques de niveau recherche, publiés ou non, émanant des établissements d’enseignement et de recherche français ou étrangers, des laboratoires publics ou privés.
Thilo F. Morgeneyer, Thibault Taillandier-Thomas, Lukas Helfen, Tilo
Baumbach, Ian Sinclair, Stéphane Roux, François Hild
To cite this version:
Thilo F. Morgeneyer, Thibault Taillandier-Thomas, Lukas Helfen, Tilo Baumbach, Ian Sinclair, et al.. In situ 3-D observation of early strain localization during failure of thin Al alloy (2198) sheet. Acta Materialia, Elsevier, 2014, 69, pp.78-91. �10.1016/j.actamat.2014.01.033�. �hal-00952176�
In situ 3D observation of early strain localisation during failure of thin Al
alloy (2198) sheet
Thilo F. Morgeneyer1, Thibault Taillandier-Thomas1-2, Lukas Helfen3-4, Tilo Baumbach3,
Ian Sinclair5, Stéphane Roux2 and François Hild2
1
Mines ParisTech, Centre des Matériaux, CNRS UMR 7633, BP 87, F-91003 Evry Cedex, France
2
LMT-Cachan, ENS Cachan/CNRS/ PRES UniverSud Paris, 61 avenue du Président Wilson, F-94235 Cachan Cedex, France
3
ANKA/Institute for Photon Science and Synchrotron Radiation, Karlsruhe Institute of Technology (KIT), D-76131 Karlsruhe, Germany
4
European Synchrotron Radiation Facility (ESRF), BP 220, F-38043 Grenoble Cedex, France
5
µVIS X-ray Imaging Centre, Faculty of Engineering and the Environment, Southampton University, Southampton, SO17 1BJ, United Kingdom
Abstract
High resolution in situ synchrotron X-ray laminography combined with digital volume correlation is used to measure the damage and plastic strain fields ahead of a notch introduced within a 2198 Al-Cu-Li alloy sheet. Synchrotron laminography is a technique specifically developed for three-dimensional imaging of laterally extended sheet specimens with micrometre resolution. Digital volume correlation is carried out using the 3D image contrast caused by iron rich intermetallic particles present in the alloy. The alloy is recrystallized and tested in T8 artificial ageing condition involving relatively low work hardening. Inclined strain localisation bands are shown to develop at ~800 µm from the notch prior to the onset of damage. Damage in this region results mainly from the nucleation of voids on micrometric intermetallic particles and occurs at a very late stage of deformation followed by very limited void growth. The accumulation of strain in the slanted localisation band is found to be a steady process whereas the crack propagation is a sudden process. Standard 3D FE calculations using either von Mises’ plasticity or Gurson’s model do not capture the plastic localisation process.
1. Introduction.
While fracture events in thick metallic structures are well studied and fairly well established, failure processes of thin-walled components are less understood [1]. However, such thin-walled structures are extensively employed in engineering applications, e.g. in the transport industry. The accurate description of their behaviour during forming and service is crucial for fuel efficiency and safety. The ductile fracture of metallic engineering materials at high stress triaxiality (i.e., above 1) is typically due to the nucleation of voids, often at
secondary phase particles, which subsequently grow and coalesce [2]. Lower levels of stress triaxiality may be found in thin sheets (i.e., less than 1). Bao and Wierzbicki [3, 4] have shown the complex experimental dependence of the equivalent strain at fracture on stress triaxiality particularly in this regime of low stress triaxialities. In these regimes ‘sudden’ localised shear failures during forming or structural loading (identified with negligible void growth or coalescence contribution to the overall strain/energy absorption) are observed [5-7].
Such strain localisation phenomena in metals have been studied theoretically by Needleman and Tvergaard [8] who found that localisation is favoured by material behaviours that form a sharp vertex on the yield surface, by material damage and by heating due to plastic deformation leading to thermal softening at high strain rates. Huang and Hutchinson [9] studied the effect of voids and their distribution on strain localisation in a band. Fleck et al. [10] analysed theoretically the effect of nucleation and growth of voids in a shear band and showed that void softening favours localisation.
The exact underlying mechanisms of failure at lower associated levels of triaxiality are not clear [6]. In particular, the intimate interaction between deformation (or strain localisation) and damage onset is not known [11]. Strain localisation may simply occur first, causing damage, or diffuse damage may first nucleate, thereby inducing softening and hence
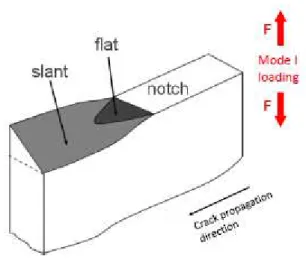
localisation of the fracture process [5]. An example of poorly understood localised failure phenomena is the flat-to-slant crack transition (see Fig. 1). During this process fracture typically initiates at crack-like features, with an initial flat crack forming normal to the loading direction that evolves into a slant crack by so-called localised ‘fast-shear’ decohesion (i.e. flat-to-slant transition). These phenomena are also found for thick specimens close to their external surface in form of ‘shear lips’. Even in 8-mm thick steel plates slant fracture may occur during ductile tearing and levels of stress triaxiality during crack propagation are found to be as low as 0.6 -1.0 via a computational cell methodology [12].
Chen and Knott [13] have stated that the microscopic slant fracture mechanism of high strength aluminium alloys is governed by a ‘fast shear’ decohesion process in which the debonding at sub-micrometre dispersed particles in narrow shear bands results in so-called void sheets. Similar processes are reported for other metallic alloys such as ultra-high strength steels where final fracture may occur through decohesion of carbides from the surrounding material [14]. Such localised failure processes are widely recognised to limit the ductility and toughness of these and other common engineering alloys [15].
Contemporary continuum damage models are formulated for damage kinetics at high stress triaxiality but are also applied to cases of sheet fracture of structural materials [16-19]. These models allow slant fracture and flat-to-slant crack transitions to be reproduced only in very rare occasions [20]. The description of fast changes of void growth by the
phenomenological introduction of the function f* has allowed slant fracture to be captured, but the prediction has been found to be highly mesh-dependent. Recent attempts include damage generation under shear deformation, and some do indeed manage to reproduce the flat-to-slant transitions [21-23] but typically fail to predict the macroscopic load levels. Rousselier and Luo [7] have proposed a new model based on Mohr-Coulomb plasticity linked to a reduced texture model and a coupled damage model. Using this model they managed to reproduce slant strain localisation and fracture phenomena in notched flat specimens. Slant strain localisation bands may also occur and be predicted when Portevin-Le-Chatelier effects are at play [24] that could also in the present case influence the failure behaviour [4]. To assess experimentally the interaction between damage and deformation and to clarify the different contributions to localisation, both need to be measured simultaneously in the bulk with adequate spatial resolution.
X-ray microtomography [25] and related synchrotron imaging methods [26] allow for
in situ damage observations at the sub-micrometre scale, providing unambiguous insight into
historically inaccessible damage processes, along with the potential for extremely data-rich initialisation and validation of simulations [27]. Image-driven three dimensional (3D) structural representations and volumetric measurements of material displacements and/or strain fields at microstructural length-scales enable for this comparison between experiment and model. However, geometrical conditions for sheet material tests cannot readily be met via tomography as only axisymmetric or stick-shape-like specimens can be tested. This is overcome by resorting to synchrotron laminography [28] that provides the opportunity to assess in situ damage processes in laterally extended sheet-like specimens using physical
boundary conditions of engineering relevance [29, 30]. Early laminography principles [31] allowed cross-sectional imaging of one single, so-called focal plane inside the specimen by integrating the intensity on a film during synchronized motion of the source and the detector. Synchrotron Radiation Computed Laminography (SRCL) is based (as in synchrotron
computed tomography) on the acquisition of a collection of projection images of the region of interest (ROI) of the specimen and subsequent computer-aided reconstruction [32]. Although the projection directions close to the in-plane directions of the extended specimen are
avoided, the accompanying loss of information (and therefore imaging artefacts) in the specimen Fourier domain is often preferable to the case of limiting the acquisition angles in tomography [33].
To determine the stress or strain distribution in the bulk of a given material, different methods may be considered. X-ray diffraction measurements of polycrystalline materials [34] give access to the average (elastic) microstrains at a certain location, but the spatial resolution is limited to the beam cross-section employed and the mean crystal size.
Furthermore, only the elastic part of the strain can be measured under these conditions, which is negligibly small compared to the plastic strain encountered during ductile tearing.
An alternative approach is the determination of strain fields by load-dependent 3D structure imaging in combination with digital volume correlation (DVC) techniques. Here we combine in situ laminography (allowing us to observe the microstructure evolution during sheet loading) and DVC, which has recently been demonstrated to yield trustworthy
measurements at relevant spatial resolutions [35]. DVC is the 3D extension of 2D digital image correlation [36], both based on the hypothesis of the conservation of grey levels in digital 2D or 3D images [36, 37]. 2D-DIC has been used to analyse ductile tearing and shown localised deformation bands [38], but this has been based on surface measurements only, omitting the triaxial stress effects of fundamental importance to ductile failure [39, 40].
Most DVC approaches reported to date are local, i.e. independent sub-volumes are registered to measure their average displacements [41, 42]. In the following analyses, a global approach to DVC will be used in which the displacement field parameterization is identical to that used in finite element modelling [43]. The present case is particularly difficult since the volume fraction of secondary phases used as optical 3D markers in the global registration is less than 1 vol.% and the global approach may be beneficial for finding the displacement field as the continuity requirement provides a regularisation to the DVC registration. An initial
feasibility study confirmed that global DVC measurements are possible even under (similar) very difficult conditions (i.e. poor natural image contrast and artefacts related to 3D imaging and in particular laminography [35]).
The main objective of this work is to assess the interactions and causality of
deformation and damage during ductile fracture of thin metallic plates. In situ laminography and digital volume correlation are combined to simultaneously measure the quantities and to identify what occurs first, namely, strain localisation or damage that leads to local material softening. Material, laminography, mechanical experiment and digital volume correlation methods are detailed. Subsequently results are shown in terms of strain field evolution and 3D damage evolution. The results are compared to full 3D simulations using i) von Mises’ plasticity, ii) GTN-type model, and discussed showing the challenges for capturing in simulations the sequence of phenomena observed experimentally.
2. Experimental.
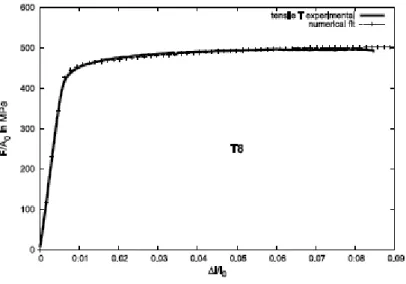
The investigated material was an Al-Cu-Li alloy (AA2198) in an artificially aged condition, with yield strength of ~ 440 MPa and ultimate tensile strength of ~ 500 MPa, i.e. with relatively low work hardening. The stress strain curve for T loading is given in Fig. 2 along with the numerical fit obtained using von Mises’ plasticity.
Fig. 2: Engineering stress-strain curve for a test on a flat specimen, simulated stress strain curve
The isotropic hardening law is given by
1 (1 ) (1 )
) ( 1 2 2 1 0 p k p k e K e K R p R (1)where R0, K0, K1, k1, K2, k2 are material dependent parameters. The identified parameters are
given in Table 1.
Table 1: mechanical parameters of 2198-T8 aluminium alloy
Elastic-plastic behavior
E in GPa ν R0 in MPa K1 k1 K2 k2
74 0.3 420 0.087 643 0.293 16.7
Plastic flow Von
Mises
The material has moderate texture and hardly any anisotropy measured in stress-strain curves in contrast to the results for 2198 material with fully fibrous grain structure [44]. The composition in wt.% of the studied AA2198 aluminium alloy is 2.9-3.5 Cu, 0.8-1.1 Li, 0.25-0.8 Mg, 0.1-0.5 Ag, 0.04-0.18 Zr, balance: Al. This material belongs to the latest generation of Al-Cu-Li alloys and was produced by Constellium and it is industrially used in
applications such as commercial aircrafts due to its low density and enhanced mechanical and corrosion properties. Major efforts are currently made for the production of this material. The latter was provided in its recrystallized state and after an artificial ageing treatment (T8) generating nanometric hardening precipitates. The material processing directions are rolling direction (L) transverse direction (T) and the short-transverse direction in the through
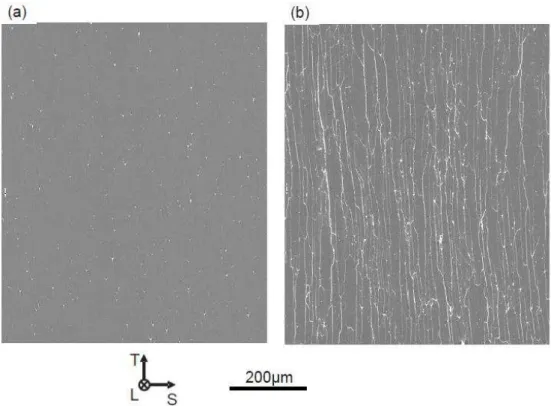
thickness (S). Figure 3a shows a typical T-S section of the material obtained by tomography. Intermetallic particles are seen in white and the aluminium matrix in grey. The size of this section in the T-S plane corresponds to the size of the region that will be investigated by DVC. The intermetallic particle volume fraction (used as optical markers here) was found to be ~ 0.3-0.4 %. There is almost no initial porosity (black) seen (<0.03 vol.%) for this
material in contrast to other 2XXX Al-alloys for aerospace applications [30]. The grain structure of the same location revealed by scanning the same location after gallium wetting [45] is shown in Fig. 3 b. The typical number of grains is shown in a section having the size of the regions that will be investigated by DVC. It is found that in the thickness direction at least 40 grains are present. The typical grain size in the through thickness direction is ~10-30 µm.
Fig. 3: 2D section of synchrotron tomography data of a) the initial microstructure in the T-S plane b) same
location after gallium wetting highlighting high angle grain boundaries
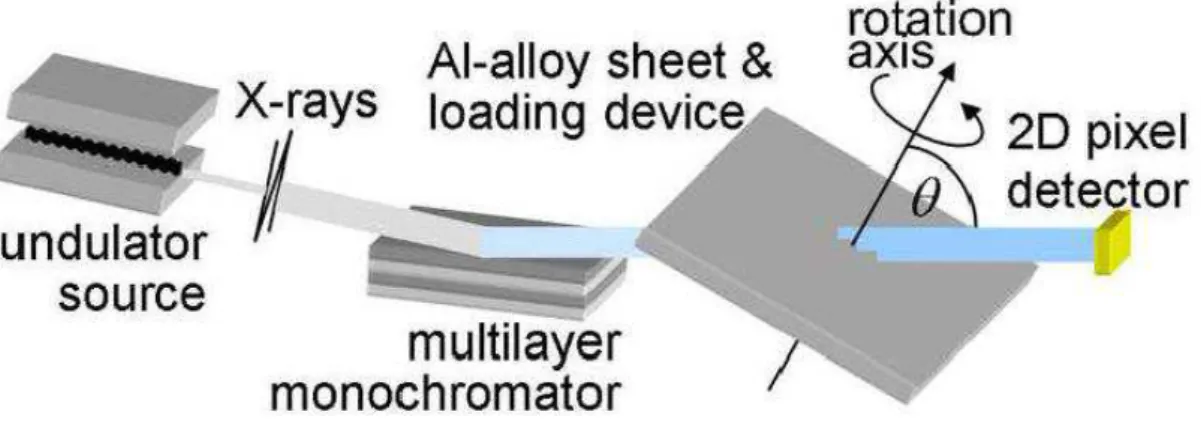
Laminography imaging was performed on the laminography instrument installed by the Karlsruhe Institute of Technology at beamline ID19 [46] of the European Synchrotron Radiation Facility (ESRF, Grenoble, France) similar to the conditions described by Morgeneyer et al. [35]. Synchrotron laminography benefits from various contrast modes, including propagation-based phase contrast [47] used herein in addition to the conventional absorption employed in laboratory X-ray imaging. For large source-specimen distances, large sample environments (such as tensile testing devices) can be employed for high-resolution imaging without risking a collision during the scanning motion. Similar to tomography, a series of digital images is taken while rotating the sample around the
laminographic axis. The latter is inclined with respect to the transmitted beam at an angle 0° < θ < 90°, see Fig. 4. With the flat specimen oriented approximately perpendicular to the rotation axis, the average beam transmission can be optimised during the entire
laminographic scan. Using filtered back-projection or algebraic techniques, different planes or complete 3D images with down to sub-micrometre resolution zoomed onto the large specimen can be reconstructed by a single scanning motion.
Fig. 4: Schematic drawing of a synchrotron laminography setup
An inclination angle of the specimen rotation axis of about 25° with respect to the beam normal ( 65 °) was chosen as well as a monochromatic beam of 25 keV X-ray energy [30]. Volumes were reconstructed from 1500 angularly equidistant radiographs; the exposure time of each projection was 250 ms. The scanned region was ~ 1 mm3 in volume
with a voxel size of 0.7 µm. The minimum specimen to detector distance was 70 mm leading to relatively strong edge enhancement [48] due to phase contrast. The resulting strongly contrasted edges facilitated the detection of voids and damage. For easier data handling, all 3D images consisting of 32-bit floating point values were converted to 8-bit grey level 3D images using the same linear dependence. As the same affine transformation is performed after reconstruction, the grey levels between the images remained comparable. The final reconstructed volumes have a size of 2040 × 2040 × 2040 voxels. However, only the voxels where all projections contribute to the reconstruction exhibit all the directional information available and show similar noise statistics have been considered herein.
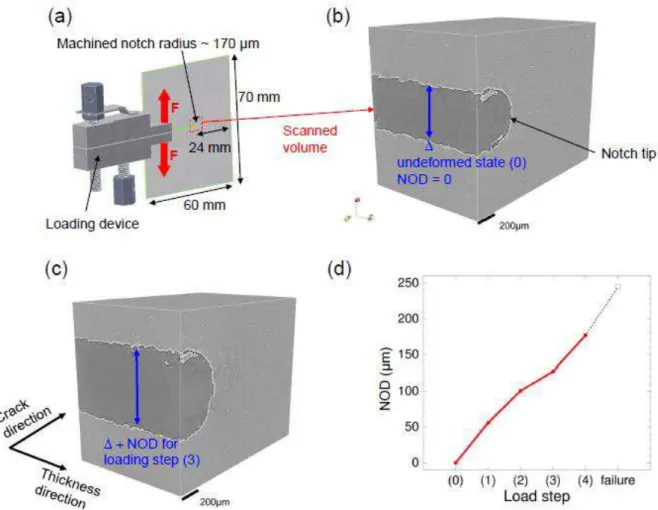
To investigate strain and damage interactions in situ, a loading device was adapted to the environment given by the laminography scanning geometry, see Fig. 5a. In particular, the device was designed to present a low profile perpendicular to the sample plane, avoiding obstruction of the beam during rotation. The screws allow a stepwise notch opening displacement to be prescribed [23]. Before each ‘load step’, the region ahead of the notch was scanned by laminography. A load step consisted of turning the 2 screws of the loading device leading to incremental openings of the notch, i.e. a stepwise monotonic and quasi-static loading was applied. The specimen (with dimensions 60 mm × 70 mm × 1 mm) contained a round notch with a ~ 0.17-mm radius and a remaining 24-mm ligament. The loading configuration was T-L. Being close to standard tearing test geometries, this specimen provides relevant engineering test conditions.
The region ahead of the notch was loaded in tension and bending. A simple anti-buckling device (flat plates) was used to limit out-of-plane displacements. A zone of about 1 mm3 ahead of the notch was imaged by computed laminography at micrometre resolution
(0.7 µm voxel size) for each load step (see Fig. 5). This zone is where the flat-to-slant crack transition had previously been observed to take place in this material for these loading conditions (see also Fig. 1). Figure 5b shows a 3D reconstructed volume of the investigated region in the specimen in the initial unloaded state. The notch can clearly be seen and the notch opening is shown in Fig. 5c for load step (3). The applied Notch Opening
Displacement (NOD) steps are given in Fig. 5d, where the notch opening was measured in the notch at a point ~ 200 µm behind the original notch tip using the laminography images. Early stages of deformation (steps (1) to (4)) were investigated by DVC.
Fig. 5: Characterisation of the specimen loading (a) Experimental setup with 1-mm thick notched aluminium
specimen (b) Reconstructed 3D laminography data around the notch tip in the reference configuration and (c)
deformed configuration (d) Load steps as characterized by the notch opening displacement
For digital volume correlation a volume of interest 1500 × 750 × 1250 voxels (≈ 1050 µm × 525 µm × 875 µm) has been extracted from the scanned volume. Within this volume a Region of Interest of 1184 × 512 × 992 voxels (≈ 830 µm × 360 µm × 700 µm) has been considered for correlation purposes and has been discretized with 32-voxel elements. The choice of the element size in a global C8-DVC results from a compromise between
measurement uncertainty and spatial resolution [49] (here twice the element size, i.e. ~45 µm). To evaluate the resolution of the measurement technique, two scans of the undeformed configuration were reconstructed when a small motion was prescribed between the two acquisitions. For 32-voxel (~ 22 µm) elements, the standard displacement resolution was
found to be of the order of 0.10 voxel, and the corresponding standard strain resolution less than 0.09 %. This is the largest level below which the measurement can be confused with noise. Based upon these results, the convergence criterion of the correlation calculations, which corresponds to the mean displacement increment between two consecutive iterations, was chosen to be equal to 10-4 voxel. It was checked that the mean correlation residuals had
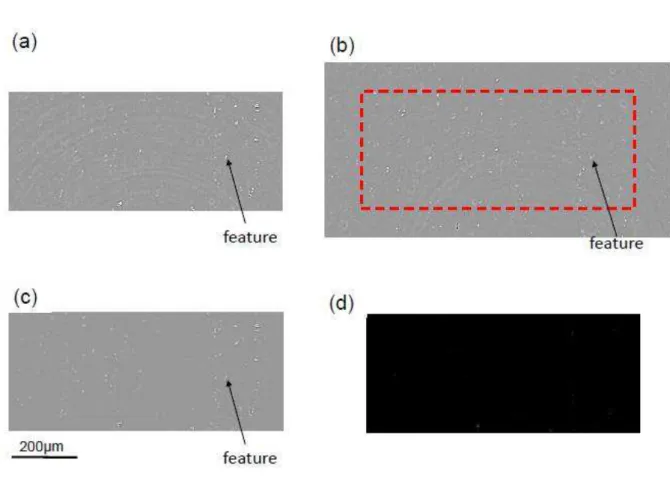
reached a steady state for this criterion. The results were also checked by computing the correlation residuals voxel-wise, and their average value. They consist of the absolute grey level difference of the volume in the reference configuration and that in the deformed
configuration corrected by the measured displacement field (see Fig. 6). The mean and local levels were similar to those found by considering two subsequent acquisitions in which no deformation of the sample occurred.
Fig. 6: 2D section of laminography data and DVC results of: (a) initial undeformed volume (step (0)), (b)
deformed volume for load step (3), (c) deformed volume for load step (3) corrected by the 3D displacement field
The correlation analyses consisted of estimating the total displacement field for each analysed step with respect to the reference configuration [35]. From these Lagrangian measurements, the incremental displacement fields are directly given by the total
displacement difference corresponding to two subsequent steps. The Green-Lagrange strain fields are estimated either with the total displacement fields, or with the incremental
displacement fields. In both cases, the mean values per C8 element are reported. For the displacement field between the initial state (0) and load step (4) the direct correlation could not yield a converged solution as strains are very high and damage nucleation started to set in. Therefore the converged displacement fields between load step (0) to (3) and (3) to (4) have been cumulated.
3. Results.
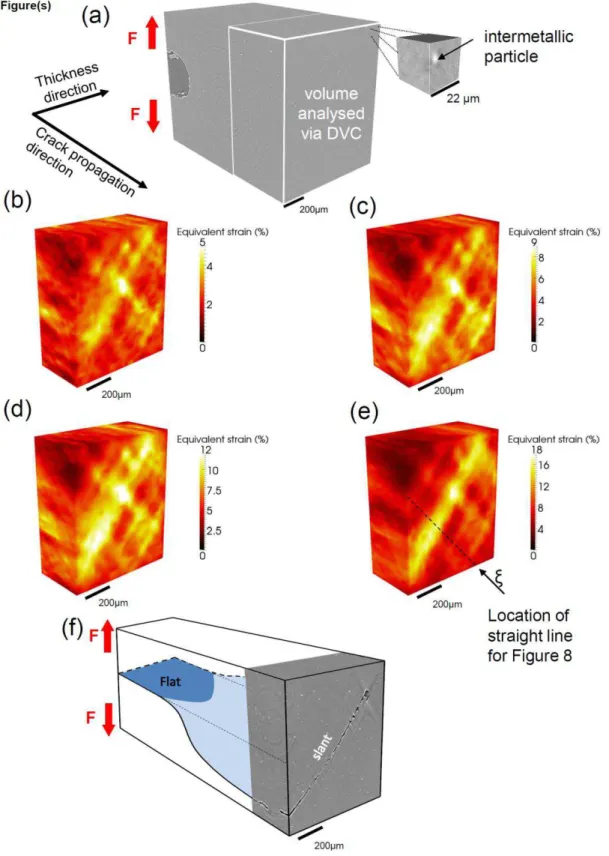
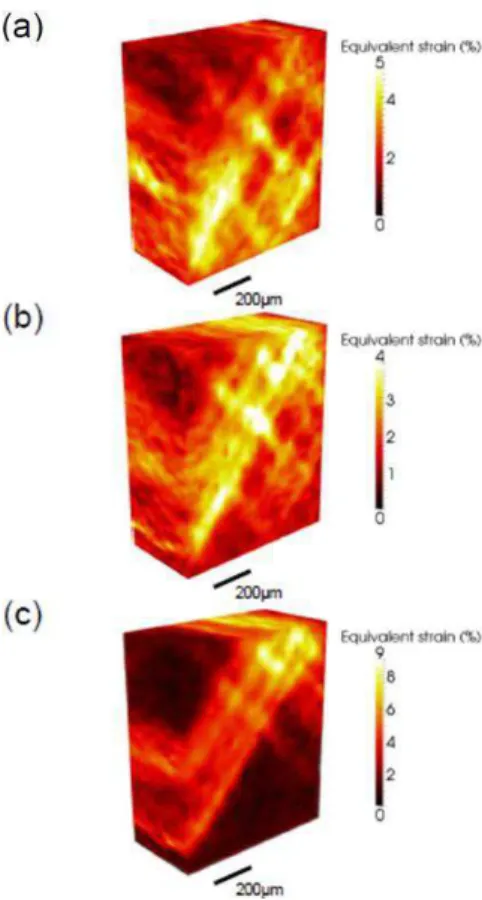
In Fig. 7 the change in the strain distribution over the load history and the final crack path is shown. Figure 7a shows a 3D rendering of the undeformed material and the surface
normal to the crack propagation direction where the strain fields will be investigated. The analysed volume for digital volume correlation is outlined in white. A magnified cube corresponding to a C8 element (i.e. 8-noded cubes) with a length of 32 voxels ( 22 µm) is shown in Fig. 7a. Intermetallic particles are evident in white within the microstructure (0.3 - 0.4 vol.%). These particles are known to contain iron, having a higher atomic number than aluminium and therefore yielding greater attenuation. They provide a ‘natural’ 3D image contrast pattern for DVC techniques to measure displacement and hence strain fields.
Figures 7b-e show von Mises’ equivalent strain fields for a correlation between the undeformed state and the following load steps on the outer surfaces of the analysed volume. These von Mises’ equivalent strains are chosen here as they give a non-directional measure of the strain, hence enabling a good representation of strain localisation. In Fig. 7b a correlation
result is shown between the unloaded material and the first load step (1). Two orthogonal strain localisation bands are observed, which form an X on the surface that is oriented normal to the crack propagation direction. The same observation applies when inner cuts are
analysed. The strain levels are moderate (i.e. 3-% average) at this point in the investigated region. However, the levels in the bands are at least one order of magnitude greater than the standard strain resolution (i.e., 0.1 %, see below). Consequently, the observed fluctuations are not due to measurement uncertainties but are physical. At this stage no damage
nucleation is seen via the laminography technique that allows for sub-micrometre detection of damage due to the contribution of edge enhancing phase contrast imaging [48], see also Fig 8. The localisation bands continue to grow in strain magnitude and remain active for load step (2). Some smaller localisation bands are also active (Fig. 7c). Between the load steps (0) and (3) the localisation becomes more pronounced along the long band crossing the volume from the lower left to the upper right part of the region of interest (ROI, see Fig. 7d). A narrowing of the localisation of this same band is seen for the subsequent load step (4), see Fig. 7e, together with an increase in von Mises’ equivalent strain level. Figure 7f shows the final slanted crack for a higher local NOD and it precisely follows the strain localisation band that had appeared already during the very first load step.
Fig. 7: 3D von Mises’ equivalent strain fields and final crack pattern in the material bulk. (a) illustration of the chosen view and a 32 voxel correlation element; strain field obtained by digital volume correlation between the
unloaded state (0) and: (b) load step (1), (c) load step (2), (d) load step (3), (e) load step (4); (f) reconstructed
laminography data of the cracked specimen in conjunction with a schematic drawing of the flat-to-slant crack
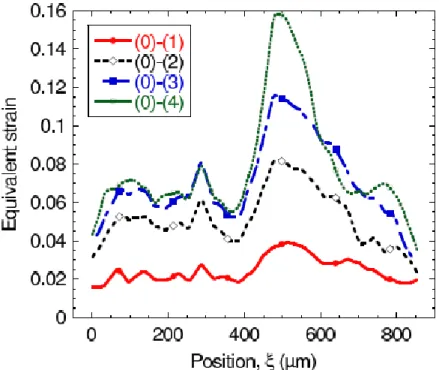
The curves in Fig. 8 show von Mises’ equivalent strain profiles for the different load steps along a straight line that is oriented perpendicular to the main localisation band (Fig 7e). The correlations were performed comparing to the initial undeformed state similar to the results presented in Fig. 7. The equivalent strain magnitude in the main localisation band is about twice as high as in the surrounding area for load steps (1), (2) and (3). For load step (4), the strain activity is mostly localised in the band. In the surrounding area, hardly any strain increase is measured.
Fig. 8: Equivalent von Mises’ strain measured by DVC along line perpendicular to the strain localisation band (see Fig. 7e for line location) for strain fields obtained for comparison with undeformed state (0) and the
subsequent load steps (defined in Fig. 5d)
Figure 9 shows the incremental equivalent strain fields for the previously described load steps. The incremental activity of the localisation band can be seen more clearly in this representation than for the cumulated equivalent strain fields (Fig. 7), which, in contrast, are all compared to the initial unloaded state (the incremental strain field for correlation between the undeformed state and the load step (1) is given in Fig. 7b). For the incremental strain field between steps (1) and (2) the main localisation band is active but more so in the lower
part of the ROI than in the upper part (Fig. 9a). Some strain localisation bands normal to the main one become active. In Fig. 9b, the incremental strain field between steps (2) and (3) is shown. It can be seen that most of the strain activity is now localised in the strain band that will cause slant fracture (Fig. 7f). The strong strain activity between load step (3) and (4) is shown in Fig. 9c. The strain remains localised in the same slanted band and mostly in the upper part.
Fig. 9: Incremental von Mises’ equivalent strain fields obtained by DVC in the bulk material between (a) load step (1) and (2), (b) load step (2) and (3), (c) load step (3) and (4)
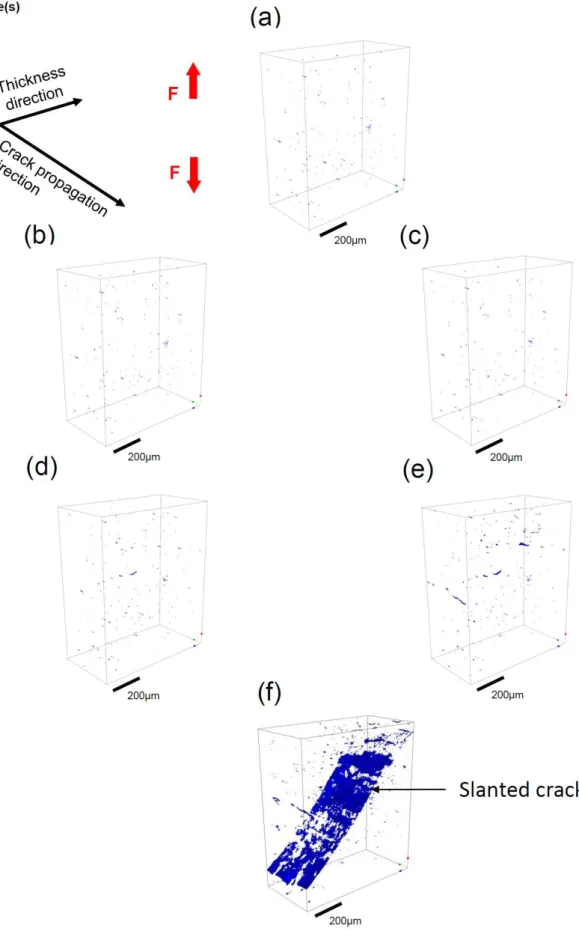
Figure 10 shows the 3D rendering of initial porosity and the void/damage evolution over the loading history up to final slanted fracture. Figure 10a shows the initially present porosity. It should be noted that the intrinsic void content of the parent material is
‘exaggerated’ by the 3-D nature of Fig. 10, representing the void content of a thick slice of material. After the first and second loading step (Figs. 10 b-c) no evolution of damage is
seen. However, the strain is already localised for these load steps (Fig. 7). For load steps (3) and (4) (Figs. 10 d-e) some damage appears in the region where the strains are localised. However, the void volume fraction is still very limited and the distance of the individual voids is of the order of tens of micrometres. Final failure is characterised by a burst of damage that leads to the creation of a slanted crack that requires little energy to be added to the system by loading (Fig. 10f).
Fig. 10: 3D rendering of damage/void evolution in the laminography image investigated by DVC for: (a) the
unloaded state, (b) load step (1), (c) load step (2), (d) load step (3), (e) load step (4), (f) final load step, slanted
2D sections of in-situ laminography data normal to the crack propagation direction in the centre of the investigated volume are shown in Fig. 11 to identify the failure mechanisms in conjunction with the microstructure for the different load steps. The intermetallic particles can be seen in white. Hardly any porosity is observed in the undeformed configuration (Fig. 11a). For the first loading step no damage nucleation or growth are seen, which is consistent with the 3D damage rendering. After loading step (2) one void is seen to nucleate but all the other intermetallic particles appear uncracked in this section. In loading step (3) (Fig 11d) a small shallow crack appears in the centre of the section that could be a grain boundary crack [50]. This small crack grows during loading step (4) and some intermetallic particle damage is observed around two particles in the lower part of the section (Fig. 11e) but the overall damage fraction is extremely low as compared to other aluminium alloys studied by the same method [51]. In the last step final fracture occurs but the intergranular feature is not even included in the crack path. The crack path appears transgranular (i.e., very straight) and not affected by the damage features that nucleated during the earlier steps.
Fig. 11: 2D section of in-situ laminography data in the centre of region investigated by DVC normal to the
crack propagation direction a) initial state (b) load step (1), (c) load step (2), (d) load step (3), (e) load step (4),
4. Discussions.
To interpret further the experimental results two full 3D finite element calculations have been carried out. In the first calculation von Mises’ plasticity and isotropic hardening are used. The hardening curve has been identified on the stress strain curve shown in Fig. 2. In the second computation a classical GTN model is used assuming that all intermetallic particles are voids (initial volume fraction: 0.34%), which is an exaggerated assumption as the intermetallic particles are seen to fracture only after several percent of strain in the laminography images.
Figure 12a shows the full 3D mesh and the displacement field after some loading. Figure 12 b shows the plastic zone around the notch. In Fig. 12 c-f the results in terms of cumulated plastic strains in the same ROI as investigated during the experimental DVC assessment are shown to be compared to Fig.7 for the different load steps. The difference between experiment and simulation is striking. While strain concentration in bands occurs from early stages onwards in the experiment, the strain concentration in the simulation is circular and remains circular up to elevated levels of equivalent strain.
Fig. 12: 3D FE simulation results using von Mises’ plasticity and isotropic hardening, a) full 3D FE mesh and displacement field in loading direction b) typical plastic zone shape around the notch with ROI location in white
c)-f) equivalent strain fields in a region corresponding to the ROI in the experiment and for loading
A calculation using von Mises’ plasticity and the relatively low hardening curve is not sufficient to reproduce the localisation bands. To assess the theoretical effect of porosity the results using a classical GTN model are given in Fig. 13. The equivalent strain fields for the GTN calculation do not reproduce the strain localisation bands either, as also seen by
Morgeneyer et al. [23].
Fig. 13: 3D FE simulation results using GTN model, a)-d) equivalent strain fields in a region corresponding to
the ROI in the experiment and for loading corresponding to load steps 1-4 in the experiment
The experimental results presented so far clarify the origin of the slanted localised fracture. From the very beginning of loading, i.e. at the first analysed load step, slanted and localised strain bands are present and determine the crack and damage path. During the early loading stages no intermetallic particle damage and no void growth is seen with the sub-micrometre resolution used herein. Thus damage nucleation and growth cannot be responsible for the initiation of slant fracture. The resolution issue raises the question to whether localisation may have been affected by the presence of undetected voids. However, it is unlikely that damage has nucleated from nanometric particles (dispersoids) since it has been shown that
this would need a much higher strain than the one measured herein at early loading stages [52]. During subsequent loading stages strains continuously increase in a localised manner within the slanted bands. On the contrary, damage nucleation in the form of voids is seen to be very limited during loading. Some flat cracks nucleate that may be attributed to grain boundary ductile failure. Thus the final failure during which a crack forms only requires a very small load and associated energy increase. During this final process, the instantaneous nucleation and coalescence of sub-micrometre voids in a narrow sheet lead to the main crack as shown by fractography (see Fig. 14).
Fig. 14: Fractography taken in the slant fracture region showing nanometric dimples (at about 1 mm from the
notch of a different specimen)
To see whether the understanding gained from this work can be extended to more general types of materials/contexts the role of work hardening and initial porosity size/void volume fraction should be investigated. It is known that work hardening tends to inhibit
strain localisation [5]. The material investigated by Morgeneyer et al. [35] is a candidate material to assess the effect of initial porosity. The effect of work hardening may also be assessed using the present material with different heat treatment conditions.
The findings of this work indicate that the challenge in modelling and computer simulations must now be the reproduction of the early strain localisation in slanted strain bands. These strain localisation bands develop over several tens of grains (see Fig. 7). Here the average grain size in the thickness direction is about 10-30 µm and the localisation band covers at least 700 µm, i.e. more than 35 grains. That means that a continuum mechanics approach may be considered. As shown above, finite element calculations using most established von Mises’ continuum plasticity model accounting the relatively low work hardening cannot reproduce such bands as seen in the present calculations. Accounting for voids in a GTN model does not manage to reproduce the bands either.
Further possible reasons explaining the localised slant bands may e.g. be the remaining points studied in by Needleman and Tvergaard [8] and others:
Strain rate effects. In particular features that are the result of the Portevin-Le-Chatelier effect may play a role in Al-alloys and be at the origin of localised bands in alloys [24, 53].
The shape of the macroscopic yield surface:
o A Mohr Coulomb yield surface may be used (i.e., Rousselier and Luo [7] managed to reproduce slanted strain bands).
o An anisotropic yield surface may be used [54]. The use of crystal plasticity models [55] may be a candidate to reproduce the localised strain bands observed herein but the computational effort makes fracture simulations difficult at present. [55]
5. Conclusions.
The combination of in situ laminography and digital volume correlation provides a successful approach for studying non-destructively damage and strain localisation
phenomena at the micrometre-scale in sheet-like samples. It has enabled the identification of the role of strain and damage during localised slant fracture within thin (1 mm) recrystallized AA2198 T8 aluminium plates for aerospace structures at ~800µm from the notch. The material contains very little initial porosity (volume fraction < 0.03%). For this material it is concluded that early strain localisation in slanted bands is at the origin of slant ductile fracture as damage initiation at intermetallic particles and void growth from initial and nucleated porosity occurs at later stages. Finite element calculations using von Mises’ plasticity with relatively low hardening or GTN model do not capture the early localisation bands.
Early damage mechanisms in the slant fracture zone are identified with void nucleation and possibly some very limited grain boundary fracture but the final fracture seems almost unaffected by the precursor damage and follows a slanted shallow path.
The present approach provides the opportunity for a better understand of the physical mechanisms leading to strain localisation and failure in ductile materials with sufficient natural 3D contrast to provide markers for image correlation purposes. The techniques presented herein can be used for the understanding of strain and damage interactions for different loading conditions and associated stress states typical of engineering applications.
Acknowledgements: The financial support by the Fédération Francilienne de Mécanique is
gratefully acknowledged. Constellium CRV is acknowledged for material supply. We would like to acknowledge ESRF for providing beamtime (experiment MA1006).
The help of Dr. Henry Proudhon (Mines ParisTech) with 3D visualisation of the measurements is greatly appreciated.
Appendix. GTN simulations
Gurson’s plastic potential reads
where is the flow stress of the matrix, f von Mises’ equivalent stress, eq the trace of kk the stress tensor, and f the void volume fraction to describe the increased damaging effect
of voids during coalescence [17] using the acceleration factor δ from a critical void volume fraction fc onwards. To enhance Gurson’s model two fitting parameters (q ,1 q ) influencing 2 the void growth [17] have been used in addition to the classical parameters (see Table 2). Table 2: GTN parameters of 2198-T8 aluminium alloy
Void growth
q1 q2 fc δ f0 Element
size
1.5 1.0 4.5% 3.0 0.34% 50 µm
A Z-set implicit finite element code has been used [56]. The boundary conditions were as follows. The U2 displacement was blocked for the lower edge. For the upper edge a given U2 displacement was applied. One node on the right side of the specimen
(compression zone) was blocked in U1 and U3 directions. For the GTN model classical parameters were used (see Table 2). The initial void volume fraction was 0.34%, which corresponds to the particle volume fraction measured on tomography data.
0 1 2 cosh 2 *2 2 1 2 * 1 2 2 q f q q f f kk f eq
(A1)References
[1] Pardoen T, Hachez F, Marchioni B, Blyth PH, Atkins AG. J. Mech. Phys. Solids 2004;52:423.
[2] Rice JR, Tracey DM. J. Mech. Phys. Solids 1969;17:201. [3] Bao Y, Wierzbicki T. Int. J. Mech. Sci 2004;46:81. [4] Bao Y, Wierzbicki T. Eng. Fract. Mech. 2005;72:1049.
[5] Rice JR. The Localization of Plastic Deformations. In: Koiter WT, editor. Theoretical and Applied Mechanics. North-Holland, 1976. p.207.
[6] Mahgoub E, Deng X, Sutton MA. Eng. Fract. Mech. 2003;70:2527. [7] Rousselier G, Luo M. Int. J. Plasticity 2013.
[8] Needleman A, Tvergaard V. Appl. Mech. Rev. 1992;45:S3.
[9] Huang Y, Hutchinson JW. A model study of the role of nonuniform defect destribution on plastic shear localization. In: Embury JD, Thompson AW, editors. Ashby
symposium: The modelling in Material Behavior and its relation to design, 1990. [10] Fleck NA, Hutchinson JW, Tvergaard V. J. Mech. Phys. Solids 1989;37:515. [11] Besson J. Int. J. Damage Mech. 2010;19:3.
[12] Besson J, McCowan CN, Drexler ES. Eng. Fract. Mech. 2013;104:80. [13] Chen CQ, Knott JF. Met. Sci. 1981;15:357.
[14] McVeigh C, Vernerey F, Liu WK, Moran B, Olson G. J. Mech. Phys. Solids 2007; 55:225.
[15] Needleman A, Rice JR. Limits to Ductility Set by Plastic Flow Localization. In:
Koistinen DP, Wang N-M, editors. General Motors Research Laboratories Symposium: Mechanics of Sheet Metal Forming, Plenum Press, 1977. p. 237.
[16] Gurson AL. ASME J. Eng. Mat. Techn. 1977;99:2. [17] Tvergaard V, Needleman A. Acta Metall. 1984;32:157. [18] Rousselier G. Nucl. Eng. Design 1987;105:97.
[19] Lemaitre J. Nucl. Eng. Design 1984;80:233.
[20] Besson J, Steglich D, Brocks WB. Int. J. Solids Struct. 2001;38:8259. [21] Xue L. Int. J. Solids Struct. 2007;44:5163.
[22] Nahshon K, Hutchinson JW. Eur. J. Mech. A/Solids 2008;27:1. [23] Morgeneyer TF, Besson J. Scripta Mat. 2011;65:1002.
[24] Wang H, Berdin C, Mazière M, Forest S, Prioul C, Parrot A, Le-Delliou P. Scripta Mat. 2011;64:430.
[25] Flannery BP, Deckman HW, Roberge WG, D'Amico KL. Science 1987;237:1439. [26] King A, Johnson G, Engelberg D, Ludwig W, Marrow J. Science 2008;321:382. [27] Bale HA, Haboub A, Mc Dowell AA, Nasiatka JR, Parkinson DY, Cox BN, Marshall
[28] Helfen L, Baumbach T, Mikulík P, Kiel D, Pernot P, Cloetens P, Baruchel J. Appl. Phys. Lett. 2005;86:071915.
[29] Moffat AJ, Wright P, Helfen L, Baumbach T, Johnson G, Spearing SM, Sinclair I. Scripta Mat. 2010;62:97.
[30] Morgeneyer TF, Helfen L, Sinclair I, Proudhon H, Xu F, Baumbach T. Scripta Mat. 2011;65:1010.
[31] Ziedses des Plantes BG. Acta Radiol. 1932;13:182.
[32] Helfen L, Myagotin A, Mikulík P, Pernot P, Voropaev A, Elyyan M, Di Michiel M, Baruchel J, Baumbach T. Rev. Sci. Instrum. 2011;82.
[33] Xu F, Helfen L, Baumbach T, Suhonen H. Optics Express 2012;20:794.
[34] Oddershede J, Camin B, Schmidt S, Mikkelsen LP, Sørensen HO, Lienert U, Poulsen HF, Reimers W. Acta Mat. 2012;60:3570.
[35] Morgeneyer TF, Helfen L, Mubarak H, Hild F. Exp. Mech. 2013;53:543.
[36] Sutton MA, Orteu J-J, Schreier H. Image correlation for shape, motion and deformation measurements: Basic Concepts, Theory and Applications. New York, NY (USA): Springer, 2009.
[37] Hild F, Roux S. Digital Image Correlation. In: Rastogi P, Hack E, editors. Optical Methods for Solid Mechanics. A Full-Field Approach. Weinheim (Germany): Wiley-VCH, 2012. p.183.
[38] Héripré E, Dexet M, Crépin J, Gélébart L, Roos A, Bornert M, Caldemaison D. Int. J. Plasticity 2007;23:1512.
[39] Sutton MA, Helm JD, Boone ML. Int. J. Fract. 2001;109:285. [40] Lan W, Deng X, Sutton MA, Chen C-S. Int. J. Fract. 2006;141:469. [41] Bay BK, Smith TS, Fyhrie DP, Saad M. Exp. Mech. 1999;39:217. [42] Smith TS, Bay BK, Rashid MM. Exp. Mech. 2002;42:272.
[43] Roux S, Hild F, Viot P, Bernard D. Comp. Part A 2008;39:1253.
[44] Chen J, Madi Y, Morgeneyer TF, Besson J. Comp. Mat. Sci. 2011;50:1365. [45] Ohgaki T, Toda H, Sinclair I, Buffière J-Y, Ludwig W, Kobayashi T, Niinomi M,
Akahori AF. Mat. Sci. Eng. 2005;A06:261.
[46] Weitkamp T, Tafforeau P, Boller E, Cloetens P, Valade J-P, Bernard P, Peyrin F, Ludwig W, Helfen L, Baruchel J. Status and evolution of the ESRF beamline ID19. ICXOM 2009, vol. 1221: AIP Conf. Proc., 2010. p.33.
[47] Helfen L, Baumbach T, Cloetens P, Baruchel J. Appl. Phys. Lett. 2009;94.
[48] Cloetens P, Pateyron-Salomé M, Buffière J-Y, Peix G, Baruchel J, Peyrin F, Schlenker M. J. Appl. Phys. 1997;81.
[49] Limodin N, Réthoré J, Adrien J, Buffière J-Y, Hild F, Roux S. Exp. Mech. 2011;51:959.
[50] Morgeneyer TF, Starink MJ, Wang SC, Sinclair I. Acta Mat. 2008;56:2872. [51] Shen Y, Morgeneyer TF, Garnier J, Allais L, Helfen L, Crépin J. Acta Mat.
2013;61:2571.
[53] De Codes RN, Hopperstad OS, Engler O, Lademo OG, Embury JD, Benallal A. Metall. Mater. Trans. A-Phys. Metall. Mater. Sci. 2011;42A:3358.
[54] Barlat F, Lege DJ, Brem JC. Int. J. Plast. 1991;7:693. [55] Asaro RJ. J. Appl. Mech. 1983;50:921.