HAL Id: inria-00335928
https://hal.inria.fr/inria-00335928
Submitted on 31 Oct 2008
HAL is a multi-disciplinary open access
archive for the deposit and dissemination of
sci-entific research documents, whether they are
pub-lished or not. The documents may come from
teaching and research institutions in France or
abroad, or from public or private research centers.
L’archive ouverte pluridisciplinaire HAL, est
destinée au dépôt et à la diffusion de documents
scientifiques de niveau recherche, publiés ou non,
émanant des établissements d’enseignement et de
recherche français ou étrangers, des laboratoires
publics ou privés.
To cite this version:
Julien Blanchard, Bruno Pinaud, Pascale Kuntz, Fabrice Guillet. A 2D-3D visualization support
for human-centered rule-mining.
Computers and Graphics, Elsevier, 2007, 31 (3), pp.350-360.
�10.1016/j.cag.2007.01.026�. �inria-00335928�
human-centered rule-mining
Julien Blanchard, Bruno Pinaud, Pascale Kuntz, Fabrice Guillet
KnOwledge & Decision Team (KOD)
LINA – FRE CNRS 2729, Polytechnic School of Nantes University, France
Abstract. On account of the enormous amounts of rules that can be produced by data mining algorithms, knowledge post-processing is a difficult stage in an association rule discovery process. In order to find relevant knowledge, the user needs to rummage through the rules. To make this task easier, we propose a new interactive mining me-thodology based on well-adapted dynamic visual representations. It allows the user to drive the discovery process by focusing his/her attention on limited subsets of rules. We have implemented our methodology with two complementary 2D and 3D visualization supports. These implementations exploit the user’s focus to guide the generation of the rules by means of a specific constraint-based rule-mining algorithm.
Keywords: knowledge discovery in databases, association rules, interactive visualiza-tion, interactive mining, rule focusing
1. Introduction
Although during the first decade of Knowledge Discovery in Databases (KDD) most of the research works were concerned with the development of efficient automatic algorithms able to deal with large amount of data, today the user’s role has become a major concern. This need for integration has recently lead to the design of many visualization tools (Fayyad et al, 2001) (Grinstein, 1996). Traditional visualization techniques in KDD are used essentially in the stages which precede and follow the data mining automatic procedures. Upstream the process, they assist the selection and pre-processing tasks. Downstream, they help the users to present the results intelligibly in order to make their interpre-tation easier. Besides, stemming from exploratory data analysis (Tukey, 1977) (Cleveland, 1985), the so-called ”visual data mining” has been developed to high-light the intrinsic properties of data and assist hypothesis generation (Keim and Kriegel, 1996). The challenge is here the development of representations of huge data sets well-adapted to the human perception abilities (Spence, 2000).
early 90s in the seminal paper of Frawley et al (1991): in the part dedicated to the future directions in KDD, they pointed out that the user has to be integra-ted in the ”discovery loop” in order to combine the human subjectivity and the machine processing capacities.
In this paper, we focus on one of the most popular challenges in KDD, the association rule discovery, and we propose a new interactive mining environment based on visual representations where the user acts as an exploration heuristics. Introduced in KDD in the early 90s by Agrawal et al (1993) to simply express implicative tendencies between conjunctions of items (binary attributes) in a relational database, the association rules have rapidly known an intensive use. An association rule of the form X → Y means that most of the records which verify X in the database generally verify Y too. For instance, in market data analysis, an association rule pizza, crisps → beer means that if a customer buys a pizza and crisps then (s)he most probably buys beer too. Many automatic al-gorithms have been proposed in the literature to extract the potentially relevant association rules from large databases (e.g. Hipp et al (2000) for a survey). Ho-wever, it is now well-known that in real-life situations they produce a prohibitive number of rules for a direct analysis in extenso. This may be explained by the unsupervised nature of the task. In a rule mining process, the user can neither a priori express his/her requests explicitly in the data terminology nor specify the endogenous variables. Thus, the automatic algorithms compute all the valid associations existing in the database, and consequently generate an amount of rules exponentially growing with the number of items.
To overcome these difficulties, we propose to integrate a supervised phase by allowing the user to drive the discovery process via a well-adapted interactive interface. Previous works in knowledge discovery (Bhandari, 1994) and decision aid (Barthelemy and Mullet, 1992) have shown how the users focus on successive restrictive subsets of attributes to process information. From a cognitive point of view, the suggested explanation is the intensive resort to the short-term working memory. Consequently, our methodology allows the user to explore large rule sets by iteratively exploiting the information brought by limited subsets. More precisely, the architecture of our interactive process is structured around three connected components which dynamically evolve with the user’s requests: 1. a database which contains the studied data and additional tables to optimize
the response times;
2. a heuristics which computes in the database the rule subsets associated with the user’s requests –this heuristics is a local version of the Apriori algorithm (Agrawal and Srikant, 1994);
3. an interactive visualization support which allows the user to choose a subset of rules to be explored.
In this paper we detail the interaction process and we present two complementary interfaces: a 2D interface which represents the rules by a graph and a 3D interface which represents the rules by objects in virtual worlds. Section 2 presents the cognitive constraints of the user during the rule mining process and describes
the dynamic exploration methodology of the search space modeled here as a graph. Section 3 details the two interactive visualization supports. In section 4, we give an illustration of the rule mining process with the 3D visualization interface. In section 5, we present related works, and finally discuss in section 6 the complementarity between the 2D and 3D interfaces.
2. Dynamic exploration methodology
2.1. Cognitive hypotheses
On account of the human ”bounded rationality” hypothesis (Simon, 1979), a decision process can be seen as a search for a dominance structure. More precisely, the decision-maker faced with a set of multiattribute alternatives tries to find an alternative (s)he considers dominant over the others, i.e., an alternative (s)he thinks better than the others according to his/her current representation of the decision situation (Montgomery, 1983). This type of models of decision process can be transferred to the post-processing of association rules by considering the rules as a particular kind of alternatives with items and interestingness measures as attributes. According to Montgomery, the decision-maker isolates a limited subset of potentially useful alternatives and makes comparisons among them. This can be done iteratively during the decision process. More precisely, he has pointed out that: ”The decision process acquires a certain directionality in the sense that certain alternatives and attributes will receive more attention than others [...] The directionality of the process may be determined more or less consciously. Shifts in the directionality may occur several times in the process, particularly when the decision-maker fails to find a dominance structure”.
Furthermore, a KDD methodology called ”attribute focusing” has been pro-posed in (Bhandari, 1994). It results from experimental data concerning the user’s behavior in the discovery process. This methodology is based on a filter which automatically detects a small number of potentially interesting attributes. The filter guides the user’s attention on a small, and therefore more intelli-gible, subset of the database. The importance of focusing on a small number of attributes in human information processing has also been widely confirmed with works on decision strategies (cf. for example the moving basis heuristics in (Barthelemy and Mullet, 1992)). Indeed, on account of his/her limited cognitive abilities, the decision-maker examines only a small amount of information at each moment.
Taking these different works into account, the dynamic exploration metho-dology must enable the user to focus his/her attention on limited subsets of rules. Thanks to a visual representation which evolves interactively according to his/her requests, the user can navigate among the rules and make comparisons.
2.2. Dynamic exploration
2.2.1. The navigation space modeled as a graph
In our interactive exploration methodology, the search space is modeled as a graph. Among visualization techniques, graphs often have a privileged place, in particular for rule relationship representation. They can be used both as powerful
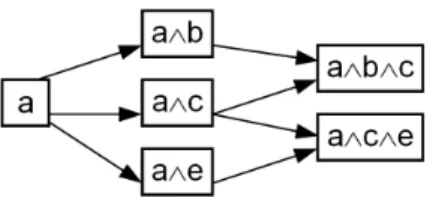
Fig. 1.A graph showing the rules a → b, a → c, a → e, a ∧ b → c, a ∧ c → b, a ∧ c → e, and a ∧ e → c
theoretical models (combinatorial objects) and as efficient representation tools that allow users to access complex structures without getting lost in information (Buntine, 1996).
In the simplest graph representation of a set Ω of association rules, the nodes are the antecedents and consequents of the rules, and the edges symbolize the implications (Klemettinen et al, 1994). Such a graph allows, without a key, to grasp the equivalence classes on Ω of the relations ”having the same ante-cedent/consequent”, and to generate a partition on Ω of the connex parts of the graph. On the other hand, except for transitivity when it exists, such a graph does not allow to deduce other relations easily. This limit has led to develop other graph-based models which in particular enable deductive inferences in the form of paths (Horschka and Klsgen, 1991) (Lehn, 2000).
The model that we favor is similar to the one of Horschka and Klsgen (1991). Let us note A = {a1, a2, ..., ap} the set of items (binary attributes) of the
data-base. An association rule {ai, aj} → {ak}, written ai∧aj→ ak for simplification,
is modeled as an edge which begins at node ai∧ aj (the antecedent of the rule)
and finishes at node ai∧ aj∧ ak (all the items of the rule). The relation
atta-ched to the edges is the inclusive relation among the subsets of items. Thus, this graph is directed and acyclic (figure 1). Besides, this is a subgraph of the itemset lattice.
From a logical point of view, relying on the classic support-confidence frame-work for rule interestingness assessment (Agrawal et al, 1993), this model allows to represent deductive inferences in the form of paths in the graph. Let us consi-der for instance the rules a → b and a ∧ b → c, respectively represented by the edges (a, a ∧ b) and (a ∧ b, a ∧ b ∧ c) (figure 1). The confidence of the rule a → b ∧ c that would be represented by the edge (a, a ∧ b ∧ c) is simply the product of the confidences of the rules of the path (a, a ∧ b, a ∧ b ∧ c).
2.2.2. Exploring the graph with neighborhood relations
Given an itemset1
γ in the graph, the user can be interested in two kinds of rules:
– the more specific rules with γ as antecedent,
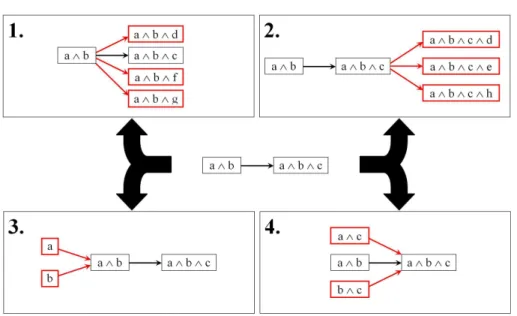
– the more general rules whose antecedent is strictly included in γ. From one rule α → β, the user can therefore access four subsets of rules:
case 1. the more specific rules for α (cf. example on figure 2.1), case 2. the more specific rules for β (figure 2.2),
1
Fig. 2.The four subsets of rules that can be accessed from a ∧ b → c
case 3. the more general rules for α (figure 2.3), case 4. the more general rules for β (figure 2.4).
So the graph-based model induces four relations that allow the user to navigate among the rules (i.e. accessing a new subset of rules from one selected rule). We call them neighborhood relations, since each of them define a notion of closeness between rules which makes sense for the user:
case 1. The neighbors of α → β are all the rules with α as antecedent. This relation is named same antecedent. It is an equivalence relation.
case 2. The neighbors of α → β are all the rules with α∧β as antecedent. This relation is named forward chaining since it is inspired by forward chaining in inference engines for expert systems: when the rule α → β is fired, the concept β becomes active and can be used with α to fire new rules and deduce new concepts. The relation is neither reflexive, nor symmetric, nor transitive. case 3. The neighbors of α → β are all the rules that can be built with the
items in α. This relation is named antecedent generalization and is complemen-tary to forward chaining: after applying forward chaining on a rule r, one can effectively come back to r by applying antecedent generalization. The relation is neither reflexive, nor symmetric, nor transitive.
case 4. The neighbors of α → β are all the rules that can be built with the items in α ∧ β. This relation is named same items since it allows to reorder the items in a rule. All the rules connected by the relation concern the same population of records in the database. This relation is an equivalence relation. During the interactive exploration process, the user navigates among the subsets of rules by using the neighborhood relations. Each time a relation is applied, a heuristics computes the rules wanted (the neighbors) which are then displayed. Thus, the rule set is explored subset by subset so that the user does not need to appropriate it entirely.
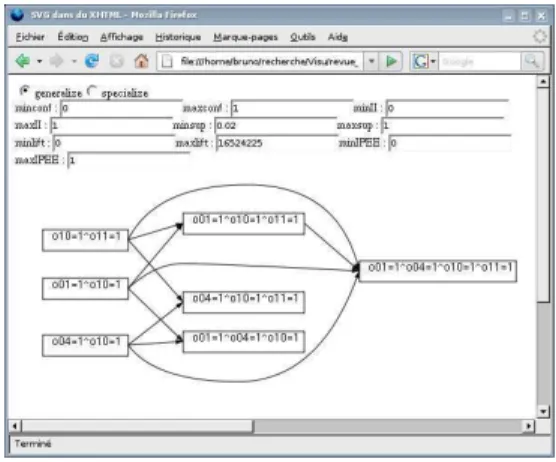
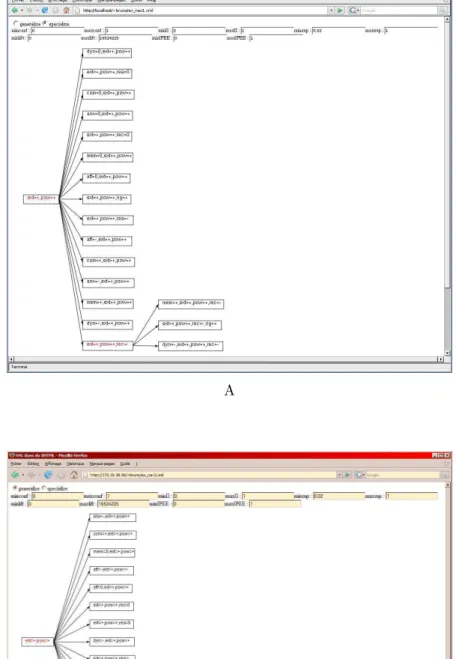
Fig. 3.A rule graph in Felix
2.3. Additional filters
To allow the user to focus on potentially interesting knowledge, the rules are filtered with interestingness measures thanks to thresholds set by the user (cf. (Hamilton and Guillet, 2006) for a survey on interestingness measures). Only the good rules (with measures greater than the thresholds) are accessible, the others not being displayed. In our methodology, we mainly use the following measures: – the classic support and confidence2
(Agrawal et al, 1993),
– the implication intensity, an asymmetric probabilistic index which evaluates the statistical significance of the rules by quantifying the unlikelihood of the number of counter-examples (Gras, 1996) (Blanchard et al, 2003).
3. Interactive visualization supports
In this section we present two complementary interfaces we have developed for rule exploration:
– a 2D interface named Felix which represents the rules by a graph,
– a 3D interface named ARVis which represents the rules by objects in virtual worlds.
As regards interaction (navigation) as well as visualization, Felix directly stems from the graph-based model described in section 2.2. On the other hand, ARVis uses the graph-based model for the interaction, while the visualization is based on a totally different paradigm.
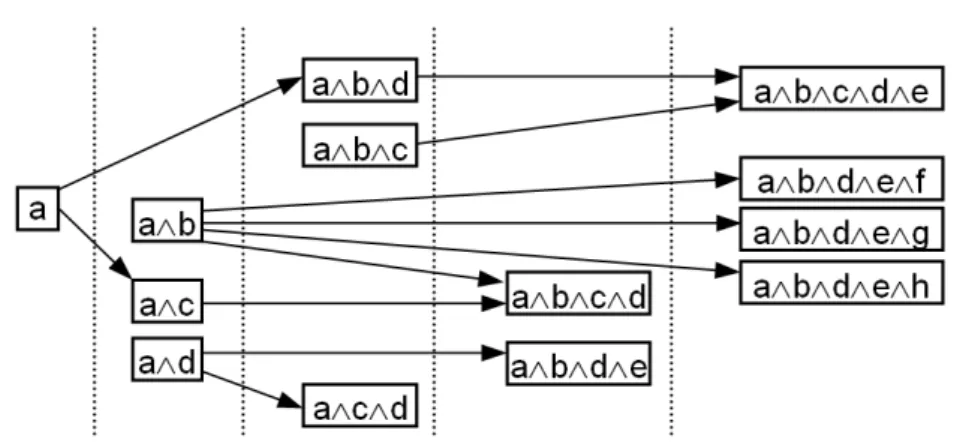
Fig. 4.Polyline drawing of a directed graph with vertices arranged in vertical layers
3.1. 2D visualization: Felix
With Felix (Kuntz et al, 2000), one directly visualizes the graph-based model (figure 3). After an initialization step (to choose the first subset of rules to be displayed), the user can dynamically develop the graph as (s)he wishes by applying the neighborhood relations. The graph can be reduced too, i.e. instead of displaying the neighboring rules, they can be removed.
A property always required for drawing graphs which model abstract concepts is the readability. This covers physical constraints of the drawing support (e.g. standard size of computer screens) and aesthetic criteria. Aesthetics specify gra-phic properties that should help the reader to understand and remember the information embodied in the graph (e.g. (Purchase, 1997)). They attempt to characterize readability by means of general combinatorial optimization goals. Common adopted criteria include minimizing arc crosses and minimizing the sum of the lengths of the arcs to avoid long lines which can create confusion.
In addition to these readability requirements, a drawing convention must be specified. In Felix, we consider polyline drawings with vertices arranged in vertical layers (figure 4). Each layer is associated with a degree of precision in the knowledge state: layers on the left correspond to general characteristics described by few items whereas layers on the right are more specific.
Due to the importance of this problem for many application fields, numerous efficient heuristics have been proposed. However, few of them take the interacti-vity with the user into account. In most algorithms a graph is given as an input and a drawing is supplied as an output. If a modification is performed (e.g. ver-tex and arc insertions) the algorithm runs again and produces a new drawing which may be thoroughly different from the previous one. As important changes between consecutive layouts highly disturb the interpretation task, the drawing method should preserve the ”user’s mental map” as much as possible (Eades et al, 1991). For this reason, we have developed a genetic algorithm which is par-ticularly efficient for this problem. By computing at each step a set of potential solutions, genetic algorithms allow indirectly to approximately solve a
multicri-2
Support is the proportion of records which verify a rule in the database; it evaluates the generality of the rule. Confidence is the proportion of records which verify the consequent among those which verify the antecedent; it evaluates the validity of the rule (success rate).
A
B C
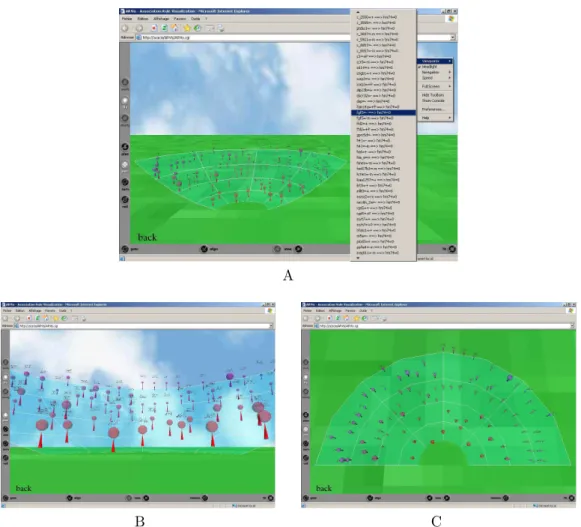
Fig. 5.Each subset of rules is represented by a 3D world
terion problem: a set of potential solutions (i.e. the population) is computed according to aesthetics measured by the fitness, and a solution is selected in this set according to its resemblance to the previous drawing (cf. Kuntz et al (2000) and Pinaud et al (2004) for details).
3.2. 3D visualization: ARVis
In ARVis3
(Blanchard et al, 2003), the subsets of rules are visualized in a 3D space, which we call a world (figure 5). The representation is built in the follo-wing way: each rule is symbolized by an object composed of a sphere perched on top of a cone (figure 6). In addition to textual display, the interestingness measures of the rules are here visually represented, with the graphical characte-ristics of the objects (position, sphere and cone sizes, sphere and cone colors).
3
Fig. 6.A menu provides the neighborhood relations (eight relations are implemented in ARVis)
The objects are laid out in the 3D world on an arena (a transparent half-bowl), which means that the further an object is, the higher it is placed (figure 5). This arena allows a better perception of the depth dimension and reduces occultation of objects by other objects. A similar choice is made in the document mana-ger Data Mountain of Microsoft Research, where web pages are laid out on an inclined plane (Robertson et al, 1998). Note that a ground and a sky are repre-sented in order to facilitate the navigation (viewpoint control) inside the world. As pointed out by Chen (2004), such visual landmarks make the navigation task easier by facilitating the acquisition of spatial knowledge, and more generally by facilitating the building of the ”mental map” by the user.
After an initialization step (to choose the first subset of rules to be displayed), the user can navigate among the rules thanks to the neighborhood relations. By applying a neighborhood relation on a rule, the current subset is replaced by a new subset which contains all the neighboring rules. Visually, the current world is replaced by a new world, which gives the impression of virtually moving inside the whole set of rules. At any time during the navigation, the user can go back to the previous subsets (and worlds) with the ”back” operator.
For each subset of rules, at the beginning of a visit, the user is placed in the 3D world in front of the arena so that (s)he benefits from an overall and synthetic view of the rules. Then the user can wander freely over the world to browse the rules and zoom in on them. There also exist predefined viewpoints to facilitate the exploration (cf. for instance, the viewpoint from the top in figure 5.C).
3.3. Architecture
Felix and ARVis are built on a client/server architecture with three components (figure 7):
– a database to store data and discovered itemsets;
– a CGI script in Perl which dynamically computes the subsets of rules with their interestingness measures, in accordance with the user’s requests –this is a constraint-based rule-mining algorithm (Ng et al, 1998) (Jeudy and Boulicaut, 2002);
Fig. 7.Architecture of Felix and ARVis
sta stability eas motivation for easiness fis fighting spirit pro motivation for protection ext extroversion rea motivation for realization que questioning mem motivation for membership
wil willpower pow motivation for power rec receptiveness imp improvisation rig rigor dyn dynamism inc intellectual conformism com communication anx anxiety aff affirmation soc spirit of conciliation ind independence Table 1.Meaning of the attributes
– a graphic user interface to visualize and explore the rules (SVG/XHTML/Javascript GUI for the 2D interface and VRML GUI for 3D).
We are currently working on the integration of both interfaces.
4. Illustration
This example is a case study made with the firm PerformanSe SA on human resource management data. The data are a set of workers’ psychological profiles used to calibrate decision support systems. It contains around 4000 individuals described by 20 categorical attributes (table 1). Each attribute has three possible values: ”+” to indicate the presence of the skill, ”-” to indicate that the skill is missing, and ”0” to indicate a neutral behaviour.
The user begins by studying people that are extrovert and motivated by power. By means of the exploration initialization interface, he displays with the 3D interface the world that contains the rules with the itemset ext=+ ∧ pow=+ in the antecedent (figure 8.A). The user explores the world. There are three rules with high interestingness measures at the bottom of the arena, and one of them especially interests the user: (ext=+ ∧ pow=+) → rec=−. To know more characteristics about this not very receptive population, he applies the neighborhood relation forward chaining on this rule. The newly displayed world contains the rules with ext=+ ∧ pow=+ ∧ rec=− in the antecedent (figure 8.B). In the same time, the 2D interface allows to keep a trace of the user’s actions on the rules database and to show all the rules discovered so far (figure 9.A). For a better redeability of the graph, the minimum support value is set to 0.02. To be easily identified, the text of the vertex used for the exploration is displayed with a different color.
A
B
∧ rec=−) → mem=+. To know the other rules verified by these extrovert, not very receptive, and motivated by power and membership people, he applies the neighborhood relation same items on the rule. In the new world, the user sees the four rules that can be built with the four items (figure 8.C). One is the transitional rule4
, two others are bad quality rules, and the fourth is a little better than the transitional rule: this is (ext=+ ∧ mem=+ ∧ rec=−) → pow=+ (see figure 9.B for the equivalent in 2D). To know whether all the items in the antecedent are useful in this rule, he applies the relation generalization on it. In the new world (figure 8.D), there is the rule (ext=+ ∧ mem=+) → pow=+ that is as good as the transitional rule, which means that the item rec=− was superfluous.
5. Related works
Interactive tools of the type ”rule browser” have been developed to assist the user in the post-processing of association rules (Klemettinen et al, 1994) (Ma et al, 2000) (Tuzhilin and Adomavicius, 2002) (Fule and Roddick, 2004). They allow to reach interesting rules by applying constraints (templates) and adjusting thresholds on interestingness measures. The main limit of these tools lies in the textual representation of the rules which does not suit the study of large amounts of rules. Within the framework of inductive databases (Imielinski and Mannila, 1996), several rule query languages have also been proposed (Han et al, 1996) (Meo et al, 1998) (Imielinski and Virmani, 1999) (Braga et al, 2002). They allow to mine and post-process rules interactively under the user’s guidance. However, as regards rule post-processing, the query languages are not very user-friendly (cf. Botta et al (2002) for an experimental study).
Sets of association rules can be visualized by using a directed graph (Klemettinen et al, 1994) (Rainsford and Roddick, 2000) (Han et al, 1997). In this kind of repre-sentations, the nodes and edges respectively symbolize the items and the rules. In (Hao et al, 2001), the method is implemented in 3D with a self-organization algorithm which optimizes the graph layout in space. A second rule visualization method consists in using a matrix representation (Hofmann and Wilhelm, 2001) (Han et al, 1997). In an item-to-item matrix, each line corresponds to an ante-cedent item and each column to a consequent item. A rule between two items is symbolized in the matching cell by a 2D or 3D object. This visualization tech-nique has been improved into rule-to-item matrices (Wong et al, 1999), where each line corresponds to an item and each column corresponds to a rule. Com-pared to the item-to-item matrices, the rule-to-item matrices are less cluttered and allow a more efficient representation of rules with more than two items.
All the visual representations described so far are based on rule syntax (i.e. the items). A different approach is proposed in Unwin et al (2001), where the representation is based on interestingness measures. This representation is a scatterplot between support and confidence where each point is colored according to density estimation. The user can query any point to display the names of the rules represented by the point (rules with close supports and confidence). The
4
The transitional rule is the last rule on which the user applied a neighborhood relation. When a new subset of rules is visualized, the transitional rule is added in the subset (in this example, it is represented in the worlds by an object with a white sphere). This allows making comparisons between a rule and its neighbors.
decker plots, inspired from the mosaic display for contingency tables. In a double decker plot, each rule is symbolized by a rectangle whose area is support and height is confidence. This technique does not deal with the visualization of a large set of rules but with the visualization of a few rules over a few items. It allows a thorough study of a restricted number of rules, making their interpretation easier and helping to understand their occurrence context.
6. Discussion
The two visualization supports proposed in Felix and ARVis are really comple-mentary. As graphs are a good means of representing large networks of rules, the graph-based interface of Felix is well-adapted for global view. To avoid the com-putation of huge amounts of rules with data mining algorithms, the graph-based interface can be used to visualize only the set of rules that have already been ex-plored, which allows to interactively build an history of the user’s navigation. In this way the user progressively builds the global view on the rules around his/her own interest areas, without having to extract and handle the whole set of rules in one blow (for given thresholds of support and confidence). On the other hand, the 3D interface of ARVis is more appropriate to local view, to make compari-sons in a limited subsets of rules. The quality-oriented visual encoding we have chosen stresses the good rules (according to the interestingness measures) whose visualization and access are made easier compared to the less good rules. So the combination of our two visualization supports answers to the need for integration between general and specific views, a classic challenge in information visualiza-tion –cf. for example the overview+details approachs (Shneiderman, 1996) and focus+context approachs (Furnas, 1986) (Sarkar and Brown, 1992) (Lamping et al, 1995). To our knowledge, such a multiple viewpoint approach has never been proposed for association rule exploration.
The complementarity between Felix and ARVis is also due to the 2D-3D lin-king. The choice between 2D and 3D representations for information visualization is still an open problem (Card et al., 1999) (Chen, 2004). This is especially due to the fact that the efficiency of a visualization is highly task-dependent (Carswell et al, 1991). Besides, while 3D representations are often more attractive, 2D has the advantage of a long and fruitful experience in information visualization. In fact, few research works are dedicated to the comparison between 2D and 3D. As regards the static (non interactive) visualization of statistical graphs, the 3D re-presentations have generally not been advisable since the influential publications of Tufte (1983) and Cleveland and McGill (1984). Nevertheless, the psychophy-sics experiments of Spence (1990) and Carswell et al (1991) show that there is no significant difference of accuracy between 2D and 3D for the comparison of numerical values. In particular, Spence points out that this is not the apparent dimensionality of visual structures which counts (2 for a surface, 3 for a volume) but the actual number of parameters that show variability (Spence, 1990). In his experiments, whatever the apparent dimensionality of visual structures, Ste-vens’s law is almost always the same when only one parameter actually varies
(Stevens’s law exponents are very close to 1). Under some circumstances, infor-mation may even be processed faster when represented in 3D rather than in 2D. As regards the perception of global trends in data (increase or decrease), the experimental results of Carswell et al (1991) also show an improvement in the answer times with 3D but to the detriment of accuracy.
7. Conclusion
In this article we have presented a new interactive rule-mining methodology based on two kinds of visual representations: a 2D interface which represents the rules by a graph and a 3D interface which represents the rules by objects in virtual worlds. Our methodology allows the user to drive the discovery process by focusing his/her attention on limited subsets of rules. It relies on:
1. a database which contains the studied data and additional tables to optimize the response times,
2. a heuristics which dynamically computes the rule subsets associated with the user’s requests,
3. an interactive visualization support which allows the user to choose a subset of rules to be explored.
The originality of our methodology in comparison with the existing rule ex-ploration techniques mainly lies in the concept of neighborhood relations, prede-fined relations which enable the user to navigate among the rules. With a query language or an interactive interface like a rule browser, the user can reach any subset of rules but (s)he must explicitly specify the constraints which delimit it. With our approach, the constraint specification is implicit since it is hidden in the neighborhood relations. Actually, the neighborhood relations can be seen as generalizations of constraints (classes of constraints). We think that the user’s task is made easier with neighborhood relations than with explicit constraints.
References
Agrawal R., Imielinski T., and Swami A. (1993) Mining association rules between sets of items in large databases. In Proc. of the 1993 ACM SIGMOD international conference on management of data, ACM Press, pp 207–216
Agrawal R. and Srikant R. (1994) Fast algorithms for mining association rules. In Proc. of the 20th international conference on very large data bases (VLDB), Morgan Kaufmann, pp 487–499
Barthelemy J.-P. and Mullet E. (1992) A model of selection by aspects. Acta Psychologica, Elsevier Science Publishers, vol. 79, num. 1, pp 1–19
Bhandari I. (1994) Attribute focusing: machine-assisted knowledge discovery applied to soft-ware production process control. Knowledge Acquisition, Academic Press Ltd., vol. 6, num. 3, pp 271–294
Blanchard J., Guillet F., and Briand H. (2003) A user-driven and quality-oriented visualization for mining association rules. In Proc. of the 3rd IEEE international conference on data mining ICDM’03, IEEE Computer Society, pp 493–496
Blanchard J., Kuntz P., Guillet F., and Gras R. (2003) Implication intensity: from the basic statistical definition to the entropic version. In Bozdogan H. (editor.), Statistical data mining and knowledge discovery, Chapman & Hall/CRC Press, pp 473–485
Botta M., Boulicaut J.F., Masson C., and Meo R. (2002) A comparison between query lan-guages for the extraction of association rules. In Proc. of the 4th international conference on
Braga D., Campi A., Klemettinen M., and Lanzi P.L. (2002) Mining association rules from XML Data. In Proc. of the 4th international conference on data warehousing and knowlege discovery (DaWaK 2002), Springer-Verlag, Lecture Notes in Computer Science 2454, pp 21– 30
Buntine W. (1996) Graphical models for discovering knowledge. In Fayyad U.M., Piatetsky-Shapiro G., Smyth P., Uthurusamy R. (editors.), Advances in knowledge discovery and data mining, AAAI/MIT Press, pp 59–82
Card S.K., Mackinlay J.D., and Schneiderman B. (editors) (1999) Readings in Information Visualization: Using vision to think. Morgan Kaufmann
Carswell C.M., Frankenberger S., and Bernhard D. (1991) Graphing in depth: perspectives on the use of three-dimensional graphs to represent lower-dimensional data. Behaviour and Information Technology, vol. 10, num. 6, pp 459–474
Chen C. (2004) Information Visualization: beyond the horizon. Springer-Verlag
Cleveland W.S. and McGill R. (1984) Graphical perception: theory, experimentation, and ap-plication to the development of graphical methods. Journal of the American Statistical Association, vol. 79, num. 387, pp 531–554
Cleveland W.S. (1985) The elements of graphing data. Hobart Press
Eades P., Lai W., Misue K., and Sugiyama K. (1991) Preserving the mental map of a diagram. In Proc. of Compugraphics, pp 24–33
Fayyad U.M., Grinstein G.G., and Wierse A. (2001) Information visualization in data mining and knowledge discovery. Morgan Kaufmann
Frawley W.J., Piatetsky-Shapiro G., and Matheus C.J. (1991) Knowledge Discovery in Data-bases: an overview. In Piatetsky-Shapiro G., Frawley W.J. (editors.), Knowledge Discovery in Databases, AAAI/MIT Press, pp 1–30
Fule P. and Roddick J. F. (2004) Experiences in building a tool for navigating association rule result sets. In Hogan J., Montague P., Purvis M., Steketee C. (editors), CRPIT’04: Proc. of the second Australasian workshop on data mining and web intelligence, Australian Computer Society Inc., pp 103–108
Furnas G.W. (1986) Generalized fisheye views. In CHI’86: Proceedings of the SIGCHI confe-rence on Human factors in computing systems, ACM Press, pp 16–23
Gras R. (1996) L’implication statistique : nouvelle m´ethode exploratoire de donn´ees. La Pens´ee Sauvage Editions (in French)
Grinstein G.G. (1996) Harnessing the human in knowledge discovery. In Proc. of the 2nd ACM SIGKDD International Conference on Knowledge Discovery and Data Mining, AAAI Press, pp 384–385
Hamilton H. and Guillet F. (2006) Quality Measures for Data Mining. Springer-Verlag (to be published)
Han J., Fu Y., Wang W., Koperski K., and Zaiane O. (1996) DMQL: a data mining query language for relational databases. In Proc. of the 1996 SIGMOD workshop on research issues on data mining and knowledge discovery (DMKD)
Han J., Chiang J.Y., Chee S., Chen J., Chen Q., Cheng S., Gong W., Kamber M., Koperski K., Liu G., Lu Y., Stefanovic N., Winstone L., Xia B., Zaiane O.R., Zhang S., and Zhu H. (1997) DBMiner: A system for data mining in relational databases and data warehouses In Proc. of CASCON’97: Meeting of Minds, pp 249–260
Hao M.C., Dayal U., Hsu M., Sprenger T., and Gross M.H. (2001) Visualization of directed associations in e-commerce transaction data. In Proc. of VisSym 2001, pp 185–192 Hipp J., Gntzer U., and Nakhaeizadeh G. (2000) Algorithms for association rule mining - A
general survey and comparison. SIGKDD Explorations, ACM Press, vol. 2, num. 1, pp 58– 64
Hofmann H., Siebes A.P., and Wilhelm A.F. (2000) Visualizing association rules with interac-tive mosaic plots. In Proc. of the 6th ACM SIGKDD international conference on knowledge discovery and data mining, ACM Press, pp 227–235
Hofmann H. and Wilhelm A. (2001) Visual comparison of association rules. Computational Statistics, Physica-Verlag, vol. 16, num. 3, pp 399–415
In Piatetsky-Shapiro G., Frawley W.J. (editors.), Knowledge Discovery in Databases, AAAI/MIT Press, pp 325–345
Imielinski T. and Mannila H. (1996) A database perspective on knowledge discovery. Commu-nications of the ACM, ACM Press, vol. 39, num. 11, pp 58–64
Imielinski T. and Virmani A. (1999) MSQL: A query language for database mining. Data Mining and Knowledge Discovery, Kluwer Academic Publishers, vol. 3, num. 4, pp 373–408 Jeudy B. and Boulicaut J.-F. (2002) Optimization of association rule mining queries. Intelligent
Data Analysis, IOS Press, vol. 6, num 4, pp 341–357
Keim D.A. and Kriegel H.-P. (1996) Visualization techniques for mining large databases: a comparison. IEEE Transactions on Knowledge and Data Engineering, IEEE Educational Activities Department, vol. 8, num. 6, pp 923–938
Klemettinen M., Mannila H., Ronkainen P., Toivonen H., and Verkamo A.I. (1994) Finding interesting rules from large sets of discovered association rules. In Proc. of the 3rd in-ternational conference on information and knowledge management (CIKM), ACM Press, pp 401–407
Kuntz P., Guillet F., Lehn R., and Briand H. (2000) A user-driven process for mining asso-ciation rules. In Proc. of the 4th European conference on principles of data mining and knowledge discovery (PKDD-2000), Springer-Verlag, pp 483–489
Kuntz P., Lehn R., and Briand H. (2000) Dynamic rule graph drawing by genetic search. In Proc. of the IEEE International Conference on System Man and Cybernetics, IEEE Press, pp 45–58
Lamping J., Rao R., and Pirolli P. (1995) A focus+context technique based on hyperbolic geometry for visualizing large hierarchies. In CHI’95: Proceedings of the SIGCHI confe-rence on Human factors in computing systems, ACM Press/Addison-Wesley Publishing Co., pp 401–408
Lehn R. (2000) An interactive rule visualization system for knowledge discovery in databases. PhD thesis, University of Nantes
Ma Y., Liu B., and Wong C.K. (2000) Web for data mining: organizing and interpreting the discovered rules using the Web. SIGKDD Explorations, ACM Press, vol. 2, num. 1, pp 16– 23
Meo R., Psaila G., and Ceri S. (1998) An extension to SQL for mining association rules. Data Mining and Knowledge Discovery, Kluwer Academic Publishers, vol. 2, num. 2, pp 195–224 Montgomery H. (1983) Decision rules and the search for a dominance structure: towards a process model of decision making. In Humphreys P.C., Svenson O., Vari A. (editors.), Analysing and aiding decision processes, Amsterdam:North Holland, pp 343–369
Ng R.T., Lakshmanan L.V.S., Han J., and Pang A. (1998) Exploratory mining and pruning optimizations of constrained associations rules. In Proc. of the 1998 ACM SIGMOD inter-national conference on management of data, ACM Press, pp 13–24
Pinaud B., Kuntz P., and Lehn R. (2004) Dynamic graph drawing with a hybridized genetic algorithm. In Proc. of Automatic Computing in Design and Manufacture VI, Springer, pp 365–375
Purchase H. (1997) Which aesthetic has the greatest effect on human understanding? In Proc. of Graph Drawing’97, LNCS 1353, Springer-Verlag, pp 248–261
Rainsford C.P. and Roddick J.F. (2000) Visualisation of temporal interval association rules. In Proc. of the 2nd international conference on intelligent data engineering and automated learning (IDEAL 2000), Springer-Verlag, pp 91–96
Robertson G., Czerwinski M., Larson K., Robbins D.C., Thiel D., and van Dantzich M. (1998) Data mountain: using spatial memory for document management. In UIST’98: Proc. of the 11th annual ACM symposium on user interface software and technology, ACM Press, pp 153–162
Sarkar M. and Brown M.H. (1992) Graphical fisheye views of graphs. In CHI’92: Proceedings of the SIGCHI conference on human factors in computing systems, ACM Press, pp 83–91 Shneiderman B. (1996) The Eyes Have It: a task by data type taxonomy for information visua-lization. In Proceedings of IEEE Symposium on Visual Languages VL’96, IEEE Computer Society, pp 336–343
Simon H.A. (1979) Models of Thought. Yale University Press
Spence I. (1990) Visual psychophysics of simple graphical elements. Journal of Experimental Psychology: Human Perception and Performance, vol. 16, num. 4, pp 683–692
Spence R. (2000) Information Visualization. Addison Wesley
Tufte E. (1983) The Visual Display of Quantitative Information. Graphics Press Tukey J.W. (1977) Exploratory data analysis. Addison-Wesley
Wong P.C., Whitney P., and Thomas J. (1999) Visualizing association rules for text mining. In Proc. of the 1999 IEEE symposium on information visualization, IEEE Computer Society, pp 120–123