HAL Id: hal-00999659
https://hal.archives-ouvertes.fr/hal-00999659
Submitted on 3 Jun 2014
HAL is a multi-disciplinary open access
archive for the deposit and dissemination of
sci-entific research documents, whether they are
pub-lished or not. The documents may come from
teaching and research institutions in France or
abroad, or from public or private research centers.
L’archive ouverte pluridisciplinaire HAL, est
destinée au dépôt et à la diffusion de documents
scientifiques de niveau recherche, publiés ou non,
émanant des établissements d’enseignement et de
recherche français ou étrangers, des laboratoires
publics ou privés.
Perceptual preference of S3D over 2D for HDTV in
dependence of video quality and depth
Pierre Lebreton, Alexander Raake, Marcus Barkowsky, Patrick Le Callet
To cite this version:
Pierre Lebreton, Alexander Raake, Marcus Barkowsky, Patrick Le Callet. Perceptual preference of
S3D over 2D for HDTV in dependence of video quality and depth. IVMSP Workshop, 2013 IEEE
11th, Jun 2013, Seoul, South Korea. pp.1–4, �10.1109/IVMSPW.2013.6611905�. �hal-00999659�
PERCEPTUAL PREFERENCE OF S3D OVER 2D FOR HDTV IN DEPENDENCE OF VIDEO
QUALITY AND DEPTH
Pierre Lebreton
1,2, Alexander Raake
1, Marcus Barkowsky
2, Patrick Le Callet
21
Telekom Innovation Laboratories, TU Berlin, Ernst-Reuter-Platz 7, 10587 Berlin, Germany
2
LUNAM Universit´e, Universit´e de Nantes, IRCCyN UMR CNRS 6597, Polytech Nantes
Rue Christian Pauc BP 50609 44306 Nantes Cedex 3, France
ABSTRACT
3D video quality of experience (QoE) is a multidimensional prob-lem and many factors contribute to the global experience by the user. Due to this multidimensionality, this paper evaluates the integral 3D video QoE and relates it with image quality and depth. Subjective tests have been conducted using paired comparison to evaluate 3D QoE and the preference of 3D over 2D with different combinations of coding conditions. Depth scores were available from previous work and were used to check their relation with 3DQoE; the differ-ence between 2D and 3D QoE is found to be a function of the picture quality, and the desired preference of 3D presentation over 2D can be reached when pictorial quality is high enough (VQM score lower than 0.24). A factor ranging from 0.08 to 0.76 with a mean of 0.71 between pictorial quality and preference of 3D was also found.
Index Terms— 3D video, pair comparison, preference, quality of experience, picture quality, depth, coding
1. INTRODUCTION
3D video Quality of Experience (QoE) is a multidimensional prob-lem; many factors contribute to the global rating like image quality, depth perception, depth quality, visual discomfort, sense of pres-ence, naturalness, etc. Evaluating QoE taking into consideration all these factors is no easy task. The simplest approach, namely to instruct observers in subjective experiments to judge the “Quality of Experience”, does not necessarily provide the expected result, but is rather often based on only one factor of QoE, the picture quality [1]. This type of results is due to the internal reference of the observer: when observers are asked to rate a 3D image/video, they base their judgment on their expectations. In a test with different coding condi-tions, the expectations of the observers are mainly driven by picture quality. Consequently, especially with an absolute, single stimulus rating paradigm, people have difficulties to consider factors other than image quality of 3D when they are asked for 3D video QoE. Hence, it is hard to quantify the added value of 3D as compared to 2D, as can be seen in [2] where 3D is not rated better than 2D in an absolute category rating (ACR) test, and no improvement of QoE due to the 3D effect can be measured.
Alternative evaluation schemes have been considered by Se-unti¨ens by addressing other dimensions like naturalness or immer-sion, or by investigating specific factors like depth perception or eye-strain [3], which provides some insight on isolated factors of the general QoE, but not the overall QoE. In the present study, as global measure of QoE, the subjective preference has been considered. It is believed that when subjects are asked for preference between two
videos, they may considers all factors (picture quality, both depth quantity and depth quality, visual discomfort and probably other factors) to take the decision which of two versions of a sequence they prefer. This way, the entire multidimensionality of 3D QoE is considered. Missing factors of 2D video QoE when evaluating it using ACR were shown by Belmudez [4], where another mul-tidimensional question was studied. Here, image size and image resolution were compared in terms of quality ratings, one using ACR, one using paired comparison (PC). Results showed that the two test methods do not provide the same results: using ACR, ob-servers give higher QoE ratings for images at their native resolution; using PC, observers prefer larger images obtained after upscaling. The results are different, and show that using the ACR methodology observers only judge image quality, but with paired comparison they extend their rating to other dimensions, including the image size. PC however has an important drawback: its cost and time consumption. To obtain scale value quality scores from PC data, two models ex-ist: the Bradley-Terry model or the Thurstone-Mosteller model [5]. Both need a full PC matrix: each condition has to be compared to another. However, several efficient approaches have been developed in the literature to reduce the number of required comparisons [6], [7]. In [7] six video sequences were recorded. Each of these videos were captured at six inter-camera distances (10 cm to 60 cm). The 36 video sequences were then compared through paired comparison, and the Bradley-Terry scores of each condition were determined. Results show that the Bradley-Terry scores reveal quality fluctua-tion due to the different depth and comfort. The relafluctua-tion between inter-camera distance and QoE was found highly content dependent. In [8], 3D was compared to 2D using a PC approach on an auto-stereoscopic display. 3D was produced internally by the display based on a texture and a depth map. The texture was used at four different qualities levels (three encodings and a reference). Results show that 3D was rejected in 70% of the cases and for the lowest quality rejected at 56%. However, the results may be influenced by the technology used at the time of the experiment and the quality of 3D rendering of the 3D display as mentioned by the authors.
In this study, paired comparison will be used to evaluate 3D and 2D video sequences to show the quality improvement/decrease due to 3D. In addition, coding conditions were created and included in the experiment. This enables the comparison between known arte-facts such as coding and effect of content characteristics such as depth on 3D-QoE. This information was missing in [7]. An increase the number of the number of contents enables also a content-based analysis
Section 2 provides information on the subjective experiment: the selection of source sequences, the generation of processed video
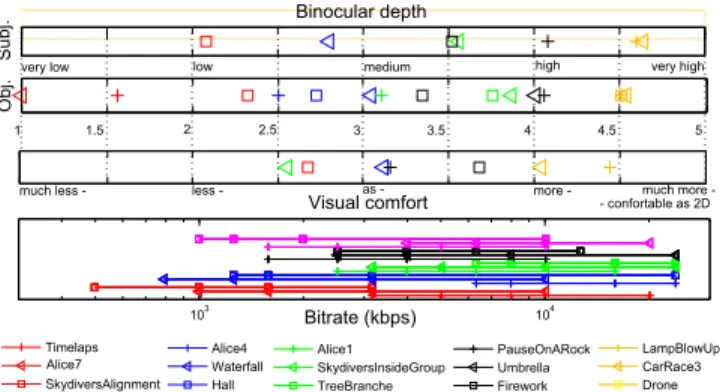
se-1 1.5 2 2.5 3 3.5 4 4.5 5 Binocular depth Visual comfort 103 Bitrate (kbps) 104 Timelaps Alice7 SkydiversAlignment Alice4 Waterfall Hall Alice1 SkydiversInsideGroup TreeBranche PauseOnARock Umbrella Firework LampBlowUp CarRace3 Drone S ub j. Obj.
very low low medium high very high
much less - less - as - more - much more - - confortable as 2D
Fig. 1: Depth, visual comfort, bitrate of source sequences
quences (PVS), and the evaluation process. Section 3 links pictorial quality, depth and preference of 3D over 2D. Section 4 extends the analysis to quantifying the “3D added value” and shows to which extent depth contributes to QoE. Section 5 concludes the paper.
2. EXPERIMENTS 2.1. Definition of test conditions
2.1.1. Selection of Source sequences
The selection of the source contents (SRC) is based on three databases. All sequences were full HD stereoscopic videos; each view had a resolution of 1920x1080, with a frame rate of 25 im-ages per second and was of 10s length. Seven SRCs come from a first database composed of 64 source reference signals (SRCs) [9]. The SRCs were used at the highest quality available, and contained various types of scenes. They were rated on three different scales: overall quality of experience, depth and visual comfort. The method-ology used was Absolute Category Rating (ACR). Perceived depth was rated on a five-point scale with labels: “very high”, “high”, “medium”, “low” or “very low”. Using this general depth scale, the observers rated their general impression of the depth, which takes into account both depth layout perceptions and depth quality. The comfort was evaluated on an absolute manner by asking subjects, if the 3D sequence is “much more”, “more”, “as”, “less”, “much less” - “comfortable than watching 2D video”. Based on this data, the seven SRCs were chosen to cover the entire range of depth ratings. To ensure the reproducibility of our results, it was decided to in-clude five open video materials [10]. These sequences inin-clude “Tree Branches”, “Hall”, “Umbrella” and two new sequences designed to reach our depth effect requirements: one with low and high depth quantity, respectively, “Timelaps” and “Drone”. A third source of SRC coming from Blu-Ray disk where three other non-open se-quences named “Alice” were added to the test. These last sese-quences were not available at the time of the previous test [9], our depth per-ception model developed in [9] was used to have an objective value of the perceived depth for these sequences. The top scatter plot of Figure 1 shows how the selected sources cover the depth scale, based on subjective data [9]. The second scatter plot shows the results of the depth score estimated from the depth model described in [9]. The third scatter plot shows the available subjective data regarding visual discomfort. This data has been added, however not used in this paper for content selection, and is shown to let the reader have a view on the principal characteristics of the 3D sequences.
2.1.2. Selection of coding conditions
Coding was performed using a Harmonic Electra 8000 H.264 en-coder at constant bitrate. Since it was planned to use a polarized display with horizontal interlacing, the 3D sequences were in the Top/Bottom frame compatible format, this choice limiting the loss of resolution. Each full-HD view was downscaled to half the vertical resolution using a lanczos filter. No further interpolation was done for optimizing resolution but have result in half a line of vertical parallax. Each sequence is then encoded to four different “quality levels” by using four different values of bitrate. The four bitrate val-ues were defined for each source sequence individually, since each of them had different spatial and temporal complexity. In previous experiments, it was revealed that VQM (ITU-R Rec. J.144) performs sufficiently well in estimating picture quality of 3D sequences [11] (Pearson correlation of 0.89, and RMSE of 5.4). As a consequence, the procedure for determining the bitrate values corresponding to the “quality levels” is based on quality estimations obtained from the VQM general model. The four adequate quality levels have been determined as 0.1, 0.2, 0.3, and 0.4 on the VQM scale. These values correspond to the quality score of the most complex sequence of the test, “TreeBranches”, encoded respectively at a quantization param-eter QP of 26, 32, 38, and 44 using the reference H.264 encoder JM 18.2. The range of bitrates used in the test is illustrated in Figure 1 and noted for example 2DQ1, for 2D at quality level 1. Quality level 0 being the reference.
At the end of the selection process, the 15 SRCs were encoded at four individually chosen bitrates leading to VQM scores close to 0.1, 0.2, 0.3 and 0.4 as described above. These sequences are used in two versions: 2D and 3D. The 2D sequences were encoded at the same bitrate as their respective counterpart sequences in 3D. In addition, a 3D reference with no compression was added to the test. This results in 15 · (2 · 4 + 1) = 135 video sequences to be evaluated.
2.2. Evaluation of 3D QoE using paired comparison
The global QoE of the video sequences was evaluated in a paired comparison experiment. 35 Observers participated in this test. The laboratory environment was in accordance with ITU-R Recommen-dation BT.500. The observers’ vision was screened in terms of acuity, color vision (Ishihara test), and stereovision (Randot stereo test). For the test, two polarized 23” Hyundai displays (ViewSonic V3D231) with horizontal interlacing were used. The displays were calibrated using a display calibration device (X-Rite i1 Pro) to make the rendering as similar as possible between the two displays. The observers were facing two distinct displays, and were instructed to give their preference between the two presentations they could see on the displays. Considering the number of possible presentations (3D or 2D, 4 quality levels in 2D and 3D, and a 3D reference), a full PC matrix approach would have required 9 × (9 − 1)/2 = 36 comparisons per SRC, hence 540 comparisons for evaluating all video sequences. This high number of comparisons is impracticable for a subjective experiment [6]. For more efficient testing, the square design matrix was employed. Based on this approach it was possible to reduce the number of comparisons to 18 comparisons per SRC, hence 15 × 18 = 270 comparisons. The comparisons made in the test can be found in listing 1. The sequence pairs were randomized such that in case of comparison A vs. B, both orders A vs. B and B vs. A were seen by the observers. This avoids any dependency of the preference ratings on the display and possible default answers by observers (right vs. left). The test was split into two sessions
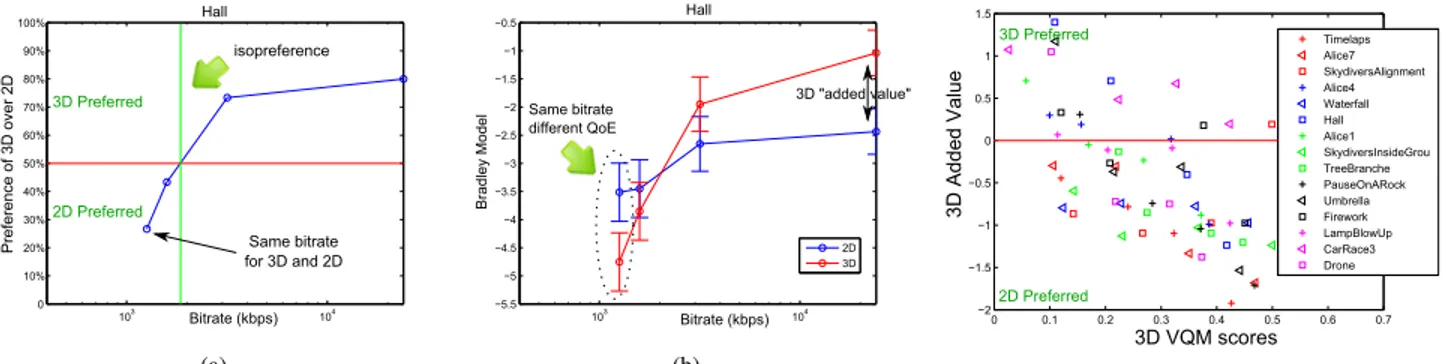
103 104 0 10% 20% 30% 40% 50% 60% 70% 80% 90% 100% Pr ef er ence of 3D over 2D 3D Preferred isopreference Same bitrate for 3D and 2D 2D Preferred Hall Bitrate (kbps) (a) 103 104 −5.5 −5 −4.5 −4 −3.5 −3 −2.5 −2 −1.5 −1 −0.5 B rad le y M ode l 2D 3D Same bitrate different QoE 3D "added value" Hall Bitrate (kbps) (b)
Fig. 2: Illustration of preference results for one source content (Hall).
0 0.1 0.2 0.3 0.4 0.5 0.6 0.7 −2 −1.5 −1 −0.5 0 0.5 1 1.5 3D VQM scores 3D A dde d V al ue Timelaps Alice7 SkydiversAlignment Alice4 Waterfall Hall Alice1 SkydiversInsideGrou TreeBranche PauseOnARock Umbrella Firework LampBlowUp CarRace3 Drone 2D Preferred 3D Preferred
Fig. 3: 3D added value as a function of VQM scores.
of 45 min. The same observers participated twice with a minimum delay of one week.
Listing 1: List of sequence pairs compared by observers | 3DQ4 vs 3DQ0 | 2DQ3 vs 2DQ1 | | 3DQ4 vs 2DQ4 | 2DQ3 vs 3DQ2 | | 3DQ0 vs 2DQ4 | 2DQ1 vs 3DQ2 | | 3DQ3 vs 3DQ1 | 3DQ4 vs 3DQ3 | | 3DQ3 vs 2DQ2 | 3DQ4 vs 2DQ3 | | 3DQ1 vs 2DQ2 | 3DQ3 vs 2DQ3 | | 3DQ0 vs 3DQ1 | 3DQ0 vs 2DQ1 | | 3DQ1 vs 2DQ1 | 2DQ4 vs 2DQ2 | | 2DQ4 vs 3DQ2 | 2DQ4 vs 2DQ4 |
3. PREFERENCE OF 3D OVER 2D AND PICTORIAL QUALITY
The main goal of the paired comparison test was to analyze how the preference of 3D over 2D would depend on the respective “picto-rial quality”. As outlined in Section 2, picto“picto-rial quality was varied at four different bitrates, i.e. quality levels Q1-Q4. Figure 2a illus-trates for one SRC, how observers answered. It is visible that when the bitrate increases, the preference of the 3D presentation over the 2D version increases. This is however not true for one of the con-tents, “SkydiversInsideGroup”. This content was found to be less preferred when the quality increased. In Figure 1, it can be seen that this content is the least comfortable sequence of the database. The blurring added by coding may have contributed in such way that this content was perceived as more comfortable. This would be in agree-ment with [12], where binocular fusion was found to be dependent on the retinal disparities and spatial frequencies within images. In the paired comparison tests, some video sequences were found to always be preferred in 2D “SkydiversAlignment”, “SkydiversInsid-eGroup”, and “Waterfall”. These sequences correspond to the least comfortable sequences of the test. In turn, one sequence was always preferred in 3D: “CarRace3”. Based on the test results, the bitrate at which 2D and 3D were equally preferred can be determined, as well as the respective VQM scores. In the following, these points are referred to in terms of isopreference. The VQM scores at isoprefer-ence has been estimated using linear regression between two known points in the 2D domain spanned by “preference percentage” and “VQM scores”. On average, it has been found that the isopreference at the same bitrate between 2D and 3D is reached when the picture quality of the 3D sequence measured by VQM is at least equal to 0.24. The relation between the VQM scores at isopreference and the
depth score rating (subjective depth score when available, and objec-tive if not, see Section 2) was considered. However, no simple rela-tion can be found between these two factors, and other factors have to be taken into account. These other factors may include monocu-lar depth cues such as blur from defocus, linear perspective, texture gradient, motion parallax and also visual discomfort.
4. QUANTITATIVE ANALYSIS OF THE “3D ADDED VALUE”
Thanks to the test design it was possible to use the Bradley-Terry (BT) model. In Figure 2b, results of the model are depicted for one SRC. The BT-scores provide the continuous perceptual scale which quantifies the difference between 2D and 3D QoE. It is then possible to evaluate the “added value of 3D” by measuring the difference be-tween the BT-scores at conditions where the bitrate is the same. As only pairs for the same source content were evaluated in our test, the BT-scores cannot be used to compare preferences across contents. For example, it is not possible to compare the content “Alice1” in 3D at quality level 3 to “SkydiversInsideGroup” in 2D at quality level 2. This inter-content comparison was not targeted, and instead the goal was to determine 3D preference thresholds as a function of pictorial quality for different degrees of depth information. Making inter-contents comparisons would have added individual judgement of the observer regarding his preference of one type of scene com-pared to another, which would have made the data noisy and hard to interpret. As a consequence, it is not possible to compare one BT-score from one SRC to another score from another SRC since it exists an unknown offset between these two scores. However, since the scale remains the same between SRCs, it is then possible to com-pare inter-SRC differences of BT-score. Let the “3D added value” be the difference of BT-score between two similar coding conditions re-flecting the score fluctuation due to the presence of depth (see Figure 2b). At least two factors are of influence on the “3D added value” (3DAV) scores, one covers the 3D characteristics of the video se-quences including depth, comfort, naturalness, immersion, etc. And the other one covers the pictorial quality of the video. Figure 3 de-picts the relation between the quality factor measured through VQM scores of the 3D video sequences and the 3DAV. These two factors show a Pearson correlation of -0.65 and a Spearman correlation of -0.67. Using a N-Way Analysis of Variance (NANOVA) analyzing the 3DAV based on the factors “QualityLevels” as defined in Section 2 and “DepthLevels” (grouping the SRCs in five class of depth ef-fect) shows that there is a strong influence of quality on the 3DAV (F = 13.5, p < 0.001) and that there is also a significant influence
−6 −5 −4 −3 −2 −1 0 1 −2 −1.5 −1 −0.5 0 0.5 1 1.5 ∆BT 3D a dd ed va lu e Timelaps Alice7 SkydiversAlignment Alice4 Waterfall Hall Alice1 SkydiversInsideGroup TreeBranche PauseOnARock Umbrella Firework LampBlowUp CarRace3 Drone 3D 3D Preferred 2D Preferred
Fig. 4: 3D added value as a function of ∆BT3D.
of the “DepthLevel” on the 3DAV (F = 3.98, p = 0.0069). Consid-ering the rather small amount of data (four 3DAV values per SRC) no significant influence can be observed on a per-content analysis. Let BT3D(k) be the BT-score of the condition3DQkas listed in
listing 1. The 3D-QoE fluctuation due to coding can be obtained by: ∀k ∈ [1, 4], ∆BT3D(k) = BT3D(k) − BT3D(0). The ∆BT3D(k)
provide a subjective value of how coding affects 3DQoE. This in-cludes loss in pictorial quality, loss in depth [13] and the impact on comfort. The relation between ∆BT3D(k) and 3DAV is depicted in
Figure 4. In the latter scatter plot, it should be reminded that both 3DAV and ∆BT3D(k) have the same scale. To compare content’s
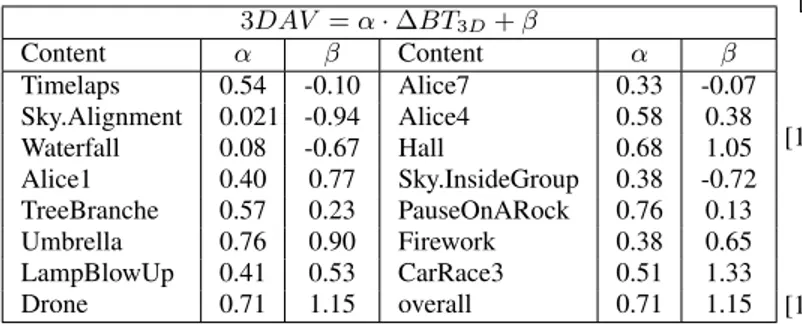
specificities it is proposed to perform a regression of the 3D added value (3DAV) as a function of ∆BT3D(k) (see Table 1).
The slope values (α) between the two factors range from 0.02 to 0.76. The result on the overall data is a slope of 0.71. This shows that on average, a quality variation of X will impact by 0.71 · X the added value of 3D over 2D. However, there are high fluctuations due to contents specificities (depth and comfort) which need to be stud-ied further. The values of β provides information on the added value of the content when available at the highest quality possible and then its suitability to be presented in 3D. Considering the high variation inter-content of α and β a characterization of the scenes appears to be needed for the development of 3D-QoE models. This is part of on-going work. 3DAV = α · ∆BT3D+ β Content α β Content α β Timelaps 0.54 -0.10 Alice7 0.33 -0.07 Sky.Alignment 0.021 -0.94 Alice4 0.58 0.38 Waterfall 0.08 -0.67 Hall 0.68 1.05 Alice1 0.40 0.77 Sky.InsideGroup 0.38 -0.72 TreeBranche 0.57 0.23 PauseOnARock 0.76 0.13 Umbrella 0.76 0.90 Firework 0.38 0.65 LampBlowUp 0.41 0.53 CarRace3 0.51 1.33 Drone 0.71 1.15 overall 0.71 1.15 Table 1: Relationship between added value of 3D and difference of BT-score between coding and reference condition.
5. CONCLUSION
In this paper, 3D QoE was evaluated by using paired comparison. This way, preference of 3D could be investigated as a function of pic-ture quality. Results show that increasing picpic-ture quality increases
the probability of preference of 3D over 2D. On average, a VQM score of 0.24 was found to be required to ensure preference of 3D over 2D. Bradley-Terry scores were estimated, and the “3D added value” was determined. The results show that, on average, there is a factor of 0.71 between variation of pictorial quality and “3D added value”. There is however lots of variation between contents, which will be investigated in further studies.
6. REFERENCES
[1] Alexandre Benoit, Patrick Le Callet, Patrizio Campisi, and Ro-main Cousseau, “Quality assessment of stereoscopic images,” in ICIP, 2008, pp. 1231–1234.
[2] Kjell Brunnstr¨om et al., “2D no-reference video quality model development and 3D video transmission quality,” in Int. Work-shop of (VPQM), Scottsdale, Arizona, USA, 2012.
[3] P Seuntiens, Visual experience of 3D TV, Ph.D. thesis, Eind-hoven University, 2006.
[4] ITU-T Contribution COM 12-C192-E, “Comparison of the ACR and PC evaluation methods concerning the effects of video resolution and size on visual subjective ratings,” in ITU, SG12 Meeting, Geneva, Jan 2011.
[5] J. C. Handley, “Comparative analysis of Bradley-Terry and Thurstone-Mosteller model of paired comparisons for image quality assessment,” in PICS, April 2001.
[6] Jing Li, Marcus Barkowsky, and Patrick Le Callet, “Analysis and improvement of a paired comparison method in the ap-plication of 3DTV subjective experiment,” in ICIP, Orlando, Florida, USA, October 2012.
[7] Jong-Seok Lee, Lutz Goldmann, and Touradj Ebrahimi, “Paired comparison-based subjective quality assessment of stereoscopic images,” Multimedia Tools and Applications, pp. 1–18, February 2012.
[8] Marcus Barkowsky, Romain Cousseau, and Patrick Le Cal-let, “Influence of depth rendering on the quality of experience for an autostereoscopic display,” in International Workshop on Quality of Multimedia Experience, San Diego, California, USA, 07 2009, p. 6.
[9] Pierre Lebreton, Alexander Raake, Marcus Barkowsky, and Patrick Le Callet, “Evaluating depth perception of 3D stereo-scopic videos,” IEEE Journal of Selected Topics in Signal Pro-cessing, vol. 6, pp. 710–720, October 2012.
[10] Matthieu Urvoy and et al., “NAMA3DS1-COSPAD1 : Sub-jective video quality assessment database on coding conditions introducing freely available high quality 3D stereoscopic se-quences,” in Fourth International on Quality of Multimedia Experience, Yarra Valley, July 2012.
[11] Pierre Lebreton et al., “A subjective and objective evaluation of a realistic 3D IPTV transmission chain,” in Packet Video Workshop, Munich, Germany, 2012.
[12] Roumes C, Plantier J, Menu JP, and Thorpe S, “The effects of spatial frequency on binocular fusion: from elementary to complex images,” Human Factors, vol. 39, no. 3, pp. 359–373, Sep 1997.
[13] Kazuhisa Yamagishi, Lina Karam, Jun Okamoto, and Takanori Hayashi, “Subjective characteristics for stereoscopic high def-inition video,” in QoMEX, Mechelen, Belgium, 2011.