HAL Id: hal-03118783
https://hal.archives-ouvertes.fr/hal-03118783
Preprint submitted on 22 Jan 2021
HAL is a multi-disciplinary open access archive for the deposit and dissemination of sci-entific research documents, whether they are pub-lished or not. The documents may come from teaching and research institutions in France or abroad, or from public or private research centers.
L’archive ouverte pluridisciplinaire HAL, est destinée au dépôt et à la diffusion de documents scientifiques de niveau recherche, publiés ou non, émanant des établissements d’enseignement et de recherche français ou étrangers, des laboratoires publics ou privés.
How should individuals’ retirement plans adjust to
demographic changes?
Edouard Ribes
To cite this version:
Edouard Ribes. How should individuals’ retirement plans adjust to demographic changes?. 2021. �hal-03118783�
1 | P a g e
How should individuals’ retirement plans
adjust to demographic changes?
1
Perspectives from EU5 countries
Edouard Ribes, CERNA, Mines Paristech, France, email : edouard-augustin.ribes@mines-paristech.fr
Abstract
This article forecasts (using a simple lifecycle model) that within EU5 countries, demographic changes will lead to drastic reduction in public pensions allowance by 2066. For instance, in france, retirement allowance is likely to go from 60% of one’s working salary to less than 30%. To compensate for this decline in guaranteed earnings, the model developed in this paper recommends individuals to increase their level of personal savings (via financial instruments) by 2 to 3% per year. The outcome of those changes on retirement plans should be that retirement earnings should be much more similar across EU5 countries than they are today, that individuals should experience a smoother transition in their retirement and that earnings and financial wellbeing should stabilize as people age.
JEL classification. H55, H75, J32.
Keywords. Retirement plans, public pension, demographic trends.
I.
Introduction
Over the past decades, the health of mature countries’ population has greatly benefited from the advances of science. The result has been a steady increase in life expectancy. But if individuals live longer, there is to date no proof that their ability to produce wealth for the society over their lifecycle has changed (i.e. its increases in its early stages, plateaus and then declines starkly after 40 to 45 years of activity (Lazear 1979) (Hellerstein, Neumark et Troske 1999) (Börsch-Supan et Weiss 2016). For instance, most states have kept the mandatory retirement age over the past 40 to 50 years relatively unchanged (i.e. it oscillates around 65 years). The result at country level is that an increasing share of the population, which can no longer contribute to the society, depends on the state through retirement allowances. This holds particularly true in the EU5 (france, Germany, Italy, Spain, UK) countries, which have traditionally had strong public pensions programs.
The problem is not new and has been acknowledged at the beginning of the century (Poterba 2014). Since then states have started series of reforms. Their role is indeed to reallocate wealth from their active population towards its elderly at any point in time and the general rule they have followed is to keep collecting the same number of active workers and to reduce individuals pension allowances (Fanti 2015). The outcome is that individuals have now to increase their personal savings whilst active to bridge this reduction in public allowances at a later stage of their life.
1 The findings and opinions expressed in this paper are those of the author(s) and do not reflect any positions from
2 | P a g e
But empirical findings have shown that individuals are currently not so well equipped to make the transition (at least financially speaking) and that many of them experience a reduction in their expenditures as they retire (Haider et Stephens Jr 2007) (Hurd et Rohwedder 2008). There have been several explanations proposed by the literature over the years. They range from positive ones, such as the fact that retirees can substitute time for consumption, to more negative (i.e. the fact that a large fraction of the population does not have enough economic or financial literacy to address the problem by itself (Sekita 2011), (Ricci et Caratelli 2017), (Kadoya, et al. 2018)). But the fact remains that individual preferences lean towards increasing ones’ livings standards and financial well-being over time if not increasing it (Brüggen, et al. 2017). To make individual self-aware, the academic community has found that they had to be presented with the fact (i.e. what does it mean for me if I don’t save?) (McGowan, Lunn et Quay 2019).
This paper therefore proposes a very simple lifecycle model following the footsteps of (Cocco, Gomes et Maenhout, Consumption and portfolio choice over the life cycle. 2005), (Cocco et Gomes 2013) and (Heer, Polito et Wickens 2020). The model highlights how individual’s reliance on public scheme is likely to evolve over time2 given the demographic shifts & trends observed across EU5 countries. This
model, detailed in section II, is used to inform a discussion around the amount of savings individuals should start to make to compensate for the steady decline in pension allowance. This reality check is complemented by a small discussion around the implications on individual’s welfare when they will hit retirement in the next decade(s).
II.
A lifecycle model:
Individuals are productive members of the society. Their lifecycle is made of three parts (Browning et Crossley 2001). First, individuals are born and trained to contribute to the society. This learning period last 𝜏𝑙 years and come at a cost 𝐶 ≥ 0 per unit of time. Individuals then become active and start
contributing by taking up a job. By doing so, they generate an income 𝐼 ≥ 0. Individuals remains active whilst their health is sufficient for them to remain productive. After 𝜏𝐴 years of activity, individuals retire
as their ability/productivity has declined (Lazear 1979) (Skirbekk 2004). As retired individuals’ health continues to deteriorate over time, they start dying at a rate3 𝑑.
If individuals’ livings standards are covered by their family during their training and then by their activity, they must find a way to fund their retirement. This is generally done through a mix of public pension schemes and personal savings. This section will therefore first propose a simple model describing the evolution of a population and its implications with respect to public pension schemes. This will then be used to model how personal savings can be used to complement public allowances for retirees to cover their living expenditures.
A.
Public pensions and population dynamics:
Public pensions consist in providing a fixed retirement allowance every year/month to individuals. This allowance is worth a portion 𝑝 of active individuals wages (i.e. retirees get 𝑝. 𝐼 from the state). The allowance is structured by states/countries based on the demographics of their population. Let us assume
2 Note that the aim of this paper is not to provide an accurate forecast on pension allowance or personal savings
level but to provide a direction of travel and some reasonable orders of magnitude to be better prepared for the change we all face.
3 Retirees therefore have an average life expectancy of 1
3 | P a g e
that 𝑝(𝑡, 𝑥) represents the number of individuals of age 𝑥 at time 𝑡 in a certain location and that the population has reached a steady state. Under this equilibrium assumption, the overall population 𝑃(𝑡) evolve over time, but its age make-up/distribution 𝑔(𝑥) (with∫𝑥≥0𝑔(𝑥)𝑑𝑥 = 1 ) remains unchanged. In this context, the time and age variables in the distribution 𝑝(𝑡, 𝑥) can be separated, such that 𝑝(𝑡, 𝑥) = 𝑃(𝑡). 𝑔(𝑥). The natural aging pattern described earlier implies that population dynamics follow a Kolmogorov-type of dynamic (i.e. 𝜕𝑡𝑝(𝑡, 𝑥) + 𝜕𝑥𝑝(𝑡, 𝑥) = −𝑑. 1𝑥>𝜏𝑙+𝜏𝑎. 𝑝(𝑡, 𝑥)). It can then easily be
shown that this leads to a population model where the overall population grows at a constant rate 𝜇 (i.e. 𝑃(𝑡) = 𝑃(0). 𝑒𝜇.𝑡 and where the state’s age profile has an exponential profile (i.e. 𝑔(𝑥) =
𝜇.𝑑
𝑑+𝜇.𝑒−𝑑.(𝜏𝑙+𝜏𝑎). 𝑒
−(𝜇.𝑥+1𝑥≥𝜏𝑙+𝜏𝐴𝑑.(𝑥−𝜏𝑙−𝜏𝐴)). Note that in this set up, the proportion of new born (i.e. birth
rate 𝑏) in the population is set at 𝑏 =𝑝(𝑡,0)𝑃(𝑡) = 𝜇.𝑑
𝑑+𝜇.𝑒−𝑑.(𝜏𝑙+𝜏𝑎) and that there is a relationship between the
population growth (𝜇) and both its health (𝜏𝑎,𝑑) and fertility (𝑏).
The pensions of the 𝑅(𝑡) = 𝑃(𝑡). ∫𝑥≥𝜏 𝑔(𝑥). 𝑑𝑥
𝑙+𝜏𝑎 retirees are then funded by taking a portion 𝜃 (via a
tax) of the income of the 𝐴(𝑡) = 𝑃(𝑡). ∫𝑥≥𝜏𝜏𝑎+𝜏𝑙𝑔(𝑥). 𝑑𝑥
𝑙 active members of the society. For this pension
scheme to be sustainable, pension related expenses must be covered by the amount collected via taxes. (i.e. 𝑝. 𝐼. 𝑅(𝑡) = 𝜃. 𝐼. 𝐴(𝑡)).
Property 1. In an environment where individual health and fertility are not parameters a state can control (i.e. 𝜏𝐴, 𝑑 and 𝜇 are exogenous), for the state to provide public pension in a sustainable manner, the
following relationship between public pensions allowances 𝑝 and the level of tax 𝜃 the state collects must exist:
𝑝 = 𝜃. (𝑒𝜇.𝜏𝑎− 1).(𝜇 + 𝑑)
𝜇
B.
Personal expenditures and retirement savings:
Now if the population dynamics set the level of allowance retirees can expect from a public scheme, the replacement rate of pensions (𝑝) is usually insufficient to cover individuals’ expenditures post retirement. Individuals have therefore to privately save and invest a portion 𝑠 of their income 𝐼 whilst active to complement the public scheme. This investment can be realized in financial assets yielding a return4 𝑟 over time. The outcome of this continuous savings effort is that individuals end up having a lump
sum (worth 𝑠. 𝐼. ∑ (1 + 𝑟)𝑘
𝑘≤𝜏𝑎 =
𝑠
𝑟. 𝐼. ((1 + 𝑟)
𝜏𝐴+1− 1) ) available during their retirement. Since retirees
live on average 1
𝑑 years, their savings and public pension grants them an average budget of 𝑝. 𝐼 + 𝑑.𝑠
𝑟 . 𝐼. ((1 + 𝑟)
𝜏𝐴+1− 1) per period of time available for their personal expenditures.
Interestingly, if public annuities provide a constant revenue over time, personal savings do not yield a constant revenue across periods for retirees. Under the structural population assumptions described in section II-A, the constant death rate hypothesis implies that retirees indeed expect to live an extra 1𝑑 years for each year that passes if they are still alive. As a result, retirees of age 𝑥 should will dynamically adjust
4 | P a g e
the amount they withdraw from their personal savings, such that they will get a total of 𝐼̌ = 𝑝. 𝐼 +
𝑠
𝑟. 𝐼. ((1 + 𝑟)
𝜏𝐴+1− 1). 𝑑. 𝑒−𝑑.𝑡.
But beyond planning for retirement (either via a public tax at a rate 𝜃 or via a personal saving scheme at a rate 𝑠), active individuals have also to support the training of the new generation. Assume for the sake of simplicity that as soon as individuals become active, they give birth to a new generation and that their period of activity is long enough to fully support the associated training (i.e. 𝜏𝑎 > 𝜏𝑙). In that set up, each
individual has to support a number 𝑛 =𝑔(𝜏𝑔(0)
𝑙)= 𝑒
𝜇.𝜏𝑙 of children, which means that active individuals end
up having an average budget of 𝐼. (1 − 𝜃 − 𝑠) − 𝑒𝜇.𝜏𝑙. 𝐶.𝜏𝑙
𝜏𝑎 per period of time available for consumption.
Property 2. For individuals to have the same average level of wealth during retirement as what they had enjoyed during their activity5, they must strive to save a portion 𝑠 of their income equal to:
𝑠 = (1 − 𝜃. (1 + (𝑒𝜇.𝜏𝑎− 1).(𝜇 + 𝑑) 𝜇. 𝑑. 𝜏𝑎) − 𝑒 𝜇.𝜏𝑙.𝐶 𝐼 . 𝜏𝑙 𝜏𝑎) (1 +((1 + 𝑟)𝑟. 𝜏𝜏𝐴+1− 1) 𝑎 )
Property 2 has a couple of key features. First, it shows that personal savings levels (i.e. 𝑠) should increase when life expectancy increases (i.e. 𝑑 decreases). Second, it highlights that when training costs are important, savings dedicate to retirement decrease as training negatively impact the wealth of active individuals. Finally, it also illustrates that the lower the returns of financial instruments used in personal savings scheme, the higher the savings needs.
In summary, section II offers a simple model lifecycle model showcasing how individuals should prepare their retirement depending on the demographic characteristics of the population they belong to. The next section will now focus on using this model in the context of EU5 countries (France, Germany, Italy, Spain, the UK) to discuss to which extent demographics shifts may trigger adjustments on individual expenditure profiles.
III. Individual retirement plans across EU5 countries – what should we
expect?
Mature countries have experienced significant demographics shifts over the past decades (i.e. ageing population and decreasing fertility). This has notably been reported by the OECD (organization for the economic cooperation and development). As a result, states have started to reform their public pension programs. This means that individuals already have had to adjust their personal savings levels. Given that more change is expected over the near future, this section will offer a few suggestions in terms of how EU5 individuals should keep adjusting their expenditures. This will be done by first leveraging the OECD database to understand the past and possible future evolution of the EU5 demographic patterns and then by using the associated insights in conjunction with the model developed in section II to discuss implications at an individual level.
5 This means that 𝑝. 𝐼 +𝑑.𝑠
𝑟 . 𝐼. ((1 + 𝑟)
𝜏𝐴+1− 1) = 𝐼. (1 − 𝜃 − 𝑠) − 𝑒𝜇.𝜏𝑙. 𝐶.𝜏𝑙
5 | P a g e
A.
OECD data & demographic forecasts:
The OECD database provides a wealth of information on the population of its constituents. Amongst them are the EU5 countries (France, Germany, Italy, Spain & the UK). For that scope, the OECD records not only provide the number of individuals in each country (i.e. 𝑃(𝑡)) between 1960 and 2018, but also the number of deaths per year as well as a break down of the population per age groups. Interestingly, the legal retirement age (which represents the point where individual’s ability declines to the point where labor is no longer profitable) has not changed drastically over the past 40 years or so. If life expectancy has increased, retirement age (i.e. 𝜏𝑎 + 𝜏𝑙) has remained stable around 65 years. Therefore, the retired
population (𝑅(𝑡)) can be approximated in the OECD records has the number of individuals aged 65 and beyond. The death rates of EU5 countries (𝑑) defined in the model can then be calculated as the number of death in the population in a given year divided by the number of retirees, whilst the growth rate of the population (i.e. 𝜇) can be approximated as (𝜇 =𝑃(𝑡+1)
𝑃(𝑡) − 1).
EU5 demographics (calculated under those conventions) are displayed in figure 1. At first glance it appears that population growth rates have remained relatively unchanged over time while death rates have been steadily decreasing. A forecast can be drawn from this data. When it comes to the population growth rates, a simple linear regression can be used to assess its variance over time (i.e 𝜇(𝑡) = 𝛼𝜇+ 𝛽𝜇. 𝑡) and project
is evolution in the future. Similarly, death rates variance over time can be modeled through a power law (i.e. 𝑑(𝑡) = 𝛼𝑑. 𝑡𝛽𝑑 ) and this can be used to inform a projection over the next couple of years. Calibration
results to the OECD dataset are displayed in table 1.
Figure 1 - EU5 demographics parameters evolution over time - source OECD
France Germany Italy Spain UK
𝛽𝜇 -9.2 10E-6 -14.4 10E-6 7.2 10E-6 5.0 10E-6 4.1 10E-6
𝛽𝑑 -20.4 -16.9 -35.7 -43.8 -17.3
Table 1 - EU5 demographics sensitivity to time - calibrated on the OECD dataset
Now that the evolution of EU5 demographics is understood, the steady state model developed in section II can be used to assess how retirements plans could evolve. This will be done with a few assumptions. First, an estimation of population growth and death rates will be provided for 2066. This timeframe should be relevant for readers as it will highlight the behavior an individual who joins the workforce in 2021 should
0% 2% 4% 6% 8% 10% 12% 1960 1970 1980 1990 2000 2010
Death rates evolution across EU5 countries
France Germany Italy Spain United Kingdom
-3% -2% -1% 0% 1% 2% 3% 4% 1960 1970 1980 1990 2000 2010
Population growth rates evolution across EU5 countries
6 | P a g e
adopt after an average training of 𝜏𝑙 = 20 years. Those estimates will then be fed to the model assuming
that individuals can either rely on a mixture of public pensions and personal savings leveraging financials instruments. Financial instruments will be assumed to yield a return 𝑟 = 3%. Finally, note that current public pension allowance level (i.e. 𝑝) are also given by the OECD [France: 60%, Germany, 38.7%, Italy: 79.5%, Spain: 72.3% and UK: 21.4%]. The results of this quantitative exercise will be discussed in the next sub section.
B.
Implications at individual level:
To manage their public pension scheme in a context where population dynamics are shifting, states have two main options. First, they can adjust the level of tax (i.e. 𝜃) on the active population to keep pension allowance (i.e. 𝑝) unchanged. Another option is to leave the level of tax as is but change the amount retirees perceive. Of course, the two options could be blended (i.e. a state could adjust both tax and pension allowance levels) to account for the preferences of its constituent. However, this is not something that this paper will explore as its aim is to provide directional insights.
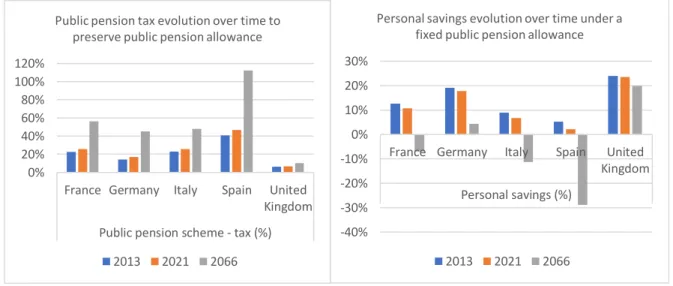
What’s interesting in light of the dynamics highlighted in section III-A through the OECD dataset is that outside of perhaps of the UK, EU5 countries simply cannot sustain the same level of public retirement allowance in the future. The toy model developed in this paper indeed shows that EU5 demographic shifts would results in unsustainable taxations level (50%+ by 2066) and would result in individuals solely relying on public pensions to fund their retirement (i.e. no need for personal savings). Details are provided in figure 2.
Figure 2 - What's happening if the state strives to maintain its current level of public pension allowances?
On the other hand, if state choose to keep the level of tax they collect unchanged, demographic shifts appear much more manageable. The model shows that the ageing population will result in a much smaller public pension allowance but that a small increase in personal savings should be able to preserve retirees’ lifestyle. Looking at the results displayed in figure 3, public pensions allowances are indeed forecasted to be halved if not more by 2066 compared to where they are now (this echoes some recent findings – see (Díaz-Giménez et Díaz-Saavedra 2017) for a discussion on Spain). For instance, in France, public pension allowance currently covers between 50% and 60% of a worker’s salary. But in 2066, French retirees should perceive less than 25% of a worker’s wage. Note that those type of changes are relatively simple to
0% 20% 40% 60% 80% 100% 120%
France Germany Italy Spain United Kingdom Public pension scheme - tax (%) Public pension tax evolution over time to
preserve public pension allowance
2013 2021 2066 -40% -30% -20% -10% 0% 10% 20% 30%
France Germany Italy Spain United Kingdom Personal savings (%)
Personal savings evolution over time under a fixed public pension allowance
7 | P a g e
implement. States simply must avoid readjusting retirements allowance to meet the inflation. Given that inflation is of 1 to 2% per year across the EU5, doing nothing on retirements achieves the desired result.
Figure 3 - What's happening if the state decides to maintain the same levels of taxes to fund its public pension scheme?
At an individual level, figure 3 also shows that to mitigate the decrease in public funding, individuals simply have to increase their personal savings level by a 1 to 3% percent. This is of course directional and relies on several assumptions (for instance the rate of returns on financial instruments (in this case 3%)). But this exercise mainly shows that with enough discipline (i.e. investing consistently year over year) and a small personal effort, retirement should be easy to prepare for. For instance, in france, savings 15% of one’s income (post tax) should enable individuals to preserve their lifestyle throughout retirement.
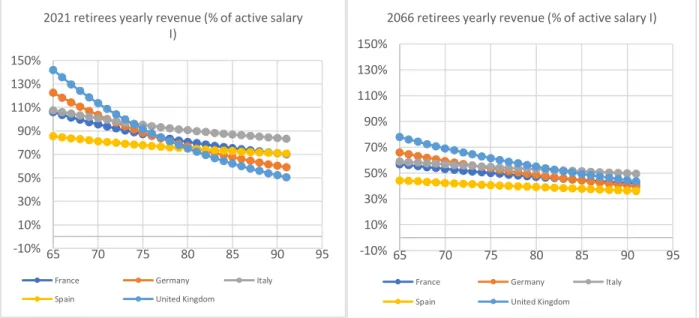
Figure 4 - Retirees revenue evolution with age in 2021 & 2066 if the state keeps the same level of taxes for public pensions.
There is however one caveat to this change. Public pensions guarantee fixed annuities to individuals (i.e. individual always get the same amount over time), whilst a personal savings scheme require individuals to
0% 20% 40% 60% 80% 100%
France Germany Italy Spain United Kingdom Pension allowance (%)
Public pension allowance evolution over time under a fixed public tax scheme
2013 2021 2066 0% 5% 10% 15% 20% 25% 30%
France Germany Italy Spain United Kingdom Personal savings (%)
Personal savings evolution over time under a fixed public tax scheme
2013 2021 2066 -10% 10% 30% 50% 70% 90% 110% 130% 150% 65 70 75 80 85 90 95
2021 retirees yearly revenue (% of active salary I)
France Germany Italy Spain United Kingdom
-10% 10% 30% 50% 70% 90% 110% 130% 150% 65 70 75 80 85 90 95
2066 retirees yearly revenue (% of active salary I)
France Germany Italy Spain United Kingdom
8 | P a g e
make withdrawal to their own funds based on their current health and life perspectives. This comes with a few implications, which can be seen on figure 4. Current optimal retirement plans and death rates provides individuals with high retirement allowance as they leave the workforce. Relatively high death rates indeed lead them to use their personal funds early on, to the point that today, by the age 80 -85, if retirees are still alive, they will have used most of their personal savings. The forecast for 2066 is however a bit different. The increase in life expectancy will lead individuals to have much more conservative allocations. Interestingly, the model also stresses that in today’s world retirees may even enjoy very high retirement standards (i.e. if they have saved enough, their early years come with a boost in terms of living standard), whilst they may experience a much leaner financial situation in their older age. But by 2066, the increase in life expectancy should reduce those inequalities.
IV. Conclusion
Recent scientific developments may have led individuals to live longer lives, but not necessarily more productive ones. To address those changes, EU5 residents must allocate their wealth differently across their lifecycle and notably change the way they plan for retirement. This note first shows that public pensions, which are currently the main instrument on which people rely one, are likely to be halved by 2066 and that most of retirees’ income will have to come from personal savings. But the situation is not dire. This note indeed also shows that the savings effort required at an individual level to keep up a lifestyle during retirement similar to the one during one’s activity period will only have to increase by a few percent (e.g. if an individual currently save 12% of its annual income to prepare for retirement, it should simply bump up its savings level to about 14 to 15% to mitigate public pensions decreases). Finally, this short article also highlights that an increase life expectancy also means that retirees will enjoy a much more stable income in the future than today. It is indeed difficult to allocate personal savings today into an annual rent due to health hazard (e.g. by the point an individual reaches age 80-85, its yearly retirement allowance has been halved). But as individuals’ health improves, so will individual ability to smoothly allocate their past earnings.
V.
References
Börsch-Supan, A., and M. Weiss. 2016. "Productivity and age: Evidence from work teams at the assembly line." The Journal of the Economics of Ageing 30-42.
Browning, M., and T.F. Crossley. 2001. "The life-cycle model of consumption and saving." Journal of
Economic Perspectives 3-22.
Cocco, J.F., and F.J. Gomes. 2013. "Longevity risk, retirement savings, and financial innovation. ." Journal
of Financial Economics 507-529.
Cocco, J.F., F.J. Gomes, and P.J. Maenhout. 2005. "Consumption and portfolio choice over the life cycle. ." The Review of Financial Studies 491-533.
Díaz-Giménez, J., and J. Díaz-Saavedra. 2017. "The future of Spanish pensions." Journal of Pension
Economics & Finance 233-265.
Fanti, L. 2015. "Growth, PAYG pension systems crisis and mandatory age of retirement." Economics
9 | P a g e
Haider, S.J., and M. Stephens Jr. 2007. "Is there a retirement-consumption puzzle? Evidence using subjective retirement expectations. ." The review of economics and statistics 247-264.
Heer, B., V. Polito, and M.R. Wickens. 2020. "Population aging, social security and fiscal limits." Journal of
Economic Dynamics and Control.
Hellerstein, J.K., D. Neumark, and K.R. Troske. 1999. "Wages, productivity, and worker characteristics: Evidence from plant-level production functions and wage equations." Journal of labor economics 409-446.
Hurd, M.D., and S. Rohwedder. 2008. "The retirement consumption puzzle: actual spending change in panel data." National Bureau of Economic Research.
Kadoya, Y., M.S.R. Khan, T. Hamada, and A. Dominguez. 2018. "Financial literacy and anxiety about life in old age: evidence from the USA. ." Review of Economics of the Household 859-878.
Lazear, E.P. 1979. "Why is there mandatory retirement?" Journal of political economy 1261-1284. McGowan, F.É.I.D.H.L.I.M., P.E.T.E. Lunn, and J.R.S. Quay. 2019. "Supporting decision-making in
retirement planning: do diagrams on pension benefit statements help. ." Journal of Pension
Economics & Finance 1-21.
Poterba, J.M. 2014. "Retirement security in an aging population. ." American Economic Review 1-30. Ricci, O., and M. Caratelli. 2017. "Financial literacy, trust and retirement planning." Journal of Pension
Economics & Finance 43.
Sekita, S. 2011. "Financial literacy and retirement planning in Japan. ." Journal of Pension Economics and
Finance 637–656.
Skirbekk, V. 2004. "Age and individual productivity: A literature survey. ." Vienna yearbook of population