Université de Montréal
Impact d’une suralimentation prolongée et d’une
supplémentation en polyphénols sur le profil d’activité
physique et de sédentarité
par Valérie Giroux
École de kinésiologie et des sciences de l’activité physique Faculté de médecine
Mémoire présenté
en vue de l’obtention du grade de deuxième cycle en sciences de l’activité physique
Juillet, 2018
Résumé
La surnutrition est une méthode classique pour investiguer les mécanismes de régulation de la masse corporelle chez l’humain. Le concept qu’une surnutrition pourrait produire des changements de la dépense énergétique, de la sédentarité et du profil d’activité physique ayant un rôle important sur la balance énergétique a été le sujet de nombreuses études, mais il demeure incomplet. Par exemple, aucune étude de surnutrition à ce jour n’a mesuré à la fois la sédentarité et le profil d’activité physique. Ce projet comprend donc une approche globale où dix-sept paramètres de sédentarité et d’activité physique ont été mesurés avant et après une suralimentation de 31 jours à 150% de la dépense énergétique journalière. La diète était constituée de collations riches en lipides et en glucides. Les sujets étaient évalués dans un contexte de vie réelle à l’aide d’accéléromètres. Une autre avancée concernant le projet de ce mémoire est l’utilisation d’une supplémentation en polyphénols (procyanidine, anthocyane et resvératrol) de 2g par jour obtenue à partir de raisins rouges pour vérifier si elle peut protéger des effets délétères de la suralimentation en analysant comment elle peut affecter le profil d'activité physique. Alors que le temps passé à courir et la dépense énergétique de repos ont augmenté de 49.0% dans le groupe placébo et 49.1% dans le groupe polyphénols et de 2.3% dans le groupe placébo et 2.2% dans le groupe polyphénols, respectivement, au cours du protocole de suralimentation, il n'y a pas eu d'interaction entre la supplémentation en polyphénols et la suralimentation sur les paramètres de sédentarité et d'activité physique. Il est intéressant de noter que l'indice de mesure de l’activité physique non structurée, associé dans la littérature scientifique au piétinement, à la station debout et à la marche, diminue en cours de suralimentation, suggérant des changements adaptatifs plus subtils au niveau de l’activité physique, tels que remuer, la contraction musculaire spontanée et le maintien de la posture. Cette observation doit toutefois être validée par des études futures. Mis-à-part ceci, peu de changements ont été observés suite à une consommation en polyphénols et une surnutrition. Mots-clés : suralimentation, polyphénols, activité physique, dépense énergétique, sédentarité, accéléromètre, collations, environnement obésogène
ii
Abstract
Overfeeding has been a classical technique for investigating the mechanisms of body weight regulation in humans. The concept that changes in energy expenditure, sedentary time and physical activity parameters may play an important role in the regulation of energy balance has been the subject of many investigations, but our understanding remained incomplete. For example, no overfeeding study to date has measured both sedentary and physical activity profiles. This research project thus includes a global approach where seventeen sedentary and physical activity parameters were assessed before and following 31 days of overfeeding at 150% of daily energy expenditure. The diet consisted in snacks rich in fat and sucrose. Subjects were assessed in a free-living condition using accelerometers. Another novelty of this work is that we investigated if the use of 2g/day of a polyphenol supplementation (procyanidin, anthocyanin and resveratrol) obtained from red grapes can protect from overfeeding and how activity profile can be impacted by this supplementation. While time spent running and resting energy expenditure increased by 49.0% in the placebo group and 49.1% in the polyphenols group and 2.3% in the placebo group and 2.2% in the polyphenols group respectively over the course of the overfeeding protocol, there was no interraction of polyphenol supplementation and overfeeding on sedentary and physical activity parameters. Interestingly, the non-exercise activity thermogenesis index, linked to trampling, standing and walking decrease with overfeeding, suggesting adaptive changes in more subtle elements of none-volitional physical activities, such as fidgeting, spontaneous muscle contraction and maintaining posture when not recumbent. This observation must however be validated by a future investigation. Aside from these findings, few changes have been observed following polyphenol consumption and overfeeding.
Keywords : overfeeding, polyphenols, physical activity, energy expenditure, sedentariness, accelerometry, snacking, obesogenic environment
Table des matières
Résumé ... i
Abstract ... ii
Table des matières... iii
Liste des figures ... v
Liste des sigles ... vi
Remerciements ... vii
Introduction ... 1
La problématique de la prise de masse corporelle ... 1
Les causes de la prise de poids menant à l’obésité ... 3
Le renversement de la prise de masse corporelle et de l’obésité ... 5
La dépense énergétique reliée à l’activité physique en contexte de surnutrition ... 8
Physical activity, energy expenditure and sedentary parameters in overfeeding studies – a systematic review ... 11 Abstract ... 12 Background ... 13 Methods... 15 Results ... 19 Discussion ... 35 Limitations ... 41 Conclusions ... 42 References ... 44 Enjeux du projet ... 47
Effects of a snacking type overfeeding and a polyphenols supplementation on physical activity, energy expenditure and sedentary parameters ... 48
Abstract ... 49
Introduction ... 50
Method ... 52
iv Discussion ... 60 Acknowledgements ... 66 Conflict of Interest ... 66 References ... 67 Discussion ... 71
Rappel des résultats... 72
Surnutrition et profil d’activité spontanée ... 73
Supplémentation et activité physique ... 75
Avenues de recherche et limites ... 78
Implication dans le projet... 80
Conclusion ... 80
Bibliographie... 82
Annexe – Risk of bias assessment ... 90
Liste des figures
Figure 1. Facteurs influençant l’ingestion calorique et la dépense énergétique. Adaptation à partir de Manore, 2017 ... 4 Figure 2. Effets d’une surnutrition sur les composantes de la dépense énergétique totale. Image adaptée de Levine et al., 1999. ... 9
vi
Liste des sigles
CRP : protéine C-réactive
DIT : diet-induced thermogenesis
HMB : Beta-hydroxy-beta-méthylbutyrate IMC : indice de masse corporelle
Il-6 : interleukine 6
NEAT : non-exercise activity themogenesis (activité physique non structurée) TNF-α : facteur de nécrose tumorale alpha
Remerciements
À ma directrice de recherche, Marie-Eve, je ne saurai jamais assez te remercier pour ton soutien, ta disponibilité et tes conseils toujours constructifs… même à la marche!
À Martine Laville, Chantal Simon, Bérénice Segrestin et Sarah Shultz, grâce à qui je garde une expérience très positive des collaborations à l’international, merci pour votre confiance et votre ouverture d’esprit.
À Myrian Grondin et Denis Arvisais, merci pour votre aide précieuse dans l’utilisation appropriée des bases de données pour ma revue systématique de la littérature.
Aux Instituts de recherche en santé du Canada (IRSC), merci pour votre soutien financier.
À la maison internationale de l’Université de Montréal et aux Offices jeunesse internationaux du Québec (LOGIQ), merci pour le financement de mon séjour de recherche en Nouvelle-Zélande.
À toute l’équipe du Laboratoire d’Activité Physique et Santé (LAPS), avec qui je ne vois pas le temps passer, merci pour votre générosité et vos encouragements.
Introduction
La problématique de la prise de masse corporelle
Il fut un temps où la prise de masse corporelle était un signe de santé et de prospérité en occident (Vigarello, 2013). De nos jours, des aspects sociaux et culturels reliés à la prise de masse corporelle demeurent (Paeratakul, 2002; Nolin, 2007; Sobal, 2017). Par exemple, un mouvement d’acceptation du gras est apparu en Amérique du Nord au cours de la dernière décennie, remplaçant l’image de beauté qui était jusqu’alors associée uniquement à la minceur (Afful, 2015). Un individu gagnant de la masse grasse peut donc aussi bien rejoindre les attentes de sa société et/ou de sa culture qu’il peut s’en éloigner. Toutefois, ces étiquettes ne considèrent pas nécessairement la nature pernicieuse de la prise de masse corporelle. En effet, la prise de masse corporelle à elle-seule peut entrainer des conséquences notables sur la santé. Des augmentations mesurées dans le cadre d’études longitudinales sont associées à des changements nuisibles pour plusieurs paramètres cardiovasculaires et métaboliques, y compris la pression artérielle, la dyslipidémie, les marqueurs de l'inflammation systémique et la résistance à l'insuline (Alley and Chang, 2010 ; Berrahmoune et al. 2008 ; Chan et al. 1994 ; Fransson et al. 2010). Par exemple, un gain de masse corporelle entre 2.5 kg et 10 kg du début jusqu’à la moitié de l’âge adulte augmente l’incidence de risque relatif de 1.75 pour le diabète de type 2, de 1.13 pour les maladies cardiovasculaires et de 1.26 pour les cancers reliés à l’obésité et l’hypertension (Zheng, 2017).
La prise de masse corporelle peut éventuellement mener à l’obésité, qui est définie comme étant « une accumulation anormale ou excessive de graisse corporelle qui représente un risque
pour la santé » (OMS, 2018). Le statut d’obésité, mesuré via l’indice de masse corporelle (IMC) qui correspond au poids de la personne (en kilogrammes) divisé par le carré de sa taille (en mètres), représente un résultat de 30 kg/m2 ou plus. Selon l’Organisation mondiale de la santé (2017), une majorité de la population mondiale vit dans des pays où le surpoids (IMC égal ou supérieur à 25 kg/m2) et l’obésité font davantage de morts que l’insuffisance pondérale. Au Canada, l’obésité contribue directement entre 61% et 74% au cas de diabète de type 2, entre 17% et 32% aux cas d’ostéoarthrite, entre 14% et 21% aux cas de cancers colorectoraux, entre 8% et 14% aux cas de dépression et à 20% des cas de morts prématurées (Jansen et al. 2013). Une étude effectuée au niveau de la population européenne a établi que l’obésité à elle-seule contribue aux cardiopathies ischémiques à 35% et à l’hypertension à 55% (Brandt and Erixon, 2013). Ces résultats sont alarmants, d’autant plus que des données de 2008 basées sur des mesures directes de l’indice de masse corporelle révèle que 25,5% de la population canadienne adulte est obèse (Corscadden et al., 2011). Il s’agit de la dernière étude à ce jour utilisant des mesures directes chez une population canadienne, mais ce pourcentage ne semblerait pas en voie de diminuer selon une étude épidémiologique mondiale rassemblant des données de 1990 à 2015 (GBD Obesity Collaborators, 2017).
La prise de masse corporelle menant à l’obésité implique des dépenses économiques énormes pour la société. En effet, ses répercussions sur le plan de la santé s’accompagnent par des coûts monétaires élevés. En 2006, les coûts directs de santé au Canada étaient de 3,9 milliards dollars (hospitalisation, médicaments, médecins, service d’urgences) et de 3,2 milliards dollars en coûts indirects (coûts reliés à l’invalidité et à la diminution de la productivité causée par la maladie ou la mort prématurée) (Jansen et al. 2013). En 2012, le
3
coût total annuel attribué à l’obésité était de 200 milliards de dollars américain aux États-Unis et de 81 milliards d’euros annuellement en Europe (Cawley and Meyerhoefer, 2012; Hunt and Ferguson, 2014).
Enfin, la prise de masse corporelle est progressive et l’obésité se développe chez l’individu sur une période de temps pouvant aller de quelques mois jusqu’à plusieurs dizaines d’années et ce, autant de la naissance à la pré-adolescence (Agras, 2002), de l’adolescence à l’âge adulte (Kimm, 2002) et chez l’adulte (McTigue, 2002). Une fois le poids gagné, il est difficile à perdre et cela semble encore plus véridique lorsque la prise de poids s’est installée sur plusieurs années (Le Petit, 2006). Outre les études d’interventions en perte de masse corporelle, la compréhension du développement de l’obésité ainsi que le renversement de ses effets néfastes suscitent un intérêt marqué et ce, dans l’espoir d’agir également sur un plan préventif.
Les causes de la prise de poids menant à l’obésité
L’épidémiologie de l’obésité chez l’adulte permet de constater que les taux d’obésité étaient relativement stables avant les années quatre-vingt (Hu, 2008). Des augmentations considérables ont par la suite été observées, entre autre en Europe (Seidell, 1995) et aux États-Unis (Ogden, 2010). Selon l’Organisation mondiale de la santé (2017), le nombre de cas d’obésité a presque triplé mondialement depuis 1975, de sorte que 650 millions adultes étaient obèses en 2016, représentant 13% de la population mondiale âgée de 18 ans et plus. Au Canada, la prévalence de l’obésité a également triplé de 1985 à 2011, passant de 6,1 à 18,3% (Twells, 2014). Les facteurs hérités influenceraient jusqu’à 70% de la tendance à développer
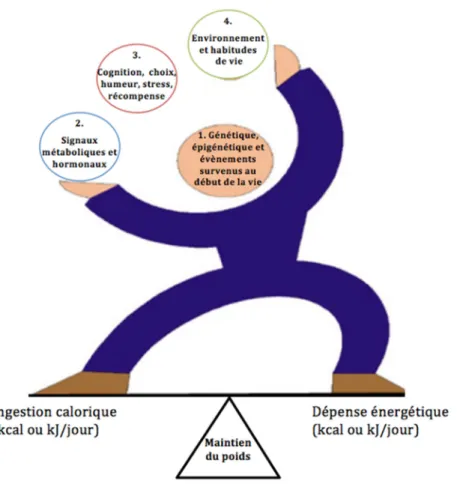
l’obésité (Stunkard, 1990). Toutefois, la génétique à elle-seule ne peut pas expliquer ces augmentations notables à partir des années quatre-vingt. Sachant que l’expression de ces facteurs hérités est en partie déterminée par l’environnement et les habitudes de vie, le développement de l’obésité est en partie sous contrôle volontaire. Tel que décrit à la Figure 1, la prise de masse corporelle considère un ensemble de facteurs qui se traduit par une balance énergétique dynamique.
Figure 1. Facteurs influençant l’ingestion calorique et la dépense énergétique. Adaptation à partir de Manore, 2017
À travers ce concept proposé par Manore (2017), il existe une nuance intéressante dans le fait que la balance énergétique considère l’ingestion calorique et la dépense énergétique comme étant interreliées, complémentaires et synergiques. Les fluctuations du poids corporel sont
5
ainsi influencées à la fois par la génétique, les signaux métaboliques et hormonaux, les éléments biopsychosociaux, l’environnement et les habitudes de vie. Sur cette lancée, plusieurs déterminants ont été établis comme causes potentielles. Des méta-analyses ont fait ressortir que la prise de masse corporelle est influencée positivement par une augmentation des calories ingérées (Rosenheck, 2008), la composition et la proportion des aliments ingérés (Romieu, 2017), le fait de grignoter (Nederkoorn, 2010) et le manque de sommeil (Cappucio, 2008). D’autres méta-analyses supportent aussi l’influence de facteurs plus ou moins contrôlables tels que le stress (Wardle, 2011), le statut économique (Evans, 2000; Newton, 2017) et un dérèglement hormonal et métabolique (Choi, 2013; Thota, 2017).
L’obésité est pour ainsi dire de nature multifactorielle. L’approche et la compréhension des études expérimentales évaluant les phases de la prise de poids doivent donc tenir compte de ce phénomène. Comme il sera possible de le constater dans les prochaines sections, l’étude principale de ce mémoire considère cette balance dynamique en mesurant de manière détaillée plusieurs paramètres d’activité physique et de sédentarité, tout en considérant leurs interactions avec une supplémentation nutritionnelle.
Le renversement de la prise de masse corporelle et de l’obésité
La prise de masse corporelle est associée à des complications pour la santé. Toutefois, existe-il des moyens de réduire ses effets délétères malgré un environnement obésogène? Swinburn et al. (2004) rapportent l’existence de plusieurs facteurs de protection contre l’obésité : une pratique d’activité physique régulière et une haute consommation de fibres comme étant statistiquement les plus convaincants. Outre la consommation de fibres, la présence
d’antioxydants aurait possiblement un rôle notable sur le renversement de la prise de masse corporelle. Les polyphénols, une classe de composés phytochimiques naturels, s’avèrent être des modulateurs de voies physiologiques et moléculaires impliquées dans le métabolisme énergétique, l’adiposité et l’obésité (Meydani, 2010). Au cours des deux dernières décennies, la communauté scientifique s’est intéressée à son rôle dans le maintien de la santé. Une revue systématique de la littérature réalisée en 2017 par Fahrat et al. conclut que les polyphénols pourraient prévenir des augmentations de la masse corporelle en condition de surnutrition, mais que d’autres études sont nécessaires afin d’affirmer qu’une supplémentation en polyphénols pourrait être une approche complémentaire aux interventions de régulation de la masse corporelle. Le rôle physiologique des polyphénols a été exploré par plusieurs. Des évidences existent concernant l’augmentation du métabolisme des lipides suivant la consommation de polyphénols (Vaughan, 2013; Mele, 2017). Cette consommation riche en polyphénols serait également suivie d’une augmentation de la dépense énergétique (Mahendra, 2017), via l’augmentation de la dépense énergétique de repos (Most, 2014; Dulloo, 1999) et la themogénèse alimentaire (Shixian, 2006). Le rôle d’une supplémentation en polyphénols sur la dépense énergétique a donc été étudié, mais aucune étude à ce jour n’a observé son effet sur le profil d’activité physique et de sédentarité en contexte de surnutrition.
Cette interaction entre l’ingestion de polyphénols et les paramètres de la dépense énergétique reliés à l’activité physique est d’autant plus intéressante compte tenu de l’effet protecteur d’un mode de vie actif sur la prise de masse corporelle. Une étude menée par Wang et al. (2017) indique que la susceptibilité génétique à prendre de la masse corporelle pourrait être diminuée par l’augmentation de la pratique d’activité physique. En effet, son étude menée auprès
7
d’environ 15 000 adultes supporte un changement de la masse corporelle de seulement 0.01 kg après 4 ans lorsqu’il y a une augmentation marquée de la pratique d’activité physique comparativement à une augmentation de 0.63 kg pour une pratique d’activité physique diminuée et ce, en considérant la susceptibilité génétique à la prise de masse corporelle. Le rôle de l’activité physique dans la prévention d’une prise de poids malsaine a également été étudié par Walhin en 2013. Lors de son étude impliquant une surnutrition d’une semaine à 50% de surplus énergétique, les effets négatifs sur la composition corporelle ont été renversés par la pratique journalière d’une activité physique d’intensité élevée (70% de la consommation maximale d’oxygène) d’une durée de 45 minutes. Au-delà de son impact sur la masse corporelle, la pratique d’activité physique permettrait aussi d’améliorer la composition corporelle, la santé cardiométabolique de l’individu et de prévenir plusieurs autres maladies chroniques, comme les maladies cardiovasculaires, le diabète, l’hypertension, la dépression et l’ostéoporose (Warburton, 2006). Plusieurs revues systématiques indiquent des réductions entre 25 et 50% du risque de développer des maladies chroniques chez les individus pratiquant 150 minutes d’activité physique d’intensité moyenne à élevée de façon hebdomadaire (Pederson, 2015; Stevens, 2014; Waburton, 2010; Tremblay, 2011). Il a été observé que la pratique d’activité physique augmente la longévité chez les individus avec surplus de poids ou obésité (McAuley, 2010). Un individu sédentaire augmentant son niveau d’activité physique entre 75 et 90 minutes par semaine aurait un risque de mortalité réduit de 15% (Stevens, 2014; Wen, 2011). Récemment, certaines études s’intéressent également aux interruptions de la sédentarité comme prédicteur du niveau de santé (Owen, 2010). De plus, un temps sédentaire plus bas est relié à un poids corporel moins élevé (Healy, 2008). Diminuer les comportements sédentaires entraine aussi des bénéfices à court et long terme sur la santé en diminuant entre
autres les risques de développer des désordres métaboliques ou une maladie cardiovasculaire (Wilmot, 2012; de Razende, 2014).
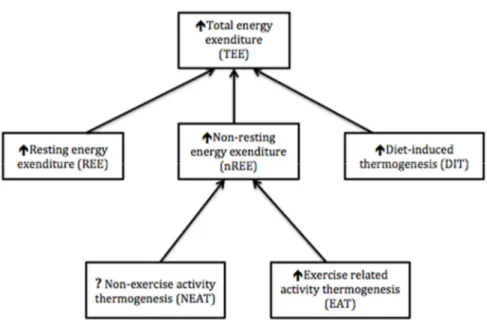
La dépense énergétique reliée à l’activité physique en contexte de
surnutrition
Comme il est illustré par la Figure 2, la dépense énergétique totale regroupe trois composantes, soit le métabolisme de repos, l’effet thermique de l’activité physique et l’effet thermique des aliments. À ce jour, il est reconnu que le métabolisme de base et l’effet thermique des aliments sont des composantes de la dépense énergétique totale qui augmentent de façon relativement prévisible en contexte de surnutrition. Le métabolisme de base s’est vu augmenté significativement de 5% (Levine, 1999) et de 8% (Ravussin, 1985) lors d’une sunutrition d’une durée de 56 jours et de 9 jours, respectivement. L’effet thermique des aliments augmente de 0 à 30% selon la composition des macronutriments lors d’une surnutrition (0 à 3% pour les lipides, 5 à 10% pour les glucides et 20 à 30% pour les protéines) (Tappy, 1996). Toutefois, l’effet thermique de l’activité physique, défini comme étant la composante de la dépense énergétique totale qui est causée par tout type de mouvement produit par les muscles squeletiques, est présentement moins documenté au sein de la littérature scientifique. Les études de surnutrition ont majoritairement observé les changements au niveau de la dépense énergétique reliée à un exercice volontaire. Ainsi, la dépense énergétique lors d’un exercice de faible intensité et de haute intensité augmente de manière statistiquement significative de 5,6% et 6,4% respectivement après seulement 24h de surnutrition (Dallosso, 1984). Néanmoins, lorsque l’exercice est structuré (ex. : 30 minutes d’exercice sur bicyclette à intensité moyenne), la dépense énergétique totale demeure plus
9
élevée que prévue en contexte de surnutrition (Levine, 1999). Suite à cette dernière observation, Levine et al. (1999) suggère l’existence d’activités involontaires qui seraient modifiées suite à une période de surnutrition, telles que gigoter, maintenir sa posture ou des activités spontanées de la vie quotidienne. Les études de surnutrition considérant cette composante ont pour la plupart été réalisées en laboratoire (Apolzan, 2014; Bray, 2015, He, 2012, Weyer, 2001, Klein and Goran, 2000). Ainsi, le concept selon lequel les changements au niveau de la dépense énergétique, du temps sédentaire et du profil d’activité physique en cours de surnutrition pourraient jouer un rôle important dans la régulation de la balance énergétique a été investigué, mais notre compréhension du phénomène demeure incomplète.
Figure 2. Effets d’une surnutrition sur les composantes de la dépense énergétique totale. Image adaptée de Levine et al., 1999.
Il est à ce stade important d’étudier les différentes mesures du profil d’activité physique. De plus, comme il a été soulevé par Levine et al. (1999), il semblerait y avoir une interaction entre la surnutrition et l’activité physique non volontaire, d’où l’importance de mesurer celle-ci en
milieu de vie réelle. Pour ce faire, l’accéléromètre est un outil de choix puisqu’il est l’un des outils qui peut mesurer de manière objective l'accélération du corps dans trois plans et ainsi fournir des informations sur la fréquence, l'intensité et la durée de l'activité physique (Warren, 2010). Sa fiabilité, sa validité et sa calibration ont connu des avancées considérables depuis sa première apparition dans le domaine des sciences de l’activité physique en 1983 (Montoye, 1983; Troiano, 2014). En effet, le perfectionnement de plusieurs modèles et d’algorithmes permet dorénavant une meilleure estimation des comportements reliés à l’activité physique (Troiano, 2014). L’utilisation d’un accéléromètre dans un contexte de vie réelle permet d’éviter le biais des questionnaires auto-rapportés qui consiste en une diminution des résultats reliés à la sédentarité et d’une augmentation des résultats reliés à l’activité physique (Clark, 2009). Reiley et al. (2008) ajoutent que l’accéléromètre, comparativement à d’autres outils de mesure tels que la chambre calorimétrique et l’eau doublement marquée, augmente la capacité de relier les variations du profil d’activité à la variation des résultats en matière de santé. L’accéléromètre serait donc un outil de choix en contexte de surnutrition, mais aucun article à ce jour n’a recensé son utilisation et celles des autres outils de mesure. Le premier article de ce mémoire est donc une revue systématique de la littérature observant le profil d’activité spontanée en contexte de surnutrition. Il a pour objectif de vérifier quels outils de mesure sont utilisés et quels sont les effets d’une surnutrition sur le profil d’activité spontanée. Cette première analyse permet de mieux comprendre la balance énergétique dynamique qui existe entre l’ingestion et la dépense calorique.
L’article Physical Activity, Energy Expenditure and Sedentary Parameters in Overfeeding Studies – A Sytematic Review sera présentée dans la section qui suit.
Physical activity, energy expenditure and sedentary
parameters in overfeeding studies – a systematic review
Giroux V1, Saidj S1, Simon C 2,3, Laville M 2,3, Segrestin B3 and Mathieu ME1,41 Université de Montréal, Department of Kinesiology, Montreal, Qc, Canada 2 CARMEN, INSERM U1060/University of Lyon/INRA U1235, Lyon, France
3 Human Nutrition Research Centre of Rhône-Alpes, Hospices Civils de Lyon, Lyon, France 4 CHU Sainte-Justine hospital, Montreal, Qc, Canada
Corresponding author Marie-Eve Mathieu,
Department of kinesiology, Université de Montréal,
P.O. Box 6128, Downtown Station, Montreal, Quebec (Canada), H3C 3J7. Email: me.mathieu@umontreal.ca
514-343-6737
Abstract
Background It has been proposed that compensations in physical activity, energy expenditure and sedentary parameters can occur as a result of overfeeding studies in order to maintain body weight; however, the evidence has not yet been systematically reviewed.
Methods The current study systematically reviewed the literature on this subject to determine the common tools used in overfeeding studies and to explore whether overfeeding produces changes in physical activity, energy expenditure and sedentary parameters. Eight electronic databases were searched to identify experimental studies using keywords pertaining to overfeeding, exercise, physical activity and sedentariness. Articles included healthy adults (aged 18-64 years) participating in an overfeeding study that examined at least one parameter of sedentary, energy expenditure or physical activity. Of 123 full-text articles reviewed, 15 met the inclusion criteria.
Results The common tools used in overfeeding studies were doubly labeled water (n = 6), room calorimeter (n = 4), accelerometer (n = 7), pedometer (n = 3), radar sensor (n = 4) and survey (n = 1). Parameters pertaining to energy expenditure increased between 7% to 50% with different overfeeding duration. Physical activity parameters, such as number of steps and spontaneous activity, increased or decreased significantly in three studies, while five studies showed no significant change. Sedentary parameters were examined by only one study and its results were not significant after three days of overfeeding. Methodological issues existed concerning the small number of studies, disparities in sedentary and physical activity parameters and various definitions of free-living experimental conditions and physical activity limits.
13
Conclusions There is actually a use of many tools and a large variation of parameters for physical activity in overfeeding studies. Contradictory findings showed changes in physical activity parameters following overfeeding and limited findings support the absence of changes in sedentariness. While energy expenditure parameters are more numerous and all show an increase after an overfeeding period, further studies are required to confirm changes in physical activity and sedentary parameters.
Keywords : Overfeeding, physical activity, exercise, sedentariness, energy expenditure, assessment
Background
Obesity is rising at an epidemic rate and is a burden on the population, given that 70% of obese individuals struggle with numerous physiological disturbances such as metabolic complications, inflammation, dyslipidemia, hypertension [1] and increased mortality risk [2]. While a positive energetic balance is a crucial determinant of obesity development, some experimental studies simulated this stage by increasing energy intake beyond energy requirements to maintain body weight. These overfeeding studies aimed to unravel the physiological adaptation to nutrient excess and in particular the evolution of 1) changes in body composition; 2) possible alterations in carbohydrates, lipids or proteins metabolisms; 3) changes in endocrine functions; and 4) changes in energy metabolism and mitochondrial function [3-5].
In this context of experimental overfeeding, it is of major importance to focus simultaneously on energy intake and energy expenditure to observe their mutual influence. Neumann [6] and Gullick [7] were two researchers who performed early overfeeding studies on themselves. At that time, Neumann created the term ‘luxus consumption’ that is, the
production of extra heat as a response to increased food intake. Today, overfeeding studies remained of interest in understanding the first adaptations resulting in weight gain. As recently reviewed, the average weight gain observed in most overfeeding studies are lower than expected, suggesting the presence of mechanisms that counteract the effects of excess energy intake [8]. In this field of investigation, small increases in resting metabolic rate and the thermic effect of food are mechanisms of interest, but only partially explain lower than expected body weight gain [9]. Consequently, some researches focused on adaptive thermogenesis, which includes resting energy expenditure and non-resting energy expenditure and explains the energy dissipation during overfeeding [10].
According to Schoeller [11], energy expended in physical activity (PA) is a component that accounts to a large degree of the variability in weight gain during overfeeding. Nevertheless, as Schutz [8] points out, explaining moderate weight gain only partially, the increase in physical activity thermogenesis cannot be the only mechanism at play. Levine et al., [9] suggested in 1999 the existence of non-exercise activity thermogenesis (NEAT), defined as ‘thermogenesis’, that accompanies physical activities other than volitional exercise such as the activities of daily living, fidgeting, spontaneous muscle contraction, and maintaining posture when not recumbent. Measuring NEAT was a real challenge at the time. Nevertheless,technological advances put forward by many authors such as accelerometry now allow the measurement of some of these components in a daily lifestyle setting [12]. The aims of the current systematic review are thus 1) to examine the common tools measuring PA, energy expenditure and sedentary parameters in overfeeding studies and 2) to explore whether overfeeding produces changes in these parameters.
15
Methods
The review was conducted in accordance with the Preferred Reporting Items for Systematic reviews and Meta-Analysis (PRISMA) statement guidelines [13]. Eligibility criteria are described in Table 1.
Table 1. PICOS (Participants, interventions, comparisons, outcomes, study design) PICOS
component
Details
Participants (P) Adults aged 19-64 years with no eating disorders, no medication, non-smokers or light smokers and a body mass index ≥ 18 kg/m2
Interventions (I) Overfeeding intervention (≥ 2 days) including at least one physical activity or sedentary parameter measurement
Comparisons (C) Pre and post-overfeeding intervention
Outcomes (O) Overfeeding, overeating, overnutrition, overnourishment, excessive eating, binge eating, physical activity, exercise, sports, sedentariness, physical inactivity
Study design (S) Randomized control trials, randomized controlled trials and non-randomized non- controlled trials, prospective and observation
A search was conducted with no publication date or status restrictions. Studies were identified by searching 8 electronic databases: Medline (1966-present), Embase (1980-Present), CINAHL (1937-present), Scopus (1970-present), Web of Science (1980-present), CAB Abstracts (1973-present), PsycInfo (1806-present), and Cochrane controlled trials (1898-present). A filter was applied for publications in the English language only. The last search was conducted on July 12, 2017.
The following key words and operators were used (search strategy: CAB Abstracts): 1. exp overfeeding
2. exp overeating
3. Overfeeding or over feeding, overeating or over eating, overnutrition or over nutrition, or overnourished or over nourished or excessive eating. (ab, ti)
4. 1 or 2 or 3
5. exp physical activity 6. exp sport
7. Physical activity, or exercise, or sport, or sedentary or sedentariness, or physical inactivity (ab, ti)
8. 5 or 6 or 7 9. 4 and 8
Table 2. Keywords included in the database search strategy Eating type Activity level
Overfeeding Physical activity Overeating Exercise
Overnutrition Sports Overnourished Sedentary Excessive eating Sedentariness Binge eating Physical inactivity Overfeeding
Titles and abstracts of studies were independently screened by two authors (VG, SS) to determine a first selection of relevant papers. Studies had to meet the following criteria: 1) adult subjects only; 2) presence of an overfeeding protocol; and 3) physical activity, energy expenditure or sedentary level measurements. Disagreements between reviewers were resolved by consensus. Next, a detailed analysis of the papers by one reviewer (VG) led to
17
their inclusion in this review. Studies with no data available relating to overfeeding were excluded. Studies with results only presented in a meeting abstract form were also excluded. Only studies reporting unrestricted physical activity were included, while studies reporting restricted physical activity were excluded (e.g., step count ≤ 4,000 steps/day [14] or structured 30 min of bicycle per day). Studies were excluded on basis of eligibility criteria if there was a weakness in the use of PA tools (e.g., use of indirect calorimetry, but only for the resting metabolic rate) or a weakness in the overnutrition protocol (e.g., protocol duration for one day or ad libitum energy intake protocol).
Data collection was performed by one reviewer. There was no need to contact any authors for additional information.
Table 3. Definition of terms for overfeeding, physical activity and sedentariness
Term Definition of variables
Overfeeding Energy intake exceeding total energy expenditure over a given period of time Physical
activity
Any bodily movement produced by skeletal muscles that requires energy expenditure
Exercise Regular and structured subsets of physical activity, performed deliberately and with a specific purpose such as preparation for athletic competition or improvement of some aspect of health
Sedentary behavior
Sedentary behaviors are behaviors characterised by a seated or reclining posture and a low energy expenditure ≤ 1.5 MET during waking hours
Physical inactivity
Activity level insufficient to meet present recommendations
Risk of bias was assessed using the Cochrane Collaboration’s tool for assessing risk of bias for sequence generation, allocation concealment, blinding outcome assessors, incomplete
outcome data, selective outcome and other sources of bias [15]. Results are presented in an additional file (Additional File 1). Study selection inclusion was not influenced by the results of the risk of bias assessment. PA, energy expenditure and sedentary parameters were the outcomes of primary interest.
One author (VG) extracted the information into a spreadsheet that included the following: authors, date of publication, sample size, participant characteristics (age, sex, body mass index, body fat index, physical activity details, eating habits), setting, outcome measures (energy expenditure, physical activity parameters, sedentary parameters) and results. Results were converted into international units. Changes in energy expenditure were converted to percentages, if not initially provided.
19
Results
Figure 1 illustrates the systematic review flowchart following PRISMA guidelines [13]. The databases search yielded 7,739 articles, 2,934 of which were eliminated on the basis of their titles and abstracts alone. The full texts of 123 articles were subsequently retrieved, of which 15 articles gathering 14 trials met the inclusion criteria.
3.1 Testing protocol
The 14 trials retrieved from this sytematic review took place between 1985 and 2015. The size of the studies varied between 4 [17] and 32 [24, 28] participants and all studies were within-person comparisons over time. Five overfeeding studies used a specific amount of calories for all subjects [9, 16-19]. Other studies opted for a personalized diet based on baseline energy requirements [20-29], calculated with estimations or direct measurements of resting energy expenditure, diet induced-thermogenesis and activity energy expenditure (see table 4). There were variations in overfeeding duration ranging from 2 days [29] to 65 [20, 25] days. Regarding PA guidelines, 6 studies reported instructions of unrestricted PA [16-19, 24, 28], 5 studies asked their participants to avoid any specific PA [9, 20, 23, 27, 29], while the remaining 4 didn’t give any instructions concerning the practice of PA at all [21, 22, 25, 26]. Seven studies used accelerometers [16, 18, 20, 23-25, 27] six studies used doubly labeled water [9, 16, 17,19, 20, 26] four studies used a room calorimeter [21, 22, 27, 29] and radar sensor [20, 23, 27, 29], three studies used a pedometer [24, 27, 28] and one study used a survey [25]. Finally, eight studies were in a free-living setting [9, 16, 19, 24-28] and seven were in a laboratory setting [20-23, 17, 27, 29].
Table 4. Studies assessing sedentary, energy expenditure or PA parameters with an overfeeding protocol
Referen ce (year) Study design (N, RCT/ nRCT ) Participants characteristi cs (Age range, sex, body mass index) Overfeeding protocol Setting Physical activity indication
Tools and indicators
Results
Pre Post Change
Apolzan et al. (2014) [20] 25, RCT -18-35 yr -16 men, 9 women -19.0-30.0 kg/m2 1.4x baseline energy requirement* for 65 days 3 groups: - low protein diet (5%) - normal protein diet (15%) - high-protein diet (25%) *Based on 24-h of metabolic chamber direct measurements Laboratory Participants resided on the inpatient unit for the entire study
Exercise prohibited
Doubly labeled water • Total daily energy
expenditure for 9 days (week 7 -8)
• Activity-related energy expenditure, calculated with sleeping metabolic rate and thermic effect of food (metabolic chamber) (kJ/day) n/a 417 ± 81 n/a 623± 159 • Not significant • ↑↑↑↑50% Accelerometer • Vector magnitude (counts) • Activity energy expenditure (kJ/day) RT3 accelerometer at the waist 102.6 ±7.97 281.0 ±29 132.6 ±8.45 337.2 ± 26 • ↑↑↑↑30% • ↑↑↑↑20%
Radar sensor
• Physical activity level
• Spontaneous physical activity (kJ/day)
• Activity (% of active time/24h)
On day 1, 14 and 56 of the study 1.47 ±0.06 180 ±21 15.4 ±0.9 1.56 ±0.10 n/a n/a • ↑↑↑↑6% • Not significant • Not significant Bray et al. (2015) [21] 25, RCT -18-35 y -men and women -19.7-29.6 kg/m2 1.4x baseline energy requirement for 56 days 3 groups: - low protein diet (5%) - normal protein diet (15%) - high-protein diet (25%) *Based on Laboratory Participants resided in the Pennington Biomedical Research Center. Room calorimeter on week 8. No indication Room calorimeter • Total daily energy
expenditure (kJ/day) 1993 ±371 2137 ±402 • ↑↑↑↑8 %
23 energy expenditure measured by doubly labeled water Dirlewa nger et al. (2000) [22] 10, RCT -20-26 y -women -19.3-25.3 kg/m2 1.4x of baseline energy requirement* for 6 days 1 group, 2 overfeeding diets : - hyperenergeti c diet providing 40% excess energy as carbohydrates - hyperenergeti c diet providing 40% excess energy as fat * Based on Laboratory Room calorimeter on day 3 No indication Room calorimeter • Total daily energy
expenditure
resting energy expenditure measured by 45 to 60 minutes of indirect calorimetry x 1.3 He et al. (2012) [23] 21, RCT -42 y -men and women - 33.2 kg/m2 1.5x weight maintenance* diet for 3 days 1 group
* Specific to the inpatient unit and calculated based on body weight and sexe Laboratory Participants were admitted to the Clinical Research Unit of the National Institute of Diabetes and Digestive and Kidney Diseases Free walk allowed but exercise prohibited Accelerometer • Sedentary time (%) • Non-exercice activity (counts/min)
Actical monitor worn at the waist, wrist and ankle
70.9 ±12.9 93.9 ±21.5 72.0 ±7.4 68 ±18.4 • Not significant • Not significant Radar sensor • Spontaneous physical activity (% of active time/24h) 5.6 ± n/a 5.0 ±n/a • Not significant
25 et al. (2005) [16] nRCT -women -18.8-24.4 kg/m2
energy than the baseline energy requirement* for 14 days 1 group * Calculated from basal metabolic rate measured with indirect calorimetry and PA level measured with accelerometry ed • Physical activity indicator (Mcounts/day) Tracmor worn at the waist
6666 ±1286 7177 ±1645 • Not significant
Doubly labeled water
• Total energy expenditure (kcal) 10.18 ±0.68 10.58 ±1.00 • Not significant Klein and Goran (1993) [17] 4, nRCT -24-35 y -men -21.8-23.4 kg/m2 +6904 kJ/day* for 8 days 1 group * Baseline indirect calorimetry measurements Laboratory Participants were free to move around within the clinical Unrestrict ed
Doubly labeled water • Total daily energy
expenditure (kJ/day) • Non-resting energy
expenditure, calculated with resting metabolic rate (indirect calorimetry) (kJ/day) 2 384 ±219 855 ±190 2 808 ± 291 1 171 ± 262 • ↑18% • ↑42%
research center during the study with an access to a stationary bicycle ergometer. Levine et al. (2008) [18] 22, nRCT -31-47 y -12 women and 10 men -19.0-38.0 kg/m2 +4184 kJ/day above weight maintenance* diet for 56 days 1 group
* Baseline period of 3 weeks during which the dietary intake provided was adjusted to maintain body weight gain
Free living Unrestrict ed
Accelerometer
• Walking bouts (n/day) • Time engaged in walking
(min/day)
• Average distance of a walking bout (miles) • Free-living velocity (mph) PAMS system: 2 accelerometers (CXL02LF3-R, Crossbow technology) and 4 inclinometers 47 ± 6 389 ±106 0.18 ±0.06 1.14 ±0.20 47 ±10 391 ±116 0.15 ±0.06 1.02 ±0.20 • ↓1% • ↓1% • ↓ 21% • ↓ 12% Average of lean and obese group
27
(CXTA02, Crossbow Technology) on the trunk Levine et al. (1999) [9] 16, nRCT -25-36 y -12 men and 4 women +4184 kJ/day* for 56 days 1 group * Based on doubly labeled water measurements
Free living Exercise prohibited
Doubly labeled water • Total daily energy
expenditure (kcal/day) • Nonexercise
activity-thermogenesis, calculated with basal metabolic rate and postprandial thermogenesis (indirect calorimetry) (kcal/day) 2807 ±n/a 896 ±n/a 3361 ± n/a 1 235 ± n/a • ↑12% • ↑38% Muller et al. (2015) [24] 32, nRCT -20-37 y -men -20.7-29.3 kg/m2 1.5x baseline energy requirement* for 7 days 1 group *Based on a dietitian-guided dietary record, resting metabolic
Free living Unrestrict ed Accelerometer • Activity energy expenditure (Kcal/d) 555 ±328 580 ±304 • Not significant Pedometer • Steps/day 4785 ±1417 4865 ±1896 • Not significant
rate with indirect calorimetry and PA with the use of 24 hours heart rate and accelerometry Pasquet et al. (1992) [25] 9, nRCT -20-37 y -men -18.3-23.1 kg/m2 125 ± 46.6 % of baseline habitual intakes* for 61-65 days 1 group * Based on total energy expenditure measured with doubly labeled water Free living No indication Survey
• Spontaneous activity n/a n/a • ↓ 59 %
Accelerometer • PA indicator At the wrist 4 145 ±1371 2 440 ±816 • ↓ 40 % arm movement counts/24H Siervo et al. (2008) [26] 6, nRCT -32-58 y -men -18.8-24.1 kg/m2 1.6x baseline energy intake* for 21 days 1 group Free living Participants were free to move No indication
Doubly labeled water
• Total energy expenditure 11.1 ±0.7 12.9 ±0.8 ↑ ↑↑ ↑ 16%
29 * Baseline period
of 3 weeks during which the dietary intake provided was adjusted to maintain body weight gain around the Cambridge area Ravussin et al. (1985) [27] 5, nRCT -22-27 y -men -19.0-23.9 kg/m2 1.6x baseline energy requirement* for 9 days 1 group *Based on EE within a metabolic chamber plus an estimated 25% for PA Free living and laboratory Room calorimeter on day 1 and 9of the study (5m long x 2,5 m wide) Exercise prohibited Room calorimeter
• Daily energy expenditure (kJ/day) 9.75 ±0.42 10.42 ±0.58 11.79 ± 0.05 • ↑↑↑↑ 7% on the 2nd day • ↑ 21% on the 9th day Pedometer
• Steps/day n/a n/a • Not
significant Accelerometer • Activity index 0.03 ±0.00 0.03 ±0.00 • Not significant Radar sensor
• Spontaneous PA (%) 0.03 ±0.00 0.03 ±0.00 • Not significant Roberts et al. (1990) [19] 7, nRCT -23-24 y -men -22.7-25.3 kg/m2 + 4 200 kJ/day* for 21 days One group Based on direct measurments of total energy expenditure components
Free living Unrestrict ed
Doubly labeled water • Total daily energy
expenditure (kJ/day) 13 883 ± 774 14 665 ±678 • Not significant Schmidt et al. (2012) [28] 32, RCT -25-35 y -men and women -16.9-25.5 kg/m2 1.4x baseline energy requirement* for 3 days 2 groups : - obesity prone individuals - obesity resitant individuals * Based on calorimetry energy
Free living Unrestrict ed
Pedometer
• Steps/day n/a n/a • ↓ (data not
available) For both groups
31
N.B.: values presented are mean ± standard deviation. PA: physical activity expenditure measurments Weyer et al. (2001) [29] 6, RCT -21-33 y -men -19.5-25.5 kg/m2 200% baseline energy requirement* for 2 days 1 group, 2 diets : - ad libitum diet - overfeeding * Based on a 24h in a respiratory chamber after 3 weeks of weight maintenance diet Laboratory Room calorimeter Exercise prohibited Room calorimeter
• Daily energy expenditure n/a n/a • ↑↑↑↑ 9% Radar sensor
• PA energy expenditure (MJ/day)
n/a n/a • Not
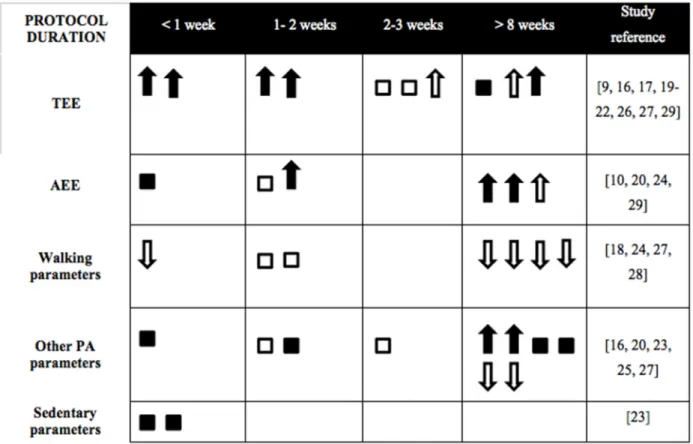
Figure 2. Effects of protocol duration on energy expenditure, physical activity and sedentary parameters in a free living or a laboratory setting
3.4 Room calorimeter
Concerning room calorimeter, Ravussin [27] showed a daily total energy expenditure (TEE) increase of 7% on the second day and 21% on the last day of a 9-day overfeeding protocol at 160% of maintenance requirements. Other studies have also reported increases in daily TEE of
33
9% at 2 days using 200% of energy requirement [29]; of 8% at 56 days using 140% individual baseline energy requirement [21]; and of 7% at 6 days using 130% of resting energy expenditure [22]. Measurements were made continuously for 22.5h [27], 23h [22] and 24h [21, 29]. Participants were either not allowed to practice vigorous PA [27] and/or exercise [21], or had simply no indication in term of PA [22, 29]. Radar sensors were once added to the room calorimeter, but PA measurements were not used to estimate total energy expenditure [29].
3.5 Doubly labeled water
Three studies using doubly labeled water revealed an increase in energy expenditure: 18% with an 8-day overfeeding protocol using +6,941 kJ/day [17]; 16% with a 21 days overfeeding protocol using 1.6x baseline energy requirement [26]; the other at 12% with a 56-day overfeeding protocol using +4,184 kJ/day [9]. Other studies showed no significant results with a 56-day overfeeding protocol using 140% of individual baseline energy requirement [20]; 21 days using +4,230 kJ/day [19] and 21 days at +4230 kJ/day [16]. Activity-related energy expenditure has been reported by three studies with an increase of 38% [9], 42% [17] and 50% [20].
3.6 Accelerometer
Using a short duration protocol (7 days overfeeding protocol at 150% energy needs), an increase of 30% in vector magnitude and 20% in activity energy expenditure (AEE) was measured by Apolzan [20]. In longer protocols, activity (arm movement count/24H) showed a 40% decrease at 61-65 days at 125% of baseline habitual intake [25]. In addition, Levine [18] showed decreases of 1% in walking bouts and time engaged in walking, of 12% in free living velocity, and of 21% in average distance of a walking bout (miles) after 56 days of 4184 kJ/day above weight maintenance feeding. Other results have not been significant: activity
AEE at 7 days with 150% of energy needs [24]; sedentary time and non-exercise activity at 3 days at 150% of weight maintenance diet [23]; PA after 14 days at +4230 kcal/day [16]; and activity index at 9 days with 160% of maintenance requirements [27].
3.7 Pedometer
In a protocol of 3 days at 140% of estimated basal energy needs [28], overfeeding was associated with a significant decrease in the number of steps of participants with BMIs between 16.9 and 25.5 kg/m2 (data not presented). Other studies have shown no difference in step counts at 7 days at 150% of energy needs [24] and at 9 days at 160% of maintenance requirements [27].
3.8 Radar sensor
Radar motion detectors that continuously monitored the subject’s movement in the room calorimeter detected an increase in PA levels of 6% at 56 days at 140% individual baseline energy requirement [20]. These radar sensor measurements had no significant results on other PA parameters: activity [20]; spontaneous PA [20, 23, 27]; and physical activity energy expenditure [29].
3.9 Survey
The survey, consisting of a time-allocation survey done by local assistants who recorded activities, postures and pace minute by minute for 24 hours, revealed a decrease of 59% in spontaneous activity using either 61-or 65-day overfeeding protocols at 125% energy requirement [25].
35
Discussion
The first aim of this review was to investigate the common tools measuring PA, energy expenditure and sedentary parameters in overfeeding studies. Ultimately, 15 papers assessed PA, energy expenditure or sedentariness with 1 tool (n=8) or a combination of 2 to 4 different tools (n=7) using room calorimeter, doubly labeled water, accelerometer, pedometer, radar sensor and survey. The 20 parameters identified are diversified, which provided a wide range of results that can be interpreted following overfeeding but also challenging their comparison. The second aim of this review was to explore whether overfeeding modulate these parameters: PA parameters were maintained, increased and decreased and energy expenditure parameters were increased or maintained. Only one study assessed sedentary parameters and its result indicated a maintenance level.
This systematic review first aimed to determine any preferential use of tools or specific parameters in overfeeding studies. The pedometer was the first tool to be used in an overfeeding study in 1967 [30]. Then appeared the metabolic chamber in 1971 [31]. Decades later, Ravussin et al. [27] introduced the accelerometer and the radar sensor and at the same time, a combination of tools for a single study. Finally, the last tool that emerged was the doubly labeled water in 1990 [19]. In this systematic review, these findings show that the accelerometer is the most common tool (n = 7), followed by doubly labeled water (n = 6). However, room calorimeter (n = 4), radar sensor (n = 4), pedometer (n = 3) and survey (n = 1) are less common. A combination of tools was used in 7 studies without any similarities among them.
In terms of parameters, this review identified 20 of them and what emerged was that there was no consensus on preferential parameters. Some tools allowed only one parameter, such as TEE (MJ/day) for the room calorimeter, as well as number of steps for the pedometer. The most popular parameter of doubly labeled water is daily energy expenditure [9, 16, 17, 19, 20, 26], while activity-related energy expenditure or its equivalent is also reported three times [9, 17, 20]. There was only one study that presented parameters of both physical activity and sedentary parameters [23], despite the fact that sedentariness and physical inactivity are two distinct concepts and that both contribute independently to excess body weight gain [32]. In a study conducted by Knudsen [33], inactivity and overfeeding have led to insulin sensitivity impairment. Furthermore, a high amount of sedentariness had an impact on morbidity regardless of PA level [34-36]. However, most of the negative effects of a short-term overfeeding combined with a daily-reduced number of steps are counteracted by physical exercise [14]. Therefore, by not considering PA, exercise, sedentariness and physical inactivity at the same time, there was a lack in the complete interpretation of what was happening in a positive energy balance in adult studies.
The second aim of this review was to explore changes in PA, energy expenditure and sedentary parameters following an overfeeding period. Our results indicated that there might be some changes in PA and energy expenditure parameters while sedentary parameters appeared to be maintained. For PA and energy expenditure parameters, changes were not significant (n = 13), increasing (n = 15) or decreasing (n = 7) with overfeeding, considering that each study could have more than one parameter. The study that appears to have had the greatest impact on PA parameters is that of Alpozan et al. [20] with an increase of 50% in
37
activity-related energy expenditure and Pasquet et al., [25] which showed decreases of about 60% in spontaneous physical activity and 40% in physical activity indicator (counts/day). Other decreases in PA parameters were related to walking characteristics and varied between 1% and 21% [18]. The decreases involved a greater change in the distance traveled (-21%) compared to the daily walking time (-1%), suggesting a less efficient walk and a modulation of energy efficiency. This joins the theory that overfeeding produces change in NEAT [9]. These results also show the importance of evaluating changes in a free living setting.
Increases energy expenditure parameters ranged from 6% to 60% and most were related to the measurement of daily energy expenditure. This wide difference in energy expenditure results could be explained by guidelines given to participants about their PA practice and the space in which the participant could move (Table 4). Interestingly, these increases were observed both in a free living context [9, 20, 26, 27] and when the study was conducted in an inpatient unit [17, 21, 22, 27, 29]. For sedentary behaviors, only one study used this parameter and its changes were not significant [23] just like PA in this study. Other researchers highlight that the duration of protocol and amount of overfeeding are two major factors that produced changes in these parameters [37, 38]. A review conducted by Westerterp [39] using doubly-labelled water found that there was no effect on PA level when overfeeding was lower than twice the maintenance requirements, a finding however in contradiction with some of the study used in the current review [20, 26].
Interesting elements emerge when results were compared according to duration of the overfeeding protocol (Figure 2). Durations of overfeeding varied greatly between different
studies. As mentioned by Joosen and Westerterp [37], the overfeeding period should be long enough to expect an increase in excess body weight. We suggest that it can be the same with changes in PA and sedentary parameters. In fact, it seems that there were more changes when protocol duration exceeded 8 weeks, even if this impact can also be due to a greater number of
free living settings with long overfeeding protocols.
In fact, short-duration studies (< 1 week) are mostly done in laboratory. Figure 2 illustrates that TEE was either non-significant or increased with overfeeding. This increase in TEE seemed not to be caused solely by an increase in AEE but was rather multifactorial and possibly linked to the NEAT theory described previously. In fact, three studies performed assessment of both TEE and PA parameters [20, 27, 29]: they all indicated an increase in TEE while PA was maintained or increased (6 to 30%). Walking parameters were maintained and decreased with overfeeding, while other PA parameters were more divergent. For this parameter, a BMI ≥ 30 kg/m2 could lead to less pronounced changes, as it was found in the Schmidt et al. [28] overfeeding study comparing obesity prone and obesity resistant individuals. Interestingly, Levine and his colleagues carried out the same protocol of overfeeding (time, duration and setting) in 1999 and 2008, except that in the first study, the exercise was prohibited and in the second, physical activity was unrestricted [9, 18]. Again, a mechanism for dissipating excess energy consumption seems to exist, since there was an increase in TEE in the first one and a decrease in walking parameters in the second. These latter results agree with the NEAT theory, but measurements with an accelerometer were therefore incomplete as the non-volitional part could only be verified by radar sensors for a better understanding of its mechanisms.
39
According to Figure 2, contradictions occur between increase in TEE and the other parameters. In the case of Apolzan et al. [20], there was no modification in total daily energy expenditure, but an increase in vector magnitude, AEE and physical activity while exercise was prohibited. Pasquet et al. [25], on the contrary, observed an increase in daily energy expenditure, but no significant results for any PA results assessed by pedometer, accelerometer and radar sensors. TEE's ability to influence weight gain depends on the increase or decrease in PA and sedentary parameters and hence supports the importance of having precise and complementary parameters. Therefore, this table points out the need to further explore sedentary parameters in long-term overfeeding studies. This is even more important since there was a favorable association between breaks in sedentary time, triglycerides [40] and waist circumference [41], two biomarkers clustered into a metabolic risk.
Studies included in this review did not all agree on the same aims. Some focused on energy expenditure [16, 19, 21, 22, 25-27], or on PA [18, 20, 23, 28] and among these, one study also aimed to measure sedentariness results [23]. Other studies had other aims such as to identify changes in metabolism [17, 29], thermogenic responses [9, 25], basal metabolic rate [29] and leptin levels [22]. These differences among studies could have an impact on the outcomes, which need to be examined.
The different purposes of each paper can explain the variability in the choice of tools and parameters. Kelly et al., [42] pointed out that there is no ‘gold standard’ in terms of tool choice for PA and sedentary measurements: it all depends on the PA or sedentariness aspect of
interest. While the goal of each study differed, it was unexpected to see a consensus regarding the use of a single tool. Nevertheless, questionnaires have limited reliability and validity when they are not for 1) indicating conditions where an increase in PA would be beneficial and 2) monitoring changes in population activity [43]. In fact, self-reporting of PA were overestimated compared to direct measurement tools such as doubly labeled water and accelerometry [44]. This potentially explains why only one study used a survey. If we consider overfeeding studies for the purpose of preventing obesity, then the room calorimeter, which allows the assessment of different components of TEE and thereby, energy substrate utilization, appears to be the tool of choice, as emphasized by Lam and Ravussin [45]. Conversely, if we want to understand why predictive models of weight loss or gain are inaccurate, then measurements of these parameters under free-living conditions could be more accurate. To do so, doubly labeled water and accelerometry are two devices of choice. Furthermore, interest on the combination of tools seems to be emerging [46]. Seven studies in this review used more than one tool for the overfeeding part of the protocol. However, these additions did not necessarily result in improvements in estimating EE [47] but did improve the accuracy of meaningful PA outcomes such as METs/hour and time spent in moderate to vigorous PA [46]. This combination is now important to consider since Pontzer et al., [48] found that compensatory mechanisms that modulate energy expenditure occur with high intensity. In fact, above moderate activity levels, total energy expenditure plateaued.
The current review highlights a wide diversity in participant characteristics subjected to overfeeding protocols. It is now commonly known that confounding factors for energy expenditure include both participant aspects such as age [49], sex [50], genetic [51] and
41
dietary nutriments such as food composition [38, 52, 53] and the type of fat in the diet [54]. With a homogeneous age group of adults, this review did not allow us to observe a difference for this confounding factor. Regarding sex, some articles in this review included only men [17, 19, 24-26, 29], others only women [16, 22], and some of them both [9, 18, 20, 21, 23, 28]. There is insufficient information for interpretation when controlling for energy expenditure and sex in this review, considering that there was only one study examining females and energy expenditure parameters. Finally, unconventional dietary nutriments were performed by Bray et al. [21] with a protein overfeeding and Dirlewanger et al. [22] with a carbohydrate and a fat overfeeding. With the increase of food intake, TEE increase through the processing of ingested food [55]. Protein overfeeding may increase even more TEE by increasing postprandial thermogenesis, which implies a significant bias on the results [55]. A brief period of high fat overfeeding impairs glycemic control [57] as well as carbohydrate overfeeding [53]. These changes in glucose blood concentration interfere with hormonal regulation and lead to fat production and accumulation [53]. Furthermore, some hormones increase TEE, such as leptin [58] which is increased following overfeeding [59].
Limitations
The main limitation in this systematic review concerns the unreported or estimated PA measurements, potentially leading to overestimation of PA measurements. In addition, this makes the comparisons between studies more complex. Furthermore, the PA guidelines the volunteers had during the overfeeding studies which varied from one study to another might have influenced energy expenditure results. Food intake was assessed in both laboratory conditions and free-living conditions. The first is known to be a rigorous method of assessing energy intake and the other may lead to underreporting and biased results [60]. According to
Westerterp [38], the ideal measure of energy expenditure in overfeeding studies may be in non-restrictive conditions and with an increase in caloric ingestion for at least one week. In this case, 60% of studies included in this review were performed in free-living conditions and 66% respected a duration of more than one week. There is clearly a lot more work to be done to elucidate the effects of overfeeding on PA, energy expenditure and sedentariness, starting with direct measurments of these three components in a single study. In fact, no study to date has investigated them altogether.
Conclusions
The investigation of PA, energy expenditure and sedentary measurements in an overfeeding context shows the use of various tools as well as a technological advance putting forward their uses in laboratory but also in free-living context. This systematic review draws a good picture of the literature, as it is performed in eight databases and followed the PRISMA guidelines. Adaptations, both increase and decrease, seemed to occur in PA parameters following overfeeding. This might have been influenced by duration of the overfeeding protocols. An interesting consideration may be an “overfeeding % x duration protocol” factor for a global view of the overfeeding protocol. Unfortunately, 5 studies included in this review gave a specific amount of energy intake in excess instead of an overfeeding percentage, thus making it impossible to compare its effects on energy expenditure, PA and sedentary parameters. As there are a relatively small number of heterogeneous studies included in this review (N = 15), these results should be interpreted with caution. Thus, the development of the full potential of certain tools such as the accelerometer must be achieved. There was only one study that specifically assessed sedentariness. A logical next step for future trials would thus be to include sedentary parameters more frequently.
![Figure 1 illustrates the systematic review flowchart following PRISMA guidelines [13]](https://thumb-eu.123doks.com/thumbv2/123doknet/8299758.279649/29.918.118.730.324.939/figure-illustrates-systematic-review-flowchart-following-prisma-guidelines.webp)