HAL Id: hal-00321663
https://hal.archives-ouvertes.fr/hal-00321663
Submitted on 15 Sep 2008
HAL is a multi-disciplinary open access
archive for the deposit and dissemination of
sci-entific research documents, whether they are
pub-lished or not. The documents may come from
teaching and research institutions in France or
abroad, or from public or private research centers.
L’archive ouverte pluridisciplinaire HAL, est
destinée au dépôt et à la diffusion de documents
scientifiques de niveau recherche, publiés ou non,
émanant des établissements d’enseignement et de
recherche français ou étrangers, des laboratoires
publics ou privés.
Impact of the subjective dataset on the performance of
image quality metrics
Sylvain Tourancheau, Florent Autrusseau, Parvez Sazzad, Yuukou Horita
To cite this version:
Sylvain Tourancheau, Florent Autrusseau, Parvez Sazzad, Yuukou Horita. Impact of the subjective
dataset on the performance of image quality metrics. IEEE International Conference on Image
Pro-cessing 2008. ICIP 2008., Oct 2008, San Diego, CA, United States. �hal-00321663�
IMPACT OF SUBJECTIVE DATASET
ON THE PERFORMANCE OF IMAGE QUALITY METRICS
Sylvain Tourancheau
1, Florent Autrusseau
1, Z.M. Parvez Sazzad
2and Yuukou Horita
21
Laboratoire IRCCyN, Université de Nantes
2Graduate School of Engineering, Univ. of Toyama
Rue Christian Pauc, 44306 Nantes, France
3190 Gofuku, Toyama, 930-8555 Japan
sylvain.tourancheau@univ-nantes.fr
parvezdu@ctg.u-toyama.ac.jp
florent.autrusseau@univ-nantes.fr
horita@eng.u-toyama.ac.jp
ABSTRACT
The interest in objective quality assessment have significantly increased over the past decades. Several objective quality metrics have been proposed and made publicly available, more-over, several subjective quality assessment databases are dis-tributed in order to evaluate and compare the metrics. How-ever, several question arises: are the objective metrics be-haviours constant across databases, contents and distortions? how significantly the subjective scores might fluctuate on dif-ferent displays (i.e. CRT or LCD)? which objective quality metric might best evaluate a given distortion? In this arti-cle, we analyse the behaviour of four objective quality met-rics (including PSNR) tested on three image databases. We demonstrate that the performances of the quality metrics can strongly fluctuate depending on the database used for testing. We also show the consistency of all metrics for two distinct displays.
Index Terms— Image quality, Quality assessment, Sub-jective database
1. INTRODUCTION
As subjective experiments are extremely tedious and time con-suming, objective quality metrics have lastly been extensively studied, and their performances have significantly improved over the decades. Whereas the aim of an objective metric is to substitute to tedious subjective experiments, while designing a metric, it is mandatory to compare the objective scores with the subjective ones, and to use statistical tools to accurately evaluate the objective quality assessment. Objective quality metrics may be used for various purposes, but they are usually designed and utilized within image and video compression context. However, the interest in objective quality metrics for other image and video processing applications (such as digital watermarking) has also recently increased. Evidently, the per-formances of objective metrics stongly rely on the tested dis-tortion. For instance, the quality range of distortions induced
The authors would like to thank Romuald Pépion for his assistance to obtain the results described in the paper.
by watermarking techniques will be very narrow compared to the quality range of compressed data. This study is motivated by the need to faithfully analyse the metrics performances, and to demonstrate that, to be relevant, such analysis has to be conducted on a wide set of distortions and contents. It is thus strongly recommended to compare the metrics to sev-eral of the publicly available databases. One of the question we hereby address here, is the monotonicity of the metrics performances for various subjective databases. Four metrics were tested, a statistical metric (PSNR), one advanced metric exploiting Human Visual System features (C4), one based on an information-theoretic framework (VIF) and one based on structural similarities (SSIM). Three subjective databases are used, linear correlation and root mean squared error are used to assess the metrics. Strong variations among the four tested metrics within, and across the databases are observed. This may be explain by a somewhat important disparity among the databases. Besides, we also propose here a subjective study pointing out the important similarities between subjec-tive quality assessment on both CRT and LCD monitors, since two subjective experiments, on the same dataset, were con-ducted independently on both displays. The analysis of both experiments will show the very weak variations of subjective data, which moreover can easily be induced by cultural fac-tors and lab effects, rather than by the displays themselves. Similarly, a comparison is performed between the release 2 of the LIVE database and an update after a raw scores realign-ment processing. and shows minor difference behaviour for certain metrics. This paper is organized as follows: Section 2 describes the experiments conducted to construct our datasets, the performances of the quality metrics on each dataset are computed in Section 3 and results are discussed in Section 4. 2. DESCRIPTION OF THE SUBJECTIVE DATASETS 2.1. IRCCyN/IVC database
The IRCCyN/IVC subjective database [1] consists in 10 orig-inal colour images with a resolution of 512×512 pixels from which 235 distorted images have been generated, using 4
dif-ferent process (JPEG, JPEG2000, LAR coding, Blurring). These algorithms have the advantage to generate very different type of distortions. Each distortion type have been optimized in order to uniformly cover the whole range of quality.
Subjective evaluations have been performed in a normal-ized room with lighting conditions and display settings ad-justed according to ITU recommendation BT.500-11. The viewing distance was set to six times the picture’s height. Fif-teen observers participated to the experiments, they have been checked for visual acuity and color blindness.
A double stimulus impairment scale (DSIS) method have been used. Both distorted and original pictures were dis-played sequentially. At the end of the presentation, the ob-server was asked to assess the annoyance he/she felt on the distorted image with respect to the original one. The impair-ment scale contained five categories marked with adjectives and numbers as follows: 5 – Imperceptible, 4 – Perceptible but not annoying, 3 – Slightly annoying, 2 – Annoying and 1 – Very annoying. Mean opinion score was then computed over the observers after the potentiel rejection of observers according to recommendations.
2.2. Toyama database
The Toyama subjective database [2] contains 182 images of 768×512 pixels. Out of all, 14 were original images (24 bit/pixel RGB) in each group. The rest of the images were JPEG and JPEG2000 coded images (i.e. 84 compressed im-ages for each type of distortion). Six quality scales and six compression ratios were respectively selected for the JPEG and JPEG2000 encoders. The following codec softwares were used to generate the compressed images: JPEG using cjpeg software , and JPEG2000 with JasPer software .
Subjective experiments were conducted in a normalized room with low lighting conditions and display settings ad-justed according to ITU-R BT.500.11. The viewing distance was set to four times the picture’s height. Prior to participat-ing the session all subjects were screened for normal visual acuity with or without glasses, normal color vision and famil-iarity with language. Sixteen non-expert subjects were shown the database; most of them were college students.
Single stimulus absolute category rating (SSACR) method was used in these subjective experiments. The subjects were asked to provide their perception of quality on a discrete qual-ity score that was divided into five and marked with the nu-merical value of adjectives: Bad (1), Poor (2), Fair (3), Good (4) and Excellent (5). Note that the numerical values attached to each category were only used for data analysis and were not shown to the subjects. At the end of each test presen-tation, observers provide a quality rating using the adjective scale. The test presentation order was randomized according to standard procedure and the raw scores were collected in a data file by the computer. As the original images has been assessed as well, scores was converted in difference scores
(DMOS) for each observer by computing the difference be-tween the score obtained by the original image and the one obtained by the distorted image. Difference mean opinion scores (DMOS) were then computed for each image, after the screening of post-experiment results (most subjects had no outliers) according to ITU-R Rec. 500-10.
The Toyama database has been assessed on a CRT display in the University of Toyama in Japan. In order to check if the display is of central importance in such an experiment, we decided to conduct the same subjective quality assessment in IRCCyN laboratory in France, using a liquid crystal display (LCD). However, design the same experiment in two differ-ent labs it’s a real challenge and the so-called “lab effect” can occur. Actually, even if set as similar as possible, the viewing conditions can differ from on testing room to another. Fur-thermore, using two different pools of observers can also lead to slight differences. Also, some cultural differences can ap-pear between France and Japan, in the way to assess quality. For example, the way that observers consider the adjectives on the quality scale can be different. By the way, these two distinct experiments permits to obtain two different subjective datasets from the same image database.
2.3. LIVE database
The LIVE database release 2 [3] contains 779 distorted im-ages with five distortions type: JPEG, JPEG2000, white noise, gaussian blur and bit errors in JPEG2000 bit stream. Subjec-tive quality scores have been published in form of difference scores in a quality range from 0 to 100. For more precisions concerning the experiments, please see Ref. [3]. Recent work [4] from LIVE laboratory have presented a new method to realigned subjective quality scores obtained from each ses-sion with each other. This realignment process used Z-scores transform in order to attenuate the inter-observers differences, following by a inverse transform to go back to the 0-100 qual-ity range. This inverse transform has been adapted for each session. Following this work, an update of the subjective quality scores has been published online. In this paper, we will work on both datasets (release 2 and update).
3. QUALITY METRICS
First of all, objective image and video quality metrics can be classified according to the availability of the distortion free image/video signal, which may be used as a reference to com-pare an original image or video signal against its distorted counterpart. Specifically, such metrics are usually of three kinds. Full Reference (FR) quality assessment metrics for which the exact original image is needed in order to assess the visual quality of any distorted version. Reduced Reference (RR) quality metrics, for which a reduced form of the orig-inal images is used. No reference (NR) metrics, where only
Fig. 1: Top line: Linear correlation coefficient between QM and subjective scores for the three databases. Bottom line: Root Mean Square Error between QM and subjective scores for the three databases.Results are computed on the whole databases (white bars) and independently on the JPEG and JPEG2000 subsets, gray and black bars respectively.
the distorted image is needed. Several quality metrics (QM) have been used on the five datasets described previously:
• Structural SIMilarity (SSIM) [5] is an objective metric for assessing perceptual image quality, working under the assumption that human visual perception is highly adapted for extracting structural information from a scene. Quality evaluation is thus based on the degradation of this structural information assuming that error visibil-ity should not be equated with loss of qualvisibil-ity as some distortions may be clearly visible but not so annoying. • C4 [6] is a metric based on the comparison between the
structural information extracted from the distorted and the original images. What makes this metric interesting is that it uses reduced references containing perceptual structural information and exploiting an implementa-tion of a rather elaborated model of the HVS.
• Visual Image Fidelity (VIF) [7] is a full reference qual-ity metric using the concept of information fidelqual-ity mea-surement. The VIF metric groups Natural Scene Statis-tics as well as HVS features and a model of the consid-ered distortion to quantify the loss of information. Two classic criteria have been chosen to evaluate the perfor-mance of QM on each database: the linear correlation coeffi-cient (Pearson’s correlation) and the root mean squared error
(RMSE). These two values have been computed after a non-linear regression on the results of the QM. This regression is performed to map the output of each QM to the quality range of the DMOS. This regression has been done for the whole databases, and also separately for the JPEG and JPEG2000 subsets in each database. The non-linear function used to compute the regression was a logistic function with three rameters, as described in Eq. 1. The values of the three pa-rameters are optimized in order to minimize the RMSE.
Qmapped=
a
1 + e−b(Q−c) (1)
Figure 1 presents the linear correlation coefficient (top line) and the RMSE (bottom line) for the three QM as well as for PSNR, on the five datasets. Vertical bars indicate the 95% confidence interval of each correlation values (computed af-ter a Fisher transformation in order to transpose into a normal distribution). This information permits to determine if two correlations are statistically distinguishable or not. In this fig-ure, results are doubled for the LIVE database (corresponding to release 2 and updated version) and for the Toyama database (corresponding to CRT and LCD dataset). Linear correlation between PSNR and JPEG subset of both Toyama subjective datasets was under 0.6.
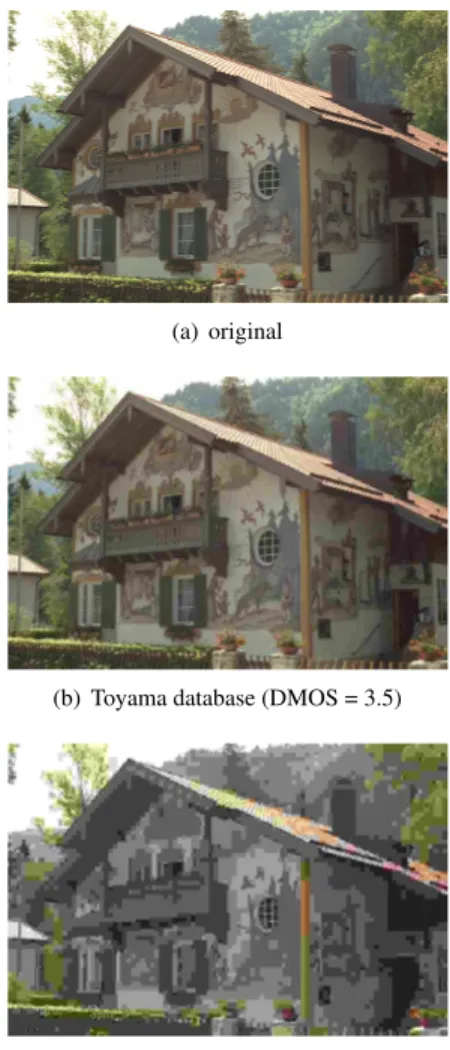
(a) original
(b) Toyama database (DMOS = 3.5)
(c) LIVE database (DMOS = 65)
Fig. 2: Illustration of the difference of low anchor between two databases. (b-c): lowest quality pictures for JPEG distor-tion respectively in Toyama and LIVE databases.
4. DISCUSSION
As expected, the performances of quality metrics show more or less the same tendency for the five subjective datasets. VIF and C4 appears to be the best QM, with some very close results as well for correlation (where 95% confidence inter-vals are highly overlapped) as for RMSE. SSIM obtains some lower results, particularly for IVC and Toyama databases and finally PSNR gets the lower results for all datasets. The dif-ferences over databases, particularly the decrease of perfor-mance on IVC and Toyama databases for all QM might be explained by the difference of quality range in the databases. As illutrated in Figure 2, low quality anchors in the LIVE database are indeed strongly distorted pictures with extremely low quality. The corresponding low anchors in Toyama and IVC databases appears to have a sensibly better quality. It is observed that quality metrics based on the statistics of images such as PSNR provide better results on the LIVE database
than on databases with a narrower range of quality such as IVC and Toyama. Actually, statistical metrics may be less accurate in the high quality range since quality perception in these area is mostly due to perceptual HVS features, rather than to the statistics of the image. The good performance of advanced quality metrics (VIF and C4), on all databases, seems to confirm this assumption.
The results showed that the type of display does not sig-nificantly interfere on the subjective scores. Actually, this was an expected behaviour since both subjective datasets on CRT (performed in the University of Toyama) and on LCD (per-formed in the IRCCyN lab.) were highly correlated (Pear-son’s correlation of 0.957) and quality metrics results on both datasets were, of course, the same. However, it is somewhat remarkable to have such close results on two different sub-jective datasets, despite the different displays, different labs and cultural effect. This is an evidence that subjective quality assessment experiments are quite reliable and that differences between databases are mostly due to difference of contents, distortions type and quality range.
We analyzed in this paper various quality metrics across subjective databases. We showed that, to be relevant, the per-formances evaluation of a quality metric has to be experi-mented on several databases. Evaluating a metric with one single subjective database might not be sufficient as the qual-ity range of the database seems to be of central importance. As a result, it is important to be aware of the differences be-tween subjective datasets, as well as to know what is the pro-file of the tested quality metric.
5. REFERENCES
[1] P. Le Callet and F. Autrusseau, “Subjective quality as-sessment IRCCyN/IVC database,” http://www.irccyn.ec-nantes.fr/ivcdb/, 2005.
[2] Y. Horita, Y. Kawayoke, and Z. M. Parvez Sazzad, “Im-age quality evaluation database,” ftp://guest@mict.eng.u-toyama.ac.jp/.
[3] H.R. Sheikh, Z. Wang, L. Cormack, and A.C. Bovik, “LIVE image quality assessment database release 2,” http://live.ece.utexas.edu/research/quality/.
[4] H.R. Sheikh, M.F. Sabir, and A.C. Bovik, “A statistical evaluation of recent full reference image quality assess-ment algorithms,” IEEE Transactions on Image Process-ing, vol. 15, no. 11, pp. 3440–3451, 2006.
[5] Z. Wang, A.C. Bovik, H.R. Sheikh, and E.P. Simoncelli, “Image quality assessment: From error visibility to struc-tural similarity,” IEEE Transactions on Image Process-ing, vol. 13, no. 4, pp. 600–612, 2004.
[6] M. Carnec, P. Le Callet, and D. Barba, “Objective quality assessment of color images based on a generic perceptual reduced reference,” Signal Processing: Image Communi-cation, vol. 23, no. 4, pp. 239–256, April 2008.
[7] H.R. Sheikh and A.C. Bovik, “Image information and visual quality,” IEEE Transactions on Image Processing, vol. 15, no. 2, pp. 430–444, May 2005.