HAL Id: hal-00463448
https://hal.archives-ouvertes.fr/hal-00463448
Submitted on 12 Mar 2010
HAL is a multi-disciplinary open access
archive for the deposit and dissemination of
sci-entific research documents, whether they are
pub-lished or not. The documents may come from
teaching and research institutions in France or
abroad, or from public or private research centers.
L’archive ouverte pluridisciplinaire HAL, est
destinée au dépôt et à la diffusion de documents
scientifiques de niveau recherche, publiés ou non,
émanant des établissements d’enseignement et de
recherche français ou étrangers, des laboratoires
publics ou privés.
The influence of autostereoscopic 3D displays on
subsequent task performance
Marcus Barkowsky, Patrick Le Callet
To cite this version:
Marcus Barkowsky, Patrick Le Callet. The influence of autostereoscopic 3D displays on subsequent
task performance. Stereoscopic Displays and Applications XXI, Jan 2010, San José, United States.
�hal-00463448�
The influence of autostereoscopic 3D displays on subsequent
task performance
Marcus Barkowsky, Patrick Le Callet
IRCCyN UMR 6597 CNRS, Polytech’ Nantes,
rue Christian Pauc, La Chantrerie 44306 Nantes, France
{Marcus.Barkowsky,Patrick.LeCallet}@univ-nantes.fr
ABSTRACT
Viewing 3D content on an autostereoscopic is an exciting experience. This is partly due to the fact that the 3D effect is seen without glasses. Nevertheless, it is an unnatural condition for the eyes as the depth effect is created by the disparity of the left and the right view on a flat screen instead of having a real object at the corresponding location. Thus, it may be more tiring to watch 3D than 2D. This question is investigated in this contribution by a subjective experiment. A search task experiment is conducted and the behavior of the participants is recorded with an eyetracker. Several indicators both for low level perception as well as for the task performance itself are evaluated. In addition two optometric tests are performed. A verification session with conventional 2D viewing is included. The results are discussed in detail and it can be concluded that the 3D viewing does not have a negative impact on the task performance used in the experiment.
Keywords: 3D television, autostereoscopic display, visual fatigue, eyetracking, task performance
1. INTRODUCTION
The introduction of 3D in applications, gaming, and television is a challenging project. While the new experience of depth excites the viewers at first, there are several technological drawbacks which need to be resolved. One such drawback is that the users have to wear glasses with most display systems. The most common systems use circularly or linearly polarized glasses or active shutter glasses. This drawback can be circumvented by the use of autostereoscopic displays which employ for example parallax barrier technology or lenticular arrays.
Another drawback is that after prolonged viewing, the users often experience visual discomfort. The typical symptoms are eyestrain, sore eyes, double vision, blurred vision, and headache.1
The reason for this illness is still under investigation. One aspect that is often mentioned is that on a 3D display, the eyes accomodate to the screen but the vergence may be different when looking at objects in front or behind the screen. This leads to an unnatural situation and requires a decoupling of the vergence and the accomodation response system. The viewer is able to fuse the images presented to the left and the right eye as long as the accomodation and vergence points do not exceed a certain limit which is known as Panum’s area. Several publications have analyzed this effect and its influence on the viewer.2
The measurement of the visual discomfort is often performed after the viewer has been exposed to 3D viewing. In most cases, the participants in a subjective experiment fill in a questionnaire.3
However, this method of analysis has two major drawbacks: The first being that the participants in a subjective experiment have to feel ill and the second drawback is that the obtained results are on a coarse and subjective scale.
It would be preferable to measure directly the visual fatigue which is the cause of the visual discomfort. A physiological measurement method that provides a reliable measurement of the degree of fatigue before reaching the threshold of discomfort would be optimal. Recently, an Electroencephalogram (EEG) and an Event-Related-Potential (ERP) based method was proposed to measure the visual fatigue.4
In this paper a different approach is proposed. After viewing 3D content on an autostereoscopic display, often a loss of concentration was experienced in a prestudy. The observed effect was an unconscious, unmotivated defocus, e.g. while reading a text on a computer screen or it was reported as loosing track of a workflow with a subsequent phase of disorientation.
In order to examine this effect, a subjective experiment method was created. The participants had to solve a set of 17 search task problems. By using an eyetracker, the way in which the participants solved the 17 tasks was recorded. Each participant answered four sets and the performance was compared before and after playing a game on an autostereoscopic display in 3D and 2D presentation mode.
The paper is organized as follows: In Sec. 2 the setup of the subjective experiment is explained. The analysis and the obtained results are detailed in Sec. 3. The results are discussed in Sec. 4 and the paper is concluded in Sec. 5.
2. SETUP OF THE SUBJECTIVE EXPERIMENT
The subjective experiment was performed in a room conforming to ITU-R BT.500 in order to guarantee that the subjects were not disturbed by the environment. Each observer participated in two session which were at least five days apart. In the first session, the observer’s performance was measured before and after 3D viewing. Because it can be expected that several effects contribute to a difference of the task performance of the observers, a second control session was done after one week which follows the same setup except that the participant’s performance was measured before and after conventional 2D viewing. A graphical overview is shown in Fig. 1.
Task performance Question set B Task performance Question set A Session 1: Session 2: Pause 20 min 5 min t 3D Excitation Pause 20 min 5 min t
Task performance Task performance Question set B 2D Excitation Question set A
Figure 1. Subjective experiment schedule
In the first session, each observer was first scanned for visual acuity, followed by a test of stereo vision using a standard Randot stereo test with polarized glasses. In the next part, data was collected from the participant for comparison before and after the excitation.
First, the phoria of each observer was measured for far vision and near vision using a Maddox rod test.5
In this optometric test, the eyes are decoupled by using a special red filter in front of one eye. The subject looks at a board with a strong light in the center. A coordinate system is printed on the board where each step corresponds to one degree of prism angle. When looking through the Maddox rod with one eye, the central light is perceived as a straight line which can be aligned in horizontal or vertical direction. As the coordinate system is still perceived with the other eye, the straight line may have an offset on the coordinate system corresponding to the phoria of the observer.
As a second optometric test, a fusional vergence facility test at near was conducted.5
The observer viewed a vertical line of letters at a comfortable reading distance of about 40cm. A prism of 12 diopters outwards was then introduced into the view of of one eye which led to double vision. The participant was asked to fuse the two lines again into one. As soon as he succeeded, he changed the prism to 3 diopters inwards and again fused the two appearing lines of characters. After a training phase, the number of full cycles was counted for one minute. Next, the task performance test was explained and conducted. An eyetracker was used to monitor the participants’ way of solving the task. A chinrest was used and the distance to the screen was adjusted to 40cm. The active screen area subtended 34 degrees of visual angle in horizontal direction.The eyetracker data was recorded at 50Hz. It is useful to compare pre- and post-performance of one observer. Besides the way the viewers solve the task, it allows to analyze for example the changes in the fixation time, the scanpath, and the curvature while he looks at different positions on the screen.
The task problem consists of identifying and counting a number of colored shapes with differently colored borders: Squares, triangles and diamonds. In total two sets of 17 task screens were prepared. The two sets are necessary because the participants did the task before and after the excitation. When using exactly the same questions, a memorization effect might have occured. In order to be able to still compare the results, only the
colors were permuted and the question was adapted. An example screen of one such task screen for each session is shown in Fig. 2. Prior to displaying the screen, the answer buttons were randomly permuted. None of the observers reported that he noticed the same question appearing twice.
As can be seen in Fig. 2, the participants started by reading an instructional text, then they should focus on the shape area and find the appropriate shapes. After they had counted the number of desired shapes, they focused on the answer area and picked one of a set of multiple-choice answers. The selection was done by gaze control: When a fixation was detected on one of the answers, the corresponding button was highlighted in three brightness steps and finally, the answer was accepted by the analysis program. This is an enhanced version of the dwell time selection algorithm.6
The advantage of using an eyetracker for voting was twofold: The participants did not have to use a different input device and thus could stay focused on the screen and the participants had to show that they were able to focus on a specific point on the screen for a long period of time, approximately one second. A feedback screen told the participant whether their selection was correct. If they failed, the question was scheduled for another try at the end.
(a) Trial screen 1 from question set A (b) Trial screen 1 from question set B
Figure 2. Example of corresponding question screens displayed at different task performance evaluations
After all 17 questions were answered correctly, the participants continued with the excitation part. A racing game, called Flat-Out, was played on an autostereoscopic 42-inch 3D display by Philips. The racing game contains a lot of motion in the foreground which is known to be particularly tiring for the participants.7
After the 3D presentation, a short pause of five minutes was introduced because it has been shown that the effects of visual fatigue may be more pronounced after a short pause.3
The same optometric tests were performed as before the excitation and the task experiment was repeated with a differently colored set of shapes.
3. ANALYSIS AND RESULTS
3.1 Optometric tests
The Maddox experiment revealed that the phoria for far vision did not change in a statistically significant way. In most cases, the change was below a reasonable threshold of 1 prism degree. The measurement for near vision showed a larger variance but the behaviour was considered to be random.
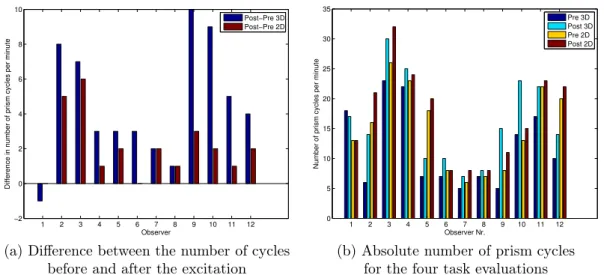
The prism facility test shows an indication that in general the number of cycles per minute increases after gaming. This can be seen in Fig. 3a. The figure also indicates that the effect is more pronounced for 3D viewing than for 2D viewing. Eleven out of the twelve observers get more cycles per degree after the excitation. In nine cases, the increase is larger for 3D than for 2D, in two cases they are equal. However, as Fig. 3b shows, the number of cycles varies significantly across observers and test sessions.
3.2 Task performance: Fixation and saccades
The task splits into three parts: Reading the text, performing the search task, and selecting the correct answer. With the help of the eyetracking data, a detailed analysis is possible. In Fig. 4 an example is displayed for one observer and one task. The Figure shows the saliency information overlayed on the task screen as seen by the subject. The experiment was done in French language. It can be seen that the position of the correct answer
1 2 3 4 5 6 7 8 9 10 11 12 −2 0 2 4 6 8 10 Observer
Difference in number of prism cycles per minute
Post−Pre 3D Post−Pre 2D 1 2 3 4 5 6 7 8 9 10 11 12 0 5 10 15 20 25 30 35 Observer Nr.
Number of prism cycles per minute
Pre 3D Post 3D Pre 2D Post 2D
(a) Difference between the number of cycles (b) Absolute number of prism cycles before and after the excitation for the four task evaluations
Figure 3. Result from the prism facility test for comparison before/after the excitation with 3D and 2D
Figure 4. Example of saliency map and scanpath of one observer and one task for the four sessions, pre/post 3D, pre/post 2D
is randomized. The gaze points that were recorded by the eyetracker are displayed in green. Additionally, a fixation and saccade analysis was performed using an acceleration detection method.8
The fixation points are displayed with larger green circles and the number of each fixation is printed as text. The saccades are depicted with dashed lines. The points are not connected when the eye could not be tracked, e.g. due to a blink.
Based on the eyetracking data, several indicators were considered for a change in the behaviour of the Human Visual System (HVS).
The length of the visual track indicates the efficiency of the exploration. This is measured by summing the distances between the fixations. The distance is measured in visual angle. A longer visual track indicates that parts were reread or that another fixation was necessary in order to understand the content.
The average duration of fixations gives a hint how long it took for the subject to process the information on which he focused. The time is measured in seconds.
The number of saccades provides the information at how many different points the subject had to look before understanding the text or the search task.
The angle of subsequent saccades is important in order to understand whether the search pattern is regular or chaotic. In reading the instructions, it can be expected that a line by line scan occurs. The angle between two saccades is either zero degree when reading on or 180 degrees when changing the line. Therefore, the difference of the angles were averaged by using the modulo of 180 degrees. In case of chaotic behavior the angle appears to be larger than for a regular pattern.
The ratio between fixation time and saccade time provides insight into the information processing of the HVS. It measures the relation between the time necessary to process the visual information and the time that was necessary to find it. A smaller value indicates a more effective search. Due to the limitation of the eyetracker frequency of 50Hz, the saccade time cannot be evaluated very precisely. Most measured saccades lasted less than 40ms, which corresponds to two samples.
The number of blinks may provide an indication of eye fatigue as it is known for the computer vision syn-drome.9
Thus, the average number of blinks per task is calculated.
For the analysis, the first five questions were excluded as they were considered as training. A screening of the twelve observers further revealed that two had to be discarded because the eyes were not correctly tracked. The remaining twelve questions of the ten observers were verified that they contained valid eyetracking data in at least 85% of the time and not more than 60% of loss occured within a second. Otherwise the corresponding data was discarded.
In Table 1 the results of the first four indicators is summarized for the text reading and the search task. The values indicate that the observers in general got more and more familiar with the task. For example, the length of the visual track decreased for both the text and the shape area. However, the individual results of each observer are less indicative as can be seen in Fig. 5. A monotonous decrease of the length of the visual track can only be observed for two observers in the text region and two observers in the shape region.
The average time of the fixations did not change in a significant way across the four test session. It can be noticed however, that the time is smaller for reading the text than for performing the search task.
The angle of subsequent saccades in the text area and thus the way in which the subjects read the text is lower after 3D excitation but higher after 2D excitation. This would indicate that the scanning is more chaotic after 2D excitation. However, this overall behaviour is not seen in the individual results and should thus be discarded. For the shape area, the session after the excitation seem to be indicate a slightly more chaotic scan pattern, this is true on average and for half of the observers.
The ratio between fixation and saccade time changes only slightly and is monotonously decreasing. Again the individual results are counterindicative with just two and one observer for the text and shape region respectively. The number of blinks or lost trackings was on average 5.9 and 4.9 for the 3D excitation and 5.5 and 5.0 for the 2D excitation. The individual results for each observer are displayed in Fig. 6. The variance is very large and the general tendency that the number of blinks was reduced after both excitations is only supported by six of the ten observers.
Table 1. Analysis of eyetracking data with indicators for the performance of the HVS
Indicator Text region Shape region
Pre3D Post3D Pre2D Post2D Pre3D Post3D Pre2D Post2D Length of visual track [degrees] 50.3 46.8 42.6 40.5 88.5 84.9 82.6 71.8 Average duration of fixations [ms] 215.0 219.5 219.3 210.6 277.5 279.6 286.6 278.6 Angle of subsequent saccades [degree] 14.0 13.3 13.5 14.8 29.1 30.4 30.0 30.6 Ratio fixation time vs. saccade time 7.7 7.5 7.5 7.2 10.8 10.6 10.6 10.4
1 3 4 6 7 8 9 10 11 12 0 10 20 30 40 50 60 70 80 90
Length of visual track in visual angle for text region
Observer
Length of visual track [degree]
Pre 3D Post 3D Pre 2D Post 2D 1 3 4 6 7 8 9 10 11 12 0 20 40 60 80 100 120 140
Length of visual track in visual angle for shape region
Observer
Length of visual track [degree]
Pre 3D Post 3D Pre 2D Post 2D
(a) Length of the visual track for reading the question (b) Length of the visual track for the search task
Figure 5. Length of the visual track for each observer
1 3 4 6 7 8 9 10 11 12 0 1 2 3 4 5 6 7 8 9 10
Average number of Blinks
Observer Blinks Pre 3D Post 3D Pre 2D Post 2D
Figure 6. Number of blinks for each observer
3.3 Task performance: Efficiency of solving the task
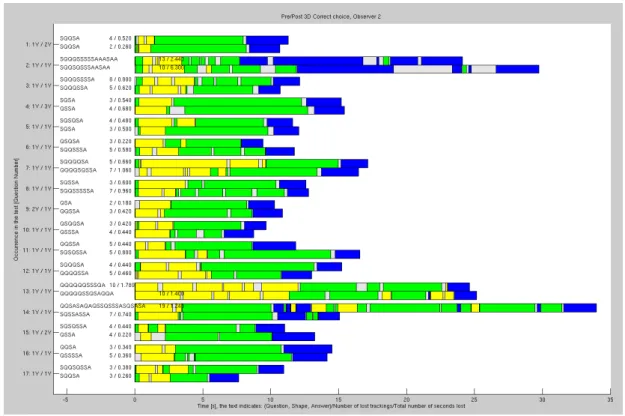
In the analysis of the efficiency for finding the solution to the task at hand, the time spent in the different areas and the temporal coherence is important. Thus, a different representation for the same observer as in Fig. 4 is used as shown in Fig. 7. In this diagram, all tasks can be summarized and compared for the 3D case. Each line contains one task, the upper part before the excitation, the lower part after 3D excitation. The length of the bars indicates the amount of time the observer spent. The color indicates the region, yellow if the observer looked at the text, green in the shape area and blue for the selection of the answer. When the gaze could not be tracked, the area is gray.
Some questions were more difficult to understand and to answer, e.g. question thirteen was “Are there more dark blue squares with green border than dark blue triangles with green border?”. Consequently, the observer needed about twice the time for performing the task. It can also be seen from the diagram that he had to reread the question for task thirteen; there is another yellow bar at about 18 seconds in the case after the excitation with 3D. In some cases, e.g. for task fourteen, the observers looked at the answer area before finishing with the search task.
This led to the idea of the definition of a task score analysis. The most direct way of solving the task would be to read the question, solve the search task and find the correct answer in the multiple choice area. Thus, the longest period of time is searched where the gaze stays in the three areas in the correct order. These periods are considered most useful. If the gaze returns to a previous area, this is considered as a flaw and thus, the time is less useful. Any time spent in any area before reading the question is considered as useless.
Figure 7. Comparison of duration for pre/post task performance in 3D excitation Table 2. Analysis of task performance score
Indicator Pre3D Post3D Pre2D Post2D Average time in most useful ordering [s] 474.2 464.8 444.8 431.7
Average time in useful regions [s] 102.7 93.8 64.0 56.4 Average time in useless regions [s] 9.3 7.1 6.8 6.2 Percentage of re-reading the question [%] 54.5 36.9 25.5 11.3 Percentage of wrong answers [%] 11.4 9.2 7.0 6.7
In addition, the average number of times the observer needed to reread the instructions may be used as an indication of loss of concentration. When the observer answered the question incorrectly, he had to redo the task at the end of the experiment. The average number of times this event occurred can also be seen as an indication of fatigue.
In Table 2 the average results for all ten observers and the four sessions are displayed. It can be seen that the amount of time decreases monotonously for all three categories. In general, this indicates that the practise that they got in doing the task superimposed any possible fatigue effect. The individual results of each observer show however, that this is only true on average. It is found true for only two observers for each of the most useful, useful and useless calculation.
For the re-reading of the questions also only a global decrease is measurable and it seems that the observers also answered the questions more reliably in general.
4. DISCUSSION
From the results obtained with the described analysis it has to be concluded that the viewing of 3D content on an autostereoscopic display does not have any measurable influence on subsequent task performance. Neither the basic features of the HVS change nor is there an indication that the subjects needed more time to perform the tasks. The reliability of their answers also did not drop.
This differs from the expectations mentioned in the introduction. Previously, it was seen that an involuntary defocus may occur after 3D excitation with the autostereoscopic display. The discrepancy may be attributed
to several factors. First, the participants in the subjective test were more focused on the task experiment than the experts that reported the involunatary defocus. Second, the task itself was more demanding in terms of immediate reaction: Reading the instructions, performing the search task and finding the correct answer from the multiple choice area requires continuous concentration on the screen. In the previous case, the defocus appeared for example while reading and understanding a text on a computer screen. While reflecting the content of the reading, the concentration of the subject does not necessarily stay focused on the screen. Third, it is difficult to verify that visual fatigue actually occured during the 20 minute excitation of the observers but some observers reported the typical symptoms of visual fatigue.
The only indication that was measured concerns the prism facility experiment. It was seen that after the 3D excitation the majority of the subjects were faster in performing the prism cycles. However, it should not be concluded that this is a sign of visual fatigue. While watching the 3D display, the participants have to decouple the control of the accomodation from the vergence system. Thus, the observers may learn by experience how to control the vergence of the eyes. The faster merging of the two lines into one line when the prism is changed may be the application of this learning process.
5. CONCLUSIONS
The new technology that is necessary for displaying 3D content rises many questions. In particular, the impact of the new technology on the human visual systems remains to be evaluated.
In this contribution, the influence of viewing 3D on an autostereoscopic display on subsequent task perfor-mance was evaluated. It was shown that no indication can be found that the observers in a subjective experiment loose their concentration on performing the given task. A detailed discussion presented that neither the time necessary to find the correct solution nor the reliability of the solution is affected. Moreover, it was shown that the HVS does not behave differently by analysing the saccades and fixations for reading the instructional text and performing the search task.
In addition, it was concluded that the phoria did not change in a significant way when measured with a Maddox rod. A prism facility test showed that the observers reached more prism cycles per minute after the 3D presentation.
Further studies are planned to verify the results on other types of 3D displays and to learn about the indication of the prism facility test.
REFERENCES
[1] Lambooij, M., Fortuin, M., IJsselsteijn, W., and Heynderickx, I., “Measuring Visual Discomfort associated with 3D Displays,” Proceedings of SPIE – Stereoscopic Displays and Applications XX 7237 (2009).
[2] Banks, M. S., Akeley, K., Hoffman, D. M., and Girshick, A. R., “Consequences of Incorrect Focus Cues in Stereo Displays,” Information Display 24, 10–14 (2008).
[3] Kuze, J. and Ukai, K., “Subjective evaluation of visual fatigue caused by motion images,” Displays 29, 159–166 (2008).
[4] Li, H.-C. O., Seo, J., Kham, K., and Lee, S., “Measurement of 3D Visual Fatigue using Event Related Potential (ERP): 3D Oddball Paradigm,” 3DTV Conference: The True Vision – Capture, Transmission and
Display of 3D Video , 213–216 (2008).
[5] Carlson, N. B. and Kurtz, D., [Clinical procedures for ocular examination], McGraw-Hill, 3 ed. (2004). [6] Huckauf, A. and Urbina, M. H., “On object selection in gaze controlledenvironments,” Journal of Eye
Move-ment Research 2, 1–7 (2008).
[7] Speranza, F., Tam, W., Renaud, R., and Hur, N., “Effect of disparity and motion on visual comfort of stereoscopic images,” in [Stereoscopic Displays and Virtual Reality Systems XIII, Proc. of SPIE], Woods, A., Dodgson, N., Merritt, J., Bolas, M., and Mcdowall, I., eds., 6055, SPIE (2006).
[8] Duchowski, A. T., [Eye Tracking Methodology: Theory and Practice], Springer-Verlag London Limited (2003). [9] Blehm, C., Vishnu, S., Khattak, A., Mitra, S., and Yee, R. W., [Survey of ophthalmology], vol. 50, ch.