HAL Id: tel-01412945
https://tel.archives-ouvertes.fr/tel-01412945
Submitted on 9 Dec 2016HAL is a multi-disciplinary open access archive for the deposit and dissemination of sci-entific research documents, whether they are pub-lished or not. The documents may come from teaching and research institutions in France or abroad, or from public or private research centers.
L’archive ouverte pluridisciplinaire HAL, est destinée au dépôt et à la diffusion de documents scientifiques de niveau recherche, publiés ou non, émanant des établissements d’enseignement et de recherche français ou étrangers, des laboratoires publics ou privés.
Digital surface model generation over urban areas using
high resolution satellite SAR imagery : tomographic
techniques and their application to 3-Dchange
monitoring
Martina Porfiri
To cite this version:
Martina Porfiri. Digital surface model generation over urban areas using high resolution satellite SAR imagery : tomographic techniques and their application to 3-Dchange monitoring. Signal and Image processing. Université Rennes 1, 2016. English. �NNT : 2016REN1S035�. �tel-01412945�
ANNÉE 2016
THÈSE / UNIVERSITÉ DE RENNES 1
sous le sceau de l’Université Bretagne Loire
En Cotutelle Internationale avec
Université de Rome 1 « La Sapienza », Italie
pour le grade de
DOCTEUR DE L’UNIVERSITÉ DE RENNES 1
Mention : Traitement du signal et télécommunications
Ecole doctorale MATISSE
Martina Porfiri
Préparée à l’unité de recherche IETR, UMR CNRS 6164
Institut d’Electronique et de Télécommunications de Rennes
UFR ISTIC
Digital Surface
Model
generation over
urban areas using
high resolution
satellite SAR
imagery:
tomographic
techniques and
their
application to 3-D
change monitoring
Thèse co-dirigée par : Mattia CRESPI
Professeur, Université de Rome 1 « La Sapienza »
Laurent FERRO-FAMIL
Professeur, Université de Rennes 1
et soutenue à Rome le 26/07/2016
devant le jury composé de :
Riccardo LANARI
Directeur de Recherche, IREA-CNR, Italie, examinateur
Andreas REIGBER
Professeur, TU Berlin & DLR Munich, Allemagne, rapporteur
Stefano TEBALDINI
Maître de Conférences, Politecnico di Milano, Italie, rapporteur
Florence TUPIN
Be the change you want to see in the world M. Gandhi
Contents
Contents iv
1 Introduction 7
1.1 Research objectives . . . 9
2 SAR: Synthetic Aperture Radar 13 2.1 SAR principles . . . 16
2.2 SAR effects . . . 22
2.2.1 Radar geometric distortions . . . 22
2.2.2 Speckle noise . . . 26
2.3 SAR platforms: TerraSAR-X . . . 28
3 3-D SAR imaging 35 3.1 Radargrammetric SAR . . . 36
3.2 Interferometric SAR . . . 40
3.3 Tomographic SAR . . . 45
4 SAR Tomography 47 4.1 State-of-the-art in urban areas . . . 48
4.2 Basic principles . . . 51
4.3 Focusing techniques . . . 54
4.3.1 MB-InSAR signal model . . . 55
4.3.2 Nonparametric tomographic estimators . . . 58
4.3.3 Parametric tomographic estimators . . . 61 iii
iv Contents
4.4 Proposed approach and innovative aspects . . . 63
5 2-D analysis and results 67
5.1 Presentation of the data set . . . 68 5.2 Interferometric quality and temporal stability analysis . . 71 5.3 Tomograms generation . . . 78
6 3-D analysis and results 83
6.1 Height map generation . . . 85 6.2 Vertical reflectivity estimation . . . 93 6.3 Time stability analysis . . . 96
7 Conclusions and outlook 101
7.1 Conclusions . . . 101 7.2 Further investigations and improvements . . . 103
List of Figures
2.1 Electromagnetic spectrum . . . 14
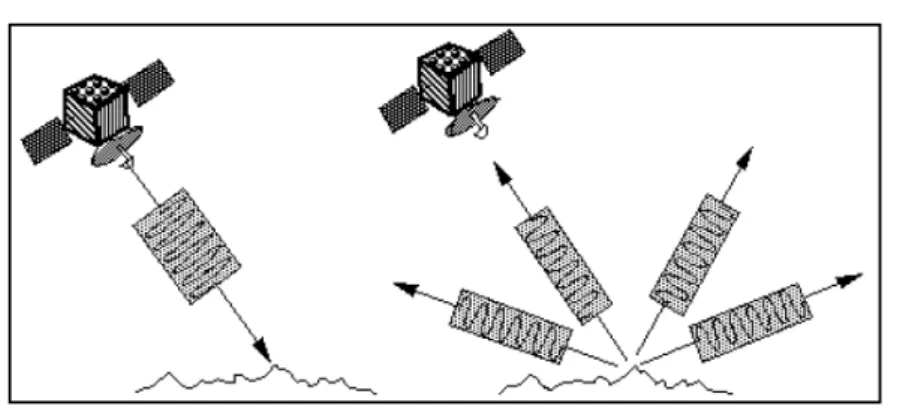
2.2 Signal trasmitted from the satellite (left image) and signal backscattered from the surface (right image) . . . 17
2.3 RAR system from a satellite . . . 18
2.4 Image resolution . . . 19
2.5 Sbaceborne SAR system [1] . . . 20
2.6 Different backscatters from (a) an urban area, (b) a vege-tated area, (c) a smooth areas . . . 21
2.7 Radar geometric distortions: foreshortening, layover and shadow . . . 23
2.8 Foreshortening [5] . . . 23
2.9 Layover in case of very steep slope [3] . . . 24
2.10 (a) Layover and shadow phenomena in built-up areas; (b) TerraSAR-X image captured in Spotlight mode (image taken from [7]) . . . 25
2.11 Shadow [3] . . . 26
2.12 Speckle effects . . . 27
2.13 TerraSAR-X satellite . . . 32
3.1 StereoSAR acquisition system in zero Doppler geometry . 37 3.2 Geometrical constrain and voxel generation . . . 39
3.3 Geometry of interferometric SAR system . . . 41 v
vi List of Figures
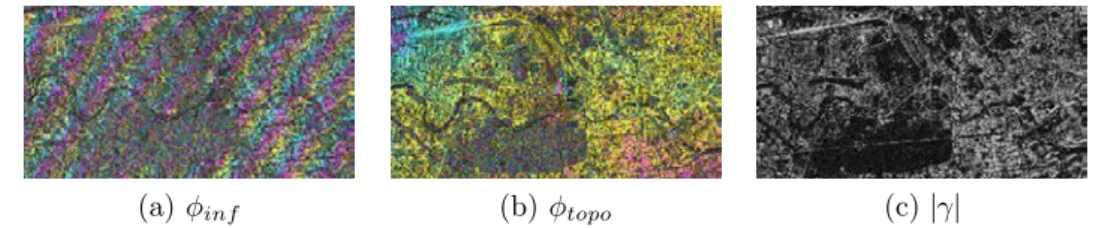
3.4 Interferometric phase variations with range r and height z, related respectively to the flat earth effect and the
to-pography . . . 43
3.5 Interferometric phase, topographic phase and interfero-metric coherence (Berlin urban area) . . . 45
3.6 SAR tomographic representation [56] . . . 46
4.1 Tomographic SAR satellite imaging geometry . . . 52
4.2 MBInSAR geometrical configuration . . . 56
4.3 Diagram of the proposed approach applied to each resolu-tion cell and for three iterative steps (three as the maxi-mum number of the effective sources N0) . . . 65
5.1 Multitemporal averaged amplitude image over Paris urban area derived from TerraSAR-X data stack and the selected AOI . . . 69
5.2 Distributions of the 21 acquisitions in the spatial and tem-poral baseline domains . . . 70
5.3 Image taken from Google Earth (top) and multitemporal averaged amplitude image derived from TerraSAR-X data stack (bottom) . . . 70
5.4 Semplified map taken from [2] of the selected subset of the AOI . . . 71
5.5 Spatial-temporal trend of coherence mean values (left) eval-uated over different image subsets (right) considering the first 19 (good) images within the stack . . . 72
5.6 Calibrated coherence maps along temporal and spatial base-lines . . . 73
5.7 Coherence image and interferogram computed between im-ages with IDs 1 and 2 . . . 75
List of Figures vii
5.8 Coherence indicator trend over the selected subset ranges from 1 (high coherence) and 0.3 (low coherence) and rela-tive amplitude image (right) . . . 76 5.9 Image of the parameter ⇤ on Paris test site, whose values
go from 0 (very low stationarity) and 1 (very high station-arity) . . . 77 5.10 Tomograms generated over one profile applying
Beam-forming, Capon and MUSIC spectral estimators . . . 81 5.11 Tomograms generated over one layover-affected profile
ap-plying Beamforming, Capon and MUSIC spectral estimators 82 6.1 Tiles considered for 3-D reconstructions and investigations 84 6.2 3-D height maps represented in ground range over a mixed
urban area using Beamforming, Capon and MUSIC ap-proaches and considering all the detected sources . . . 87 6.3 3-D height maps represented in ground range over a mixed
urban area considering several detected scatterers using MUSIC method . . . 88 6.4 3-D height maps of Tour Keller area represented in ground
range and extracted considering several detected scatter-ers using MUSIC method: layover distortions have been mostly corrected . . . 90 6.5 3-D height maps of Tour Mirabeau represented in ground
range and considering results obtained using Beamform-ing, Capon and MUSIC approaches . . . 92 6.6 3-D height maps of Tour Mirabeau represented in ground
range and from different point of views and obteined using the MUSIC method . . . 93
viii List of Figures
6.7 3-D reflectivity maps of the Tour Keller area represented in ground range and extracted considering several detected scatterers. Highest values are related to the double bounce reflection occurring at the wall-ground interaction . . . 94 6.8 Tour Keller area: reflectivity histrograms for different
de-tected sources . . . 95 6.9 Reflectivity maps of the Tour Mirabeau represented in
ground range and extracted considering all the detected scatterers. Highest values are related to the double bounce reflection occurring at the wall-ground interaction . . . 96 6.10 Tour Keller area: analysis about the unstable image IDs . 98 6.11 3-D views of the Tour Keller’s area in terms of the CVm . 99 6.12 3-D views of the Tour Mirabeau in terms of the CVm . . . 100
List of Tables
2.1 Platform analysis at different scale of interest . . . 15 2.2 TerraSAR-X technical data . . . 31 6.1 Amount of the scatterers detected at three levels using
different estimation techniques over several tiles . . . 86
Glossary of acronyms
2D bi-dimensional 35
3D three-dimensional 8, 35, 47 4D four-dimensional 47
ABM Area Based Matching 39 AOI Area Of Interest 67, 69 CS Compressive Sensing 50
CSM COSMO-SkyMed 49
DEM Digital Elevation Model 35 DLR German Aerospace Center 29, 68 DOA Directions Of Arrival 58
DSM Digital Surface Model 8, 28, 35, 46, 47 DTM Digital Terrain Model 35
ESA European Space Agency 8 FIR Finite Impulse Response 59
xii Glossary of acronyms
GCPs Ground Control Points 38 GP Ground Point 38
GPS Global Positioning System 31 GSD Ground Sample Distance 8, 36 HS High Resolution Spotlight 67 InSAR Interferometric SAR 35
LCT Laser Communication Terminal 32 LS Least-Squares 37, 60, 61
MB MultiBaseline 48
MB-InSAR Multibaseline SAR Interferometric 10, 47, 49, 51, 54, 55
MB-PolInSAR Polarimetric MB-InSAR 54
MLRT Maximum-Likelihood Ratio Test 65 MOS Model Order Selection 63
MUSIC MUltiple SIgnal Classification 62 PolSAR Polarimetric SAR 75
PolTomSAR Polarimetric SAR Tomography 54 PSD Power Spectral Density 58
RAR Real Aperture Radar 16 RMSE Root Mean Square Error 28
Glossary of acronyms xiii
RPCs Rational Polynomial Coefficients 37 RPFs Rational Polynomial Functions 37 SAR Synthetic Aperture Radar 8, 13 SNR Signal to Noise Ratio 28, 39 SP Single Polarization 49, 67, 74
SRTM Shuttle Radar Topography Mission 40 StereoSAR Radargrammetric SAR 35
TomoSAR Tomographic SAR 35, 51
Résumé en français
La Terre est un système dynamique et sa surface est en cons-tante évolution à différentes échelles de temps. L’imagerie sa-tellitaire et les produits secondaires qui en dérivent jouent un rôle important en fournissant les informations nécessaires à l’analyse, au suivi et à la caractérisation de la dynamique de la surface de la Terre. Par conséquent, il est nécessaire d’obte-nir des mesures rapides et précises de l’écosystème de la Terre. L’urbanisation et la gestion de l’environnement urbain et sa périphérie deviennent l’un des problèmes les plus cruciaux dans les pays développés et en voie de développement. Dans ces circonstances, les données de télédétection sont une source importante d’information qui reflète les interactions entre les êtres humains et leur environnement. Compte tenu de leur indépendance totale des contraintes logistiques sur le terrain, d’éclairage (lumière du jour) et de conditions météorologiques (nuages), les radars à synthèse d’ouverture (SAR) satellitaires peuvent fournir des contributions importantes d’environne-ments complexes à travers, par example, leur reconstruction 3-D. Les images SAR 2-D sont sujettes à d’importantes dis-torsions géométriques qui limitent fortement la portée de leur interprétation pour la caractérisation d’environnements com-plexes, comme les zones urbaines.
En particulier, à partir de 2007, la nouvelle génération de capteurs SAR à haute résolution comme l’italien COSMO-SkyMed, l’allemand TerraSAR-X et le canadien
RADARSAT-2 a permis d’acquérir des images SAR jusqu’à 1 m de réso-lution au sol en mode SpotLight et sous divers angle d’in-cidence. À l’heure actuelle l’attention se pote sur la récente famille de missions appelée Sentinel (-1 pour la technologie SAR) et développée par l’Agence Spatiale Européenne (ESA) spécifiquement pour les besoins opérationnels de Copernicus, le programme d’observation de la Terre dirigé par la Com-mission Européenne en partenariat avec l’ESA et visant à fournir des informations précises, pertinentes et facilement ac-cessibles pour améliorer la gestion de l’environnement, com-prendre et atténuer les effets du changement climatique et assurer une mission de sécurité civile. En effet, les capteurs et les technologies SAR modernes peuvent répondre à la de-mande publique concernant le suivi des changements rapides sur le terrain et dans les activités anthropiques. La possibi-lité de réaliser en temps quasi réel la cartographie 3-D de la surface de la Terre par satellite de télédétection représente un outil précieux pour plusieurs objectifs d’Horizon 2020, le nouveau programme-cadre pour la recherche et l’innovation en Europe.
Une des applications les plus importantes de la télédétection SAR est la génération de Modèles Numériques de Surface (DSM), qui permet de modéliser en trois dimensions la sur-face de la Terre. Dans les zones suburbaines et urbaines, en DSM se révèle très utile pour un grand nombre d’applica-tions, qui incluent les calculs d’optimisation de l’emplace-ment des antennes de télécommunication, la cartographie des risques, la génération orthoimage, la planification urbaine et la surveillance. Trois techniques différentes imagerie SAR 3-D peuvent être discernées : le radargrammétrie, l’interférométrie et la tomographie. La radargrammétrie ne requiert en
prin-cipe que quelques images pour reconstruire la forme 3-D de la Terre, comme dans la vision stéréo humaine ou dans la photogrammétrie classique appliquée à l’imagerie optique, en exploitant uniquement l’information de signal d’amplitude. L’interférométrie utilise l’information de différence de phase entre (au moins) deux images SAR pour estimer l’élévation du terrain.
Ici, l’attention est mise sur la tomographie SAR : à partir d’une pile d’images recueillies en configuration interferome-trique multibaselines, une telle technique permet d’extraire les informations de hauteur en formant une ouverture syn-thétique dans la direction d’élévation afin d’obtenir une réso-lution sensiblement améliorée. Les premières expériences im-portantes ont concerné l’analyse des structures de volume, comme les forêts, en utilisant des données aéroportés acquises à basse fréquence (par exemple les bandes L- ou P-). La pre-mière application SAR est présentée dans [54], a été obtenue en utilisant des données MultiBaseline en bande L acquises par E-SAR, le système aéroportée du DLR. Au fil des ans, différents articles ont été publiés sur la tomographie SAR ap-pliquée à l’estimation de a la structure de la forêt [58, 31, 60], de l’épaisseur de la glace [59] ou la hauteur de bâtiments [70, 21, 30], pour résoudre les problèmes liés à la géomé-trie SAR , en particulier dans les zones urbaines complexes [7, 32, 53, 51].
Cette thèse de doctorat se concentre sur les potentialités élevées de techniques tomographiques pour la surveillance 3-D des changements et la caractérisation des zones com-plexes et denses bâties, en utilisant des estimateurs mono-dimensionnels de base comme Beamforming, Capon et MU-SIC sur la zone urbaine de Paris en utilisant des données
TerraSAR-X à haute résolution et à polarisation unique. Le travail présenté ci-après limite le domaine des méthodes utili-sées pour la reconstruction 3-D à des techniques d’estimation très rapides et n’aborde pas les estimateurs de signaux parci-monieux.
Dans un premier temps, l’analyse de la qualité interféromé-trique de l’ensemble de données transformées a été réalisée. Les résultats ont montré de bonnes valeurs de cohérence moyenne au sein de l’ensemble de la pile et ont permis de détecter des images considérées comme des valeurs aberrantes en termes de niveaux de conditions temporelles et spatiales, pour fina-lement sélectionner l’ensemble adéquat de données multitem-porelles à traiter. L’extraction des tomogrammes a montré la capacité de distinguer plus d’un diffuseur à l’intérieur de la même cellule de résolution et de reconstituer la topographie de bâtiments. Successivement, une caractérisation tridimen-sionnelle globale a été réalisée dans le but de développer un outil de suivi des changements 3-D des structures simples. En outre, la possibilité de corriger les distorsions géométriques en raison de la projection en distance (qui affecte fortement ce genre de scénarios) et de déterminer les informations sur le nombre de diffuseurs (jusqu’à trois) et la réflectivité corres-pondant à l’intérieur d’une cellule de résolution ont été éva-lués. Plusieurs reconstructions 3D de structures simples ont été réalisées à la fois en terme de hauteurs des bâtiments et réflectivité verticale. Par ailleurs une analyse novatrice de la stabilité temporelle de la scène observée a été réalisée afin de détecter les diffuseurs stables et instables.
L’analyse effectuée en termes d’estimation de la réflectivité verticale a permis d’identifier différents comportements ca-ractéristiques : des valeurs élevées sur l’interaction mur-sol a
révélé la présence de réflexion de type double rebond ; le sol étant caractérisé par de faibles valeurs de réflectivité. L’ana-lyse de la stabilité dans le temps 3-D a démontré la possibilité de suivre l’évolution en 3-D en fonction du temps.
Finalement, il est possible d’affirmer que le traitement des données SAR haute résolution permet d’obtenir une forte amélioration en 3-D des capacités d’imagerie. Les reconstruc-tions 3-D présentés dans cette thèse ont permis d’effectuer une caractérisation globale des zones urbaines à travers le traitement d’un ensemble adéquat d’images multitemporelles haute résolution SAR, démontrant ainsi les potentialités de la technique TomoSAR dans la correction des distorsions, dans la détermination des informations sur le nombre de diffuseurs et de la réflectivité correspondant à l’intérieur d’une cellule de résolution et leur évolution temporelle en utilisant des es-timateurs mono-dimensionnels de base comme Beamforming, Capon et MUSIC.
Abstract
The Earth is a dynamic system and its surface is continu-ously changing at different time scales. Satellite imagery and derived secondary products play a relevant role in supply-ing the information necessary for analyssupply-ing, monitorsupply-ing and characterizing the Earth’s surface dynamics. Accordingly, it is necessary to obtain timely and precise measurements of Earth’s ecosystem. The urbanization and the management of urban environment and its periphery become one of the most crucial issues in developed and developing countries. In these circumstances, remote sensing data are an important source of information that reflects interactions between human be-ings and their environment. Given their complete indepen-dence from logistic constraints on the ground, illumination (daylight), and weather (clouds) conditions, Synthetic Aper-ture Radar (SAR) satellite systems may provide important contributions in complex environments 3-D reconstruction. SAR 2-D images are characterized by important geometric distortions, that severely limits their interpretation for the characterization of complex environments, such as urban ar-eas.
In particular, starting from 2007 the new generation of high resolution Synthetic Aperture Radar (SAR) sensors as the Italian COSMO-SkyMed, the German TerraSAR-X and the Canadian RADARSAT-2 allowed to acquire SAR imagery up to 1 m Ground Sample Distance (GSD) in SpotLight mode,
and with different incidence angle. At the present the atten-tion is on the recent new family of missions called Sentinels (-1 for SAR technology) and developed by the ESA specifi-cally for the operational needs of Copernicus, the Earth ob-servation programme headed by the European Commission in partnership with ESA and aimed to provide accurate, timely and easily accessible information to improve the management of the environment, understand and mitigate the effects of cli-mate change and ensure civil security. Indeed, modern SAR sensors and technologies can satisfy the demand for the mon-itoring of rapid changes on the ground and in anthropic ac-tivities. The possibility of near-real-time 3D Earth surface mapping satellite remote sensing data enable the possibility of continuous observation of the Earth’s surface, with short times of acquisitions and revisit, representing a valuable tool for several objectives of Horizon 2020, the new framework programme for research and innovation in Europe starting on 2014.
One of the most important applications of SAR remote sens-ing is the generation of Digital Surface Models (DSMs), that is, three-dimensional models of the Earth’s surface. In sub-urban and sub-urban areas it is very useful for a great number of applications, that include the inter-visibility calculations for the optimization of the location of telecommunication anten-nas, risk mapping, orthoimage generation, mission and urban planning and monitoring. Three different 3-D imaging tech-niques may be discerned: the radargrammetry, the interfer-ometry and the tomography. Radargrammetry in principle requires just a couple of images to reconstruct the 3-D shape of the Earth, like in the human stereo vision or in the clas-sical photogrammetry applied to optical imagery, exploiting
just the amplitude signal information. Interferometry uses the phase differences information between (at least) two SAR images to lead the terrain elevation.
Here the attention is put on the SAR Tomography: start-ing from a stack of images collected usstart-ing multibaseline data performed in interferometric configuration, such a technique allows to retrieve height information forming a synthetic aper-ture in the elevation direction in order to achieve a substan-tially improved resolution. First important experiments has concerned the analysis of volume structures, such as forests, using low frequencies (e.g. L- or P-band) airborne sensors. The first application is represented by [56]. The experimen-tal results have been achieved using MultiBaseline L-band data sets acquired by the DLR’s E-SAR (airborne) system. Succesevely, over the years, different papers have been pub-lished about the tomographic SAR techniques application in order to retrieve the forest structure [60, 33, 62], to estime ice thickness [61] or building height [70, 23, 32], to solve the layover problem induced by strong terrain slopes or disconti-nuities in the imaged scene, especially in complex urban areas [9, 34, 55, 53].
The present PhD thesis is focused on the high potentiali-ties of tomographic techniques in 3-D change monitoring and characterization for complex and dense built-up areas using basic mono-dimensional estimators as Beamforming, Capon and MUSIC combined to very high satellite SAR resolution imagery. 2-D and 3-D analysis have been presented over the urban area of Paris using TerraSAR-X data at high resolution and single polarisation. The present work is mainly focused on the 3-D reconstruction by very fast estimation techniques and does not take into account parsimonious signal
estima-tors.
At first, the analysis of the interferometric quality of the pro-cessed data set has been performed. The results showed good mean coherence values within the entire stack and allowed to detect images considered as outlier in terms of temporal and spatial baselines and to select the adequate set of multitem-poral data to be processed. The extraction of 2-D tomograms over different azimuth-profile has showed the capabilities to distinguish more than one scatterer within the same reso-lution cell and to reconstruct the vertical building profiles. Successively, a global three-dimensional characterization has been performed in order to develop a monitoring tool for the 3-D changes of single structures. Moreover, the possibility to correct the geometric distortions due to the layover (that strongly affects such kind of scenarios) and to determine the information about the number of scatterers (up to three) and the corresponding reflectivity within one resolution cell have been evaluated. Several 3-D reconstructions of single struc-tures have been performed both in term of buildings heights and vertical reflectivity. Moreover an innovative time stabil-ity analysis of the observed scene have been carried out in order to detect the stable and unstable scatterers.
The analysis performed in terms of vertical reflectivity esti-mation allowed to identify different features behaviour: high values at the interaction wall-ground revealed the double bounce strong reflection occurring in that area; the ground is charac-terized by low reflectivity values. The 3-D time stability anal-ysis demonstrated the possibility to monitor the 3-D change depending on the time.
Eventually, it is possible to assert that processing high reso-lution SAR data allows to achieve a strong improvement in
3-D imaging capabilities. The 3-D reconstructions presented in the present thesis enabled to perform a global characteri-zation of build-up areas, processing an adequate set of mul-titemporal high resolution SAR images. It has been demon-strated the potentialities of TomoSAR technique in distor-tions correction, in determining information about the num-ber of scatterers and the corresponding reflectivity within one resolution cell and in 3-D change monitoring using ba-sic mono-dimensional estimators as Beamforming, Capon and MUSIC.
Chapter 1
Introduction
Nowadays our life is strongly dependent on satellites in orbit around the Earth which make us safer, provide modern conveniences, broadcast en-tertainment, information about our planet gathered from space and sent around the globe in the blink of an eye.
First satellite space programs have been run with military purposes and the first images of the Earth were captured in the 1960s, even though its capabilities have not been immediately understood. Indeed with re-spect to that date, the impact of this information on our everyday life is only a recent phenomenon. It was during the past decade (since 1999, with the launch of IKONOS) that a kind of competition started among different companies and agencies to launch optical and radar sensors with higher and higher resolution for civilian applications. Accordingly, many research groups around the world started to develop methodolog-ical and practmethodolog-ical investigations about the large number of applications of this new satellite imagery, such as land monitoring, archaeological and environmental studies, cartography and mapping. It was clearly under-stood that high resolution sensors permit an easier acquisition of data of the same area at regular intervals, which is useful to monitor natural and anthropic phenomena evolving in time (e.g., urban growth, natural disasters); moreover, high resolution remote sensors allow us to obtain
8 Introduction
images of areas where it may be difficult to carry out traditional surveys for logistic reasons (e.g., developing countries, wild and remote areas). After many traditional optic sensors, radar ones acquired importance in recent years due to their improving acquisition resolution and their capac-ity to acquire imagery in situation where optical sensors are less useful: thanks to their active sensor nature and spectral domain they are able to acquire imagery through clouds and even during night. In particular, starting from 2007 the new generation of high resolution Synthetic Aper-ture Radar (SAR) sensors as the Italian COSMO-SkyMed, the German TerraSAR-X and the Canadian RADARSAT-2 allowed to acquire SAR images up to 1 m Ground Sample Distance (GSD) in SpotLight mode, and with different incidence angles. At the present the attention is on the recent new family of missions called Sentinels (-1 for SAR technol-ogy) and developed by the European Space Agency (ESA) specifically for the operational needs of Copernicus, the Earth observation programme headed by the European Commission in partnership with ESA and aimed to provide accurate, timely and easily accessible information to improve the management of the environment, understand and mitigate the ef-fects of climate change and ensure civil security. Indeed, modern SAR sensors and technologies can satisfy the demand for the monitoring of rapid changes on the ground and in anthropic activities. The possibility of near-real-time three-dimensional (3D) Earth surface mapping satellite remote sensing data enable the possibility of continuous observation of the Earth’s surface, with short times of acquisitions and revisit, repre-senting a valuable tool for several objectives of Horizon 2020, the new framework programme for research and innovation in Europe starting on 2014.
One of the most important applications of SAR remote sensing is the generation of Digital Surface Model (DSM), that is, three-dimensional models of the Earth’s surface. In modern map production, the 3-D imag-ing techniques have become an information source for scene analysis and
1.1 Research objectives 9
understanding, for change detection, for GIS database updating, for car-tographic 3-D feature extraction and reconstruction. In suburban and urban areas it is very useful for a great number of applications, that in-clude the inter-visibility calculations for the optimization of the location of telecommunication antennas, risk mapping, orthoimage generation, mission and urban planning. Starting from the SAR data, with respect to the requirements of data accuracy and completeness and of realization efficiency and versatility, three different 3-D imaging techniques may be discerned: radargrammetry, interferometry and tomography.
Radargrammetry in principle requires just a couple of images to recon-struct the 3-D shape of the Earth, like in the human stereo vision or in the classical photogrammetry applied to optical imagery, exploiting just the amplitude signal information. Interferometry uses the phase differ-ences information between (at least) two SAR images to lead the terrain elevation. Tomography represents an evolution of the last one, perform-ing a 3-D imagperform-ing by the formation of an additional synthetic aperture in elevation using more than two SAR acquisitions performed in interfer-ometric configuration.
1.1 Research objectives
The present PhD thesis is focused on the analysis of dense and complex urban areas by means of tomographic techniques applied to high resolu-tion satellite SAR imagery. Starting from the classical second product of this approach, that is the reflectivity two-dimensional tomograms, a global three-dimensional characterization has been performed in order to develop a monitoring tool for the 3-D changes of single structures. Moreover, the possibility to correct the geometric distortions due to the layover (that strongly affects such kind of scenarios) and to determine the information about the number of scatterers (up to three) and the
10 Introduction
corresponding reflectivity within one resolution cell have been evaluated. Several 3-D reconstructions of single structures have been performed both in terms of buildings heights and vertical reflectivity. Moreover an in-novative time stability analysis of the observed scene have been carried out in order to detect the stable and unstable scatterers. The process-ing have been performed usprocess-ing an adequate high resolution Multibaseline SAR Interferometric (MB-InSAR) data acquired over Paris urban area by the satellite TerraSAR-X. The final goal is to demonstrate the high potentialities of tomographic techniques in 3-D change monitoring and characterization for built-up areas using basic mono-dimensional estima-tors as Beamforming, Capon and MUSIC combined to very high satellite resolution data. The present work is mainly focused on the 3-D re-construction by very fast estimation techniques and does not take into account parsimonious signal estimators.
Starting from these purposes, the thesis is structured in the following chapters:
• CHAPTER 2: introduction and description of SAR imaging prin-ciples (acquisition mode, geometric distortion, speckle noise) and satellite platforms, with particular attention for TerraSAR-X • CHAPTER 3: overview of the three SAR 3-D imaging techniques:
radargrammetry, interferometry and tomography
• CHAPTER 4: examination of the tomographic focusing tech-nique, including the basic principles and the state of the art for the urban analysis
• CHAPTER 5: description of the data set, analysis of the data interferometric quality and of the 2-D experimental results obtained using the Beamforming, Capon and MUSIC spectral estimation techniques
1.1 Research objectives 11
• CHAPTER 6: analysis of the 3-D experimental results in terms of building height retrieval, vertical reflectivity estimation and time stability analysis
Chapter 2
SAR: Synthetic Aperture Radar
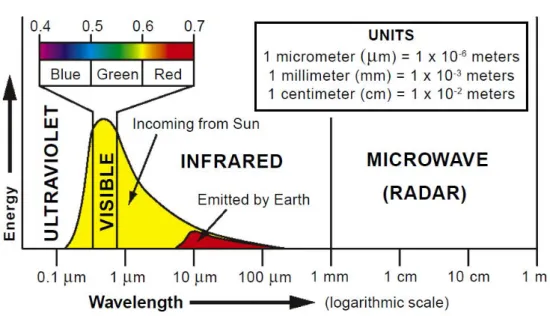
SAR possesses some unique characteristics, such as all-weather function-ality, capability of penetrating dense cover, and signal coherence, that gives it a considerable advantage over other infrared or optical sensors. Remote sensing is the science of obtaining and interpreting information from a distant point of view, using sensors that are not in physical con-tact with the object being observed [47]. The science of remote sensing in its broadest sense includes aerial, satellite, and spacecraft observations of the surfaces and atmospheres of the planets in our solar system, though the Earth is obviously the most frequent target of study. The term is cus-tomarily restricted to methods that detect and measure electromagnetic energy (see Fig. 2.1).
Imagery acquired by airborne or satellite sensors provides an impor-tant source of information for mapping and monitoring natural and man-made features on the land surface. The spatial, spectral, and temporal components of an image or set of images all provide information that we can use to form interpretations about surface materials and conditions. For each of these properties we can define the resolution of the images produced by the sensor system. These image resolution factors place limits on which information we can derive from remotely sensed images. The spatial resolution is the smallest distance separating two objects
14 SAR: Synthetic Aperture Radar
Fig. 2.1 – Electromagnetic spectrum
that can be discerned. It is a measure of the spatial detail in an image, which is a function of the design of the sensor and its operating altitude above the Earth’s surface. Each of the detectors in a remote sensor measures energy received from a finite patch of the ground surface. The smaller these individual patches are, the more detailed will be the spatial information that we can interpret from the image. For digital images, spatial resolution is most commonly expressed as the ground dimensions of an image cell.
The spectral resolution of a remote sensing system can be described as its ability to distinguish different parts of the range of measured wave-lengths. In essence, this amounts to the number of wavelength intervals (bands) that are measured, and how narrow each interval is. An image produced by a sensor system can consist of one very broad wavelength band, a few broad bands, or many narrow wavelength bands. The names usually used for these three image categories are panchromatic, multi-spectral, and hypermulti-spectral, respectively.
oc-15 curring on time scales ranging from seconds to decades or longer. The seasonal cycle of plant growth that affects both natural ecosystems and crops is an important example. Repeat imagery of the same area through the growing season adds to our ability to recognize and distinguish plant or crop types. A time-series of images can also be used to monitor changes in surface features due to other natural processes or human activity. The time-interval separating successive images in such a series can be consid-ered to define the temporal resolution of the image sequence.
Satellites detect the signal on several wavelengths depending on their spectral and spatial characteristics. Then, also the data resolution de-pends on these characteristics, how it is shown in table 2.1
Type Satellite Spectral Resolution Temporal Resolution Best Spatial Resolution (rg x az)
WorldView-3 29 bands (400-2245 nm) < 1 days 0.31x0.31 m (panchromatic at nadir)
OPTICAL IKONOS 5 bands (450-900 nm) 3 days 0.82x0.82 m (panchromatic at nadir)
Sentinel-2 13 bands (443-2190 nm) at equator 10 days (1 sat) - 5 days (all sat) 10x10 m (4 visible, near-infrared) TerraSAR-X Microwave (X band) 2.5-11 days (depending on imaging mode) 0.6x0.24 m (Staring SpotLight mode)
RADAR Sentinel-1 Microwave (C band) 12 days (1 sat) - 6 days (all sat) 5x5 m (StripMap mode)
ALOS-2 Microwave (L band) 14 days 3x1 m (Spotlight mode)
Table 2.1 – Platform analysis at different scale of interest
In comparison with the optical remote sensing, the radar remote sens-ing offers some advantages, such as:
• all weather capability (small sensitivity of clouds, light rain) • day and night operation (independence of sun illumination, i.e.
active system)
• sensitivity to dielectric properties (water content , biomass, ice) • sensitivity to surface roughness (ocean wind speed) and to dielectric
properties (water content, biomass, ice) • accurate distance measurements
16 SAR: Synthetic Aperture Radar
• subsurface penetration (the longer the wavelength, the higher the transmission through a medium)
and some inconveniences, such as:
• complex interactions (difficulty in understanding, complex process-ing)
• speckle noise effects
• distortion of a scene geometry
2.1 SAR principles
In this section a basic introduction of SAR principles is given, from the fundamentals of the system to the main sensor features. Since during the last decades this technology has been deeply described and investigated, here only the concepts useful for understanding the present thesis are presented. For detailed discussions one can refer to, e.g., [15, 25].
Imaging radar is an active illumination system. An antenna, mounted on a platform, transmits a radar signal in a side-looking direction towards the Earth’s surface. The reflected signal, known as the echo, is backscat-tered from the surface and received a fraction of a second later at the same antenna (monostatic radar) (see Fig. 2.2). For coherent radar sys-tems such as SAR, the amplitude and the phase of the received echo (which are used during the focusing process to construct the image) are recorded. Aperture means the opening used to collect the reflected en-ergy that is used to form an image. In the case of radar imaging this is the antenna. For Real Aperture Radar (RAR) systems, only the amplitude of each echo return is measured and processed. The spatial resolution of RAR is primarily determined by the size of the antenna used: the larger the antenna, the better the spatial resolution. The spatial resolution can be defined through to directions: slant range direction, perpendicular to
2.1 SAR principles 17
Fig. 2.2 – Signal trasmitted from the satellite (left image) and signal backscat-tered from the surface (right image)
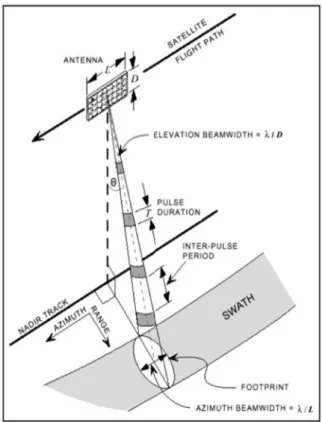
flight path of the spacecraft, and azimuth direction, parallel to the flight path of the spacecraft (see Fig. 2.3). Note that, defining the range as the distance from the radar to the scatterer, the slant range is the dimen-sion in the image, different to the ground range that is the dimendimen-sion along the ground. Another important element is the look angle ✓ (or off-nadir angle), defined as the vertical angle between the inclination of the antenna and the nadir. The look angle is steepest for the portion of the image nearest the flight path (near range), and decreases toward the far range. The range resolution r (see Fig. 2.4a) is defined for unmodulated pulses as:
r= c⌧
2 (2.1)
where:
c is the speed of light in vacuum ⌧ is the pulse duration
Range resolution is independent of the height of the spacecraft H, and it depends primarily on the duration of the pulse ⌧. For modulated pulse, with bandwidth B, the range resolution is given by
r= c
18 SAR: Synthetic Aperture Radar
Fig. 2.3 – RAR system from a satellite
The azimuth resolution a (see Fig. 2.4b) may be approximated as: a= R
L (2.3)
where:
R is the slant range
is the wavelength of the microwave
L is the length of the aperture of radar antenna
Azimuth resolution is dependent also on the height of the spacecraft H, and it improves ( a reduces) as the antenna length L is increased. The radar image is arranged by a pixel matrix, in which each pixel is
2.1 SAR principles 19
(a) Slant range resolution (b) Azimuth resolution
(c) Cell resolution
Fig. 2.4 – Image resolution
associated to a resolution cell (see Fig. 2.4c).
To improve the resolution of radar images, SAR was developed in the 1960s. The SAR systems take advantage of the Doppler history of the radar echoes generated by the forward motion of the spacecraft to synthesise a large antenna (see Fig. 2.5). This allows high azimuth resolution in the resulting image despite a physically small antenna (L is drastically reduced). As the radar moves, a pulse is transmitted at each position. The return echoes pass through the receiver and are recorded in an echo store. SAR requires a complex integrated array of onboard navigational and control systems, with location accuracy provided by both Doppler and inertial navigation equipment. For sensors such as ERS-1/2 SAR and ENVISAT ASAR, orbiting about 900km from the Earth, the area on the ground covered by a single transmitted pulse (footprint) is about 5 km long in the along-track (azimuth) direction.
20 SAR: Synthetic Aperture Radar
Fig. 2.5 – Sbaceborne SAR system [1]
and phases from moving targets with a small antenna, the effect of which is to should be theoretically convert to the effect of a large antenna, that is a synthetic aperture length, i.e. the beam width by range which a RAR of the same length, can project in the azimuth direction. Compared to the RAR azimuth resolution described earlier, the azimuth resolution a of the SAR is much improved, that is:
a= L
2 (2.4)
Indeed, it means that the azimuth resolution a of a SAR is only determined by the length of the real aperture of an antenna L, indepen-dently of the slant range R. Each pixel of the SAR image holds the sum of the backscattered echoes toward the radar from all the objects in the resolution cell. The signal intensity received by the radar depends on the object in the resolution cell, e.g. urban or rocky areas have high in-tensity (white pixel), vegetated areas have medium inin-tensity (grey pixel) and smooth areas (as basins of calm water) have low intensity (black pixel)(see Fig. 2.6). Diverse scattering mechanisms can be associated to these different media. For example double bounce reflection can occur between the ground and building façades as well as between the ground
2.1 SAR principles 21
and under-foliage objects and between the object and the trunk, the vo-lumic scattering is often related to the presence of vegetated (canopy) areas, the single bounce is derived from the building roof or the bare soil.
Fig. 2.6 – Different backscatters from (a) an urban area, (b) a vegetated area, (c) a smooth areas
SAR images contain a coherent, amplitude and phase, information. Depending on the information exploited for 3-D mapping, two techniques may be discerned: interferometry based on phase and radargrammetry based on amplitude. The main difference between these two techniques is that radargrammetry calculates the image range offset using the posi-tion matching of the same ground targets in two images whereas InSAR calculates the phase difference between two images.
SAR imaging operating modes are:
• Spotlight Mode, in which the antenna is steered (both in the az-imuth and the elevation plane) during the overall acquisition time in order to illuminate the required scene for a time period longer than the one of the standard strip side view, increasing the length of the synthetic antenna and therefore the azimuth resolution (at expense of the azimuth coverage). In such configuration the ac-quisition is performed in frame mode, hence it is limited in the azimuth direction due to the technical constraints deriving from
22 SAR: Synthetic Aperture Radar
the azimuth antenna pointing. The implementation allowed for this acquisition mode is the Enhanced Spotlight. In the Enhanced Spotlight mode, the spot extension is achieved by a antenna elec-tronic steering scheme requiring the centre of the beam steering to be located beyond the centre of the imaged spot, thus increasing the observed Doppler bandwidth for each target
• Stripmap Mode, which is the most common imaging mode (e.g. sim-ilar to ERS mission one), obtained by pointing the antenna along a fixed direction with respect to the flight platform path. The an-tenna footprint covers a strip on the illuminated surfaces as the platform moves and the system operates. The acquisition is virtu-ally unlimited in the azimuth direction, except for the limitations deriving from the SAR instrument duty cycle
• ScanSAR Mode, which allows larger swath in range with respect to the Stripmap one, but with a less spatial resolution, obtained by periodically stepping the antenna beam to neighbouring sub-swaths. Since only a part of the synthetic antenna length is avail-able in azimuth, the azimuth resolution is hence reduced. In such configuration the acquisition is performed in adjacent strip mode, hence it is virtually unlimited in the azimuth direction, but for the limitations deriving from the SAR instrument duty cycle
2.2 SAR effects
2.2.1 Radar geometric distortions
The SAR system measures the time delay between transmission and re-ception of a pulse in order to determine where targets are relative to one another in the range direction. Consequently, the SAR systems are range-based. This leads to geometric distortions due to relief
displace-2.2 SAR effects 23
ment, such as foreshortening, layover, shadow, that decrease the reliabil-ity of radar imageries (see Fig. 2.7).
Fig. 2.7 – Radar geometric distortions: foreshortening, layover and shadow
Consider the mountain as sketched in the Fig. 2.8.
Fig. 2.8 – Foreshortening [5]
Points A, B and C are equally spaced when vertically projected on the ground (as it is done in conventional cartography). However, the distance A′B′ is considerably shortened compared to B′C′, because the
top of the mountain is relatively close to the SAR sensor. Also note that BC, the backslope becoming B′C′ is consequently stretched. Foreshort-ening is a quite common effect in SAR images of mountainous areas.
24 SAR: Synthetic Aperture Radar
Especially in the case of steep-looking spaceborne sensors, the across-track slant-range differences between two points located on foreslopes of mountains are smaller than they would be in flat areas. This effect results in an across-track compression of the radiometric information backscat-tered from foreslope areas which may be compensated during the geocod-ing process if a terrain model is available. Foreshortengeocod-ing is obvious in mountainous areas (top left corner), where the mountains seem to ’lean’ towards the sensor. Foreshortening effects are greatest in the near range (closer to the transmitter and receiver) and less pronounced in the far range. The lighter edges are the slopes facing the radar system. The narrow bright slopes (AB) illustrate increased compression in the near range.
If, in the case of a very steep slope, targets in the valley points of mountains have a larger slant range than the mountain top, then the foreslope is reversed in the slant range image (see Fig. 2.9). This
phe-Fig. 2.9 – Layover in case of very steep slope [3]
nomenon is called layover: the ordering of surface elements on the radar image is the reverse of the ordering on the ground. Generally, these lay-over zones, facing radar illumination, appear as bright features on the image due to the low incidence angle. Ambiguity occurs between targets hit in the valley and in the foreslope of the mountain, in case they have the same slant-range distance. For steep incidence angles this might also
2.2 SAR effects 25
include targets on the backslope. Geocoding cannot resolve the ambi-guities due to the representation of several points on the ground by one single point on the image; these zones also appear bright on the geocoded image. In built-up areas this phenomenon occurs at locations with steep elevation gradient facing towards the sensor, e.g. tall buildings. In Fig. 2.10a the layover effect is represented: different backscatters, e.g. the roof, the wall and the ground, are imaged in the same resolution cell. This causes a scattering ambiguity problem along the vertical direction that, generally, can be solved by SAR tomographic techniques (see chap-ter 4). An example of the layover effect is depicted in Fig. 2.10b where the well-known Tour Eiffel (captured by the satellite TerraSAR-X) is im-aged ’laying down’ onto the ground along the range direction (one may also note the Tower’s shadow over the bottom of the figure).
(a) (b)
Fig. 2.10 – (a) Layover and shadow phenomena in built-up areas; (b) TerraSAR-X image captured in Spotlight mode (image taken from [7])
A slope away from the radar illumination with an angle that is steeper than the sensor depression angle causes radar shadows (see Fig. 2.10a and Fig. 2.11).
26 SAR: Synthetic Aperture Radar
Fig. 2.11 – Shadow [3]
Shadow regions appear as dark (zero signal) with any changes due solely to system noise, sidelobes, and other effects normally of small importance. It should be also noted that the radar shadows of two objects of the same height are longer in the far range than in the near range.
2.2.2 Speckle noise
Speckle is a granular noise (see Fig. 2.12a) that inherently exists in all types of coherent imaging systems such as SAR imagery. This extremely complex pattern bears no obvious relationship to the macroscopic prop-erties of the object illuminated. Rather it appears chaotic and unordered, and is best described quantitatively by the methods of probability and statistics [66]. Unlike system noise (additive noise), speckle is an electro-magnetic effect. Considering its statistical fluctuations, speckle may be modeled by a multiplicative gaussian noise in SAR images. It is coherent interference of waves scattered from terrain elements observed in each resolution cell. The vast majority of surfaces, synthetic or natural, are extremely rough on the scale of an optical wavelength [28]. Under illumi-nation by coherent light, the wave reflected from such a surface consists of contributions from many independent scattering areas. Propagation of this reflected light to a distant observation point results in the addition
2.2 SAR effects 27
of these various scattered components with relative delays which may vary from several to many wavelengths, depending on the microscopic surface and the geometry. Consequently, when illuminated by the SAR, each target contributes backscatter energy which, along with phase and power changes, is then coherently summed for all scatterers, so called random-walk (see Fig. 2.12b). The SAR focusing operation coherently combines the received signals to form the image. The scattered wave phase addition results in both constructive and destructive interference of individual scattered returns and randomly modulates the strength of the signal in each resolution cell.
The presence of speckle in an image reduces the resolution of the image
(a) Typical speckle pattern (b) Random-walk of several scatters
Fig. 2.12 – Speckle effects
and the detectability of the target. The ideal speckle reduction filter should reduce speckle with minimum loss of information as in homoge-neous area, preserving radiometric information and edges between differ-ent areas, as in textured areas, preserving radiometric information and spatial signal variability. Reducing the effect of speckle noise enhances radiometric resolution (better discrimination of scene targets and eas-ier automatic image segmentation) at the expense of spatial resolution. Most of speckle reduction techniques have been studied by researchers, and the filtering is one of the common methods which is used to reduce the speckle noises. The process used to apply filters to an image is known
28 SAR: Synthetic Aperture Radar
as convolution, and may be applied in either the spatial [44, 42, 38] or frequency domain [68, 36].
The influence of the preprocessing speckle filtering algorithms on the DSM generation has been taken into account, e.g., in [43, 52, 64]. More thoroughly, in [52] its impact within the radargrammetric SAR process-ing chain (see section 3.1) has been studied considerprocess-ing the possibility to identify a greater number of homologous points characterised by a bet-ter Root Mean Square Error (RMSE) value. The work has led to infer that the speckle filtering algorithms allow to match a greater number of points, unfortunately characterizing by a lower accuracy value. This is caused by the presence of low accuracy points that alter the data and the final results. Furthermore, the relationship between the Signal to Noise Ratio (SNR) signal value and the elevation data statistics has been un-derlined, introducing the concept that the low accuracy points could be discarded by dynamically changing the SNR threshold value during the image matching procedure (see 3.1).
2.3 SAR platforms: TerraSAR-X
Sensors based in space are used for Earth observation, be it for research into the alterations taking place in our atmosphere, for climate research, for the monitoring of processes in our oceans, for geological investiga-tions, and much more besides. Remote sensing data obtained from space thus complement and complete Earth-based measurements. They are al-ways essential if a global view of our Earth is required, as is the case, for example, with the weather, or with the monitoring of the polar ice caps. With the TerraSAR-X radar satellite, the land masses of the Earth are particularly closely inspected. This includes the mapping of our forests, the generation and current updating of land utilization maps, the record-ing of derelict land areas and the estimation of the maturity level of areas in agricultural use, as well as the study and monitoring of geologically
2.3 SAR platforms: TerraSAR-X 29
active areas such as volcanic and earthquake regions. With the increasing technical capability of these sensors this kind of data can be extracted from satellites with ever more precision.
TerraSAR-X is Germany’s first national remote sensing satellite that has been implemented in a public-private partnership between the Ger-man Aerospace Center (DLR) and EADS Astrium GmbH, with a signifi-cant financial participation from the industrial partner. It is designed to satisfy the steadily growing demand of the private sector for remote sens-ing data in the commercial market. As mentioned, TerraSAR-X products can be used for a variety of applications. Moreover, the first experimen-tal data acquisitions have been successfully completed, among them data takes in the so-called Dual-Receive Antenna Mode, which allows motion measurements as well as fully polarimetric data acquisitions. In addi-tion, the so-called TOPS-Mode could be demonstrated for the first time, a new method for imaging particularly wide swathes with high quality.
Today it is difficult to imagine our life without satellites. Whether the daily weather report using meteorological satellites, the live transmis-sion of an ongoing event from remote areas using modern communication satellites or the navigation of ships on the world’s oceans by means of global positioning satellites: these services that in recent times have be-come part of our daily life are only possible thanks to technologically advanced missions operating in space.
With TerraSAR-X it is used the Synthetic Aperture Radar sensor (see p. 15). This contributes significantly to the reliability of the system, a property that is increasingly requested by many users, since data are often required at a certain point in time. Today, these kinds of capabil-ities are no longer just of interest for scientific applications; such data are also being asked for increasingly on the commercial market. This is the reason why TerraSAR-X, Germany’s first national remote sensing satellite, has been implemented in a so-called public-private partnership between the German Aerospace Center and EADS Astrium GmbH.
30 SAR: Synthetic Aperture Radar
The different kinds of imagery which can be acquired by TERRASAR-X are the following one [6]:
• Staring SpotLight (ST): 0.6x0.24 m rg/az resolution, 4x3.7 km rg/az scene size
• HighRes SpotLight 300 MHz (HS300): 0.6x1.1 m rg/az resolution, 10x5 km rg/az scene size
• HighRes SpotLight (HS): up to 1.2x1.1 m rg/az resolution, 10x5 km rg/az scene size
• SpotLight (SL): up to 1.2x1.7 m rg/az resolution, 10x10 km rg/az scene size
• StripMap (SM): up to 1.2x3.3 m rg/az resolution, 30x50 km rg/az scene size
• ScanSAR (SC): 1.2x18.5 m rg/az resolution, 100x150 km rg/az scene size
• Wide ScanSAR (WS): up to 1.7x40 m rg/az resolution, 270x200 km rg/az scene size
In Table 2.2 are showed the main TerraSAR-X technical data. The TerraSAR-X satellite pictorial representation is given in Fig. 2.13.
The data recorded by the SAR instrument are transferred via a down-link antenna to the ground receiving station. The antenna is secured to a 3.3 meters long mast in order to avoid interferences caused by the radar antenna. The mast is folded up during the launch and is only extended after positioning of the satellite into its orbit. It allows simultaneous ac-quisition of new data by the radar and transmission of previously stored data to the ground. The high accuracy position control of the satellite is implemented by means of star sensors that are installed near the radar antenna, so that the required high accuracy of the antenna alignment of
2.3 SAR platforms: TerraSAR-X 31
Operational life 5+5 years (DLR expectation: beyond 2018)
Launch date 15 June 2007, 4:14 CEST
Launch site Baikonur, Kazakhstan
Antenna size 4.788 m x 0.7 m
Launch mass 1230 kg
Payload mass ∼400 kg
Radar frequency 9.65 GHz (X band)
Power consumption 800 W (on average)
Repeat Period 2.5-11 days (depending on the imaging mode)
Orbital altitude 514 km
Inclination 97.44°
Nominal acquisition direction Right side
Polarisation Single, dual (depending on imaging mode) Table 2.2 – TerraSAR-X technical data
65 arcsecs can be achieved. A Global Positioning System (GPS) receiver located on board enables a precise determination of the orbit. The pri-mary payload is a Synthetic Aperture Radar with an active antenna that allows for the utilization of different imaging modes and can be used in a very flexible manner. With radar instruments various frequency ranges of the radar spectrum can be observed, the so-called bands. TerraSAR-X is operated in the TerraSAR-X-band, which is lying at a frequency around 9.65 GHz, corresponding to a wavelength of about 3 centimetres. The tech-nology of the active, phase-controlled antenna enables a high flexibility and mission efficiency. While in case of passive systems the whole radar antenna or even the satellite must be rotated in order to align the an-tenna onto the target area, the active anan-tenna of TerraSAR-X can steer its radar pulses in a certain direction. The antenna is 4.80 meters long and 80 centimetres wide. The satellite is designed in a way that it can be installed, together with its antenna at its full size, on the launch vehicle. In this way a complex unfolding mechanism can be avoided.
Alongside the SAR instrument two secondary payloads are flying on TerraSAR-X:
32 SAR: Synthetic Aperture Radar
Fig. 2.13 – TerraSAR-X satellite
1. The Laser Communication Terminal (LCT): a technology demon-strator that is used for in-orbit verification of rapid optical data transfer in space. Moreover, data could be successfully transmit-ted to a ground station. Later on, it will be possible to transmit large quantities of data operationally to the ground by means of this new type of laser system. This technology basically enables an extremely rapid data exchange via relay stations around the world. 2. The Tracking, Occultation and Ranging Experiment (TOR): con-sists of the IGOR dual frequency GPS receiver together with a laser reflector unit. IGOR allows a highly accurate determination of the satellite orbit with an accuracy of up to just a few centimetres, which enhances the quality of the radar images. IGOR is also used to conduct radio occultation measurements in the atmosphere and the ionosphere. Here IGOR records the signals of the GPS satellites that are appearing or disappearing on the Earth’s horizon.
Evaluation of these measurements allows conclusions to be drawn concerning pressure, temperature, water vapour content, and electron density in the atmosphere, which can be used, for example, in the im-provement of numerical weather models, or investigations into climate
2.3 SAR platforms: TerraSAR-X 33
change. With the laser reflector unit it is possible by means of a laser measuring network installed on the Earth to measure the exact distance of the satellite to the individual receiving stations, which similarly sup-ports an exact determination of the orbit.
Chapter 3
3-D SAR imaging
Due to the specific SAR geometry, SAR imaging represents a projection of the 3D space (x, y, z) into the bi-dimensional (2D) cylindrical zero-Doppler coordinates (x, r). For each pixel of a SAR image, the scattering response consists of a sum of contributions from all scatterers at the same range, encompassing all heights. Hence information about the vertical structure is lost. To recover such information, 3-D imaging techniques are required, whose derived secondary products consists in Digital Eleva-tion Model (DEM), i.e. data files that contain informaEleva-tion on the spatial distribution of the elevation data over a specified area. In particular, one may distinguish between DSM, representation of the first reflective or visible surface (including trees, buildings, and any other features which is elevated above the ground), and Digital Terrain Model (DTM), repre-sentation of the bare terrain (without objects).
In the following sections we present the basis of three 3-D imaging tech-niques: (i)Radargrammetric SAR (StereoSAR) [46] and (ii)Interferometric SAR (InSAR) [29], both based on the use of two complex-valued radar images acquired from, respectively, different and slightly different point of view, and (iii)Tomographic SAR (TomoSAR) [56], evolution of (ii) and based on the use of more than two SAR acquisitions performed in interferometric configuration.
36 3-D SAR imaging
3.1 Radargrammetric SAR
Radargrammetry was first employed in the 1950s with ground and air-borne radar, then less and less, due to the quite low amplitude resolution of radar satellite imagery and, consequently, the high loss in term of accu-racy [41]. Only within the last decade, thanks to the very high resolution imagery acquired by new satellite sensors, as COSMOSkyMed (Italian), TerraSAR-X (German) and RADARSAT-2 (Canadian), which are able to supply imagery with 1 m GSD, the radargrammetric approach has been revitalized and investigations restarted [11, 48, 50, 63]. A comprehensive text on radargrammetry is [41].
Analogous to optical photogrammetry, radargrammetry is based (at least) on a stereopair that must be acquired under a suited geometric configuration. This technique exploits only the amplitude information from SAR imagery and coherence between images is not required. Re-spect to InSAR, the independence from the coherence is one of the main advantages of StereoSAR, especially from the point of view of the strong influence of the land cover and the atmospheric effects. Basically, at-mospheric effects on the SAR imagery are same in the StereoSAR or in the InSAR processing. However, as mentioned, StereoSAR uses the magnitude (intensity) value whereas InSAR uses the phase difference in SAR imagery. Considerably, magnitude is less affected than phase by atmospheric heterogeneity. Hence, the atmospheric disturbance is unde-sirable for the interferometric processing but not much of a concern for the radargrammetric one.
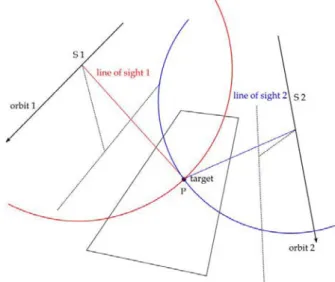
The radargrammetric approach performs a 3-D reconstruction based on the determination of the sensor-object stereo model for which the position of each point on the object is computed as the intersection of two radar rays coming from different positions and, therefore, with two different look angles (Fig. 3.1). Radargrammetry is based on stereogram-metry, which is a classical method for relief reconstruction using optical
3.1 Radargrammetric SAR 37
remote sensing images. Stereo viewing reproduces the natural process of stereovision. As for photogrammetry, two steps are required for DSM generation: stereopair orientation and image matching for point cloud generation. In [12] a complete procedure for generating radargrammetric DSMs is proposed.
In the context of the orientation models for the stereo pair, two main
Fig. 3.1 – StereoSAR acquisition system in zero Doppler geometry
kinds of models are adopted: the physical sensor models (also called rig-orous models) and the generalized sensor models. In the first one, in case of SAR imagery, the image and the ground coordinates are linked through the radargrammetric equations (similarly to collinearity equations in pho-togrammetric approach) and the involved parameters have a physical meaning. Besides, they require knowledge on the specific satellite and orbit characteristics. On the contrary, the generalized models are usually based on the Rational Polynomial Functions (RPFs), which link image and terrain coordinates by the Rational Polynomial Coefficients (RPCs) and do not need the knowledge about the sensor and acquisition features. The RPCs can be calculated by the final users via a Least-Squares (LS)
38 3-D SAR imaging
estimation directly from Ground Control Points (GCPs), or proprietarily generated by the sensor managing companies based on their own phys-ical sensor models and distributed to users through imagery metadata. Nevertheless, the first strategy (also called terrain-dependent) is not rec-ommended if a reliable and accurate orientation is required. In the second strategy, they can be generated according to a terrain-independent sce-nario, using known physical sensor.
In [13], following from [41], is proposed a model based on two fundamen-tal equations: the first equation of (3.1) represents the general case of zero-Doppler projection: in zero-Doppler geometry the target is acquired on a heading that is perpendicular to the flying direction of satellite; the second equation of (3.1) is the slant range constrain.
���� ���� � VXS⋅ (XS− XP) + VY S⋅ (YS− YP) + VZS⋅ (ZS− ZP) = 0 � (XS− XP)2+ (YS− YP)2+ (ZS− ZP)2− (DS+ CS ⋅ I) = 0 (3.1) XP, YP, ZP are the coordinates of the generic Ground Point (GP) in
a terrestrial coordinate system (time independent); XS, YS, ZS are the
coordinates of the satellite sensor in the same coordinate system (time dependent); VXS, VY S, VZS are the cartesian components of the satellite
sensor velocity again in the same coordinate system (time dependent); DS is the so-called near range, a parameter related to the range
measure-ments whose initial value is available in the metadata; CS is the slant range resolution or column spacing; I is the column position of point P on the image. The orbital arc related to an image acquisition in Spot-Light mode, since quite short (about 10 km), is conveniently interpolated with Lagrange polynomial using the orbital state vectors available in the metadata. In this way, it is possible to model the images acquisition and the stereo orientation through metadata parameters.
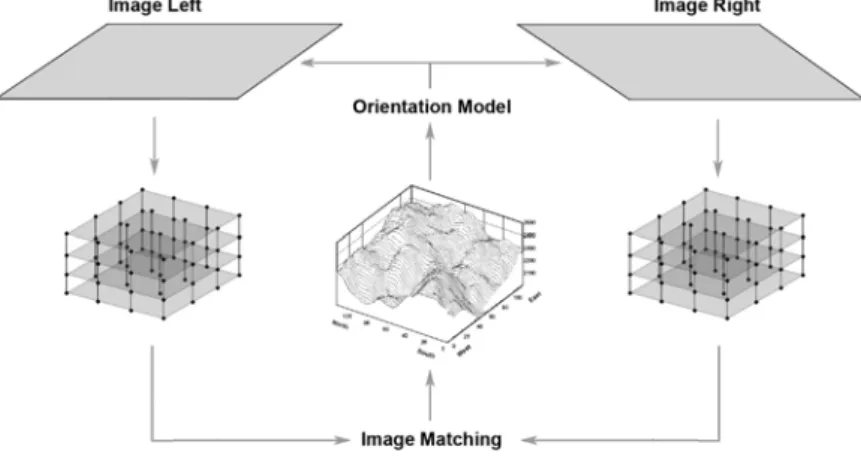
The image matching process heavily impacts the DSM accuracy, and its efficiency depends on the configuration for the radargrammetric
appli-3.1 Radargrammetric SAR 39
cation. Observing the target in opposite-site view allows to obtain a good stereo geometry, but causes large geometric and radiometric disparities that hinder image matching. Thus, in order to increase the efficiency, a good compromise is to use a same-side configuration stereo-pair with a base to height ratio ranging from 0.25 to 2 [46]; ; anyway, it is better to limit within 0.35 and 0.70. Two are the main steps of image matching process: the definition of a matching entity, that is a primitive in the master image to be compared with a portion of other slave images, in order to identify correspondences among them; the selection of a search criteria in order to limit the possible solutions and to avoid mismatching. In [49] an original matching procedure is proposed. The matching strategy is based on a coarse-to-fine hierarchical solution with an effec-tive combination of geometrical constrains and an Area Based Matching (ABM) algorithm, using a pyramidal approach and analysing the SNR. In this way the surface model is successively refined step by step, until the last step (corresponding to the original image resolution) where the final dense and accurarate DSM is reconstructed (see Fig. 3.2).

![Fig. 2.8 – Foreshortening [5]](https://thumb-eu.123doks.com/thumbv2/123doknet/8004106.268253/46.892.218.664.645.859/fig-foreshortening.webp)
![Fig. 2.11 – Shadow [3]](https://thumb-eu.123doks.com/thumbv2/123doknet/8004106.268253/49.892.232.669.214.426/fig-shadow.webp)