HAL Id: hal-01008335
https://hal.archives-ouvertes.fr/hal-01008335
Submitted on 5 Jun 2018Influence of the loading conditions on fatigue properties
for filled elastomers
Pierre Charrier, Elisabeth Ostoja-Kuczynski, Erwan Verron, Laurent Gornet,
Grégory Chagnon
To cite this version:
Pierre Charrier, Elisabeth Ostoja-Kuczynski, Erwan Verron, Laurent Gornet, Grégory Chagnon. In-fluence of the loading conditions on fatigue properties for filled elastomers. International Rubber Conference, 2002, Prague, Czech Republic. �hal-01008335�
INFLUENCE OF LOADING CONDITIONS ON FATIGUE PROPERTIES
FOR FILLED ELASTOMERS
Pierre Charrier1, Elisabeth Ostoja-Kuczynski1, Erwan Verron2, Laurent Gornet2 and Grégory Chagnon2
1 Trelleborg - Modyn
Research and Innovation Department Zone Industrielle Nantes Carquefou
BP 419
44474 Carquefou cedex, France
2 Laboratoire de Mécanique et Matériaux – Division Structures Ecole Centrale de Nantes
BP 92101
44072 Nantes cedex 03, France
ABSTRACT
Fatigue characterisation of elastomers is an essential prerequisite of new car project schedules imposed by carmakers. Consequently, durability prediction softwares are needed to reduce the time allowed to design elastomeric parts. Until now, the only theoretical variable used to predict duration life is the tearing energy proposed by Rivlin and Thomas. Classically, fatigue properties are determined using plane stress experiments (trousers or pure shear samples for example) under simple loading conditions.
In the present paper, a brief bibliographical review presents the limitations of this approach and the need of more complex loading conditions is emphasised. Then, a new simple shear sample is proposed to simplify the treatment of experimental results, said the calculation of the tearing energy, under complex loading conditions. The test sample is initially notched and is submitted to controlled displacement loading conditions. The procedure adopted to analyse the results is presented. Assuming that the tearing energy and the crack growth rate remain constant during the test, they can be easily calculated using both the decreasing stiffness of the sample during the test and a FE model. Note that no complex system, such as video recording, is necessary to measure the crack length. Then, experimental results are reported. Both filled crystallising and non-crystallising elastomers are studied in order to highlight the influence of the testing temperature and of the imposed displacement ratio (i.e.: minimum/maximum displacement) on the fatigue crack growth rate law. This fatigue crack growth rate law obtained agrees well with previously published papers. Furthermore, other complex tests are in progress to determine the influence of the Mullins stress-softening on fatigue properties. Finally, in regards with these results, it is demonstrated that the tearing energy is not a sufficient variable to completely characterise the fatigue life of elastomers.
1 INTRODUCTION
Tires manufacturers have studied the durability of elastomers for more than 60 years. Numerous scientific papers induced the definition of a well-adapted criterion for this type of industrial applications: the tearing energy T. Moreover, a large experimental data bank is available, but most experiments are restricted to plane stress test samples under simple loading conditions. Automotive anti-vibration system (AVS) companies have now a great interest in elastomers durability. However, the corresponding industrial components and loading conditions are greatly different than those involved in tires industry. Indeed, the loading conditions are close to the state of plane strain and loading histories are more complex: they include variable pre-loading, non-relaxing conditions… In order to investigate the durability of elastomers in AVS applications, it is necessary to determine the limitations of the tearing energy criterion to ensure that its use for AVS products is well-adapted. Second, new test sample geometries have to be defined to reproduce the local stress state encountered in these applications.
In the first part of the present paper, limitations of the tearing energy T are investigated. More precisely, the assumptions that were made by Rivlin and Thomas to define T, the effect of pre-loadings (maintained or not) and the limitations due to the elastic nature of T are thoroughly examined. In a second part, a new test sample geometry is presented. This new sample provides plane strain conditions and could be used to study the influence of loading history, and especially of non-relaxing conditions. The corresponding experimental methodology, said the determination of T and the measurement of the crack propagation, is described in details. More precisely, although the crack growth measurement is easily performed for thin rubber sheets [GEN64], in the present case of a massive rubber block, it is more difficult to determine the crack length. So, a new method for the crack growth measurement is proposed. It is based on the determination of the global stiffness of the sample. Note that the present experimental approach does not need any video equipment to measure the crack propagation. Finally, first experimental results under different temperatures and pre-loading conditions are presented. Two filled materials are considered: a NR that exhibits strain crystallisation and a PU that does not
2 THEORETICAL
FRAMEWORK
2.1 DEFINITION OF THE TEARING ENERGYIn order to study the fracture mechanics of rubber-like materials, the first step consists in defining a failure criterion.
Opposite to metallic materials, present geometric and material non-linearities do not permit the use of simple criteria based on the stresses, because the stress state can not be simply calculated analytically. Rivlin and Thomas [RIV53] proposed an energetic failure criterion: the tearing energy T. This approach can be seen as the extension of Griffith’s theory [GRI20] to rubber-like materials. The corresponding crack propagation criterion can be written as:
(
)
c extT
A
W
W
T
≥
∂
−
∂
=
,where Tc is the critical value of the tearing energy at the failure point, W is the stored elastic energy, Wext represents the work of external forces and A stands for the crack area. Under constant displacement loading conditions, the work of external forces is equal to zero and the previous equation becomes:
c l
T
c
W
t
T
≥
∂
∂
−
=
1
in which t is the thickness of the sample and c is the crack length. This definition of the tearing energy is widely used in the bibliography. It is to note that the Griffith’s criterion, that is the basis of the definition of T, considers that the decrease of the stored elastic energy during the crack growth is only balanced by the energy dissipated in the crack front during propagation. Nevertheless, in the case of elastomeric materials, the decrease of the stored elastic energy is balanced by both the energy dissipated in the new crack area and by other dissipated energies that are due to the material behaviour (e.g. Mullins effect, viscoelasticity, strain-crystallisation).
Consider now the tearing of thin sheets and let us examine the assumptions of Rivlin and Thomas in order to determine if it is possible to consider the previous definition of T relevant in that special case. According to the authors, the energy dissipated in the volume of the sample, far from the crack front, can be neglected in the case of low dissipative materials. This is not the case of dissipation phenomena that occur in the neighbourhood of the crack front. In this area, the strain magnitude is higher and the stress state is more complex (anisotropic, viscoelastic, compressible…) than in the rest of the sample, said far from the crack. Rivlin and Thomas assume that these locally dissipated energies remain proportional to the crack propagation dc and to geometric characteristics of the crack front. They concluded that the energy required to propagate the crack of a length dc does not substantially depend on the sample geometry and on the way loading conditions are applied. Consequently, this energy, classically measured during experiments, only characterises the tearing of thin sheets and includes both the tearing energy T and the energy dissipated in the crack front.
2.2 CLASSICAL TEST SAMPLES
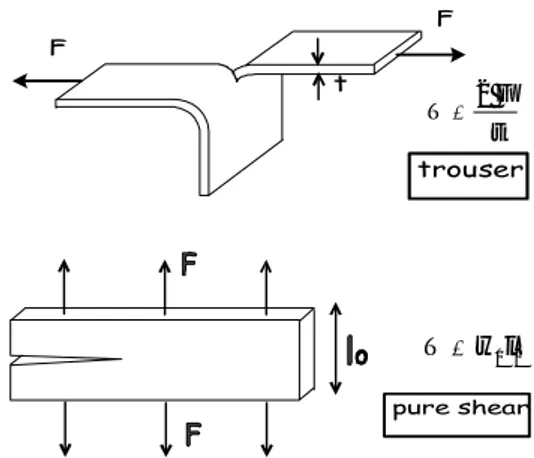
In order to study the crack propagation in elastomeric materials, Rivlin and Thomas proposed three different geometries for the test samples. Every samples are thin sheets in plane stress conditions close to the crack front. These three samples are the tensile test sample, the trouser sample and the pure shear sample; they are presented in Figure 1. They have been widely used in the papers dealing with the durability of elastomers.
F t F t F T= 2 trouser c F F
( )
0 2k cw T = λ tensile 0 0l w T = pure shearFigure 1: thin sheet test samples 2.3 LIMITS TO THE USE OF T
Before using the tearing energy for samples that are different than thin sheets, we have to review the experimental and theoretical limits of the tearing energy defined above, as already highlighted in literature.
First, strictly regarding to the definition of T, the experimental procedures proposed in literature are not well-adapted to its measurement. Indeed, during experiments, it is not possible to separate the energy used for the propagation of the crack area, said the tearing energy, from other energies that are dissipated both in the volume and in the neighbourhood of the crack front. Only a global value of the dissipated energy can be obtained. Moreover, the tearing energy as defined by Rivlin and Thomas is a purely elastic parameter. It does not take into account the complex behaviour of elastomers that includes strain-softening, viscoelasticity ... Gent and Kim proposed a new experimental definition of T that partially overcomes this difficulty [GEN78]. To take into consideration the hysteresis of the material under cyclic loading, they determine the tearing energy using the elastic energy restored during the unloading part of the cycle and not the elastic energy that is stored during the loading part. Finally, the bibliography exhibits different experimental results which prove that
T is not an intrinsic parameter, said it can not be used as a criterion. This is the case of
Thomas who demonstrates that the critical tearing energy Tc is modified by cyclic loadings of the test sample [THO58]: the material is strengthened during this cyclic loading. The works of Gent and Kim under static conditions [GEN78] and of Busfield et al. under cyclic conditions [BUS96] highlight the effect of pre-loading on the tearing energy. In the case of pure shear test samples, the authors show that a pre-loading parallel to the crack weakens the material, said the corresponding critical tearing energy is divided by 25. These results demonstrate that the tearing energy is not an appropriate parameter to characterise the durability properties of elastomeric materials.
3 DEFINITION OF A NEW TEST SAMPLE
3.1 GEOMETRY OF THE SAMPLEAs mentioned above, classical test samples used to study the crack propagation in elastomeric materials are considered under plane stress conditions. So, they can not be used to study the local stress state encountered in AVS components. In order to reproduce the plane strain conditions, we should consider test samples under plane strain conditions. This consideration has led us to a new design of samples.
Lindley et al. ([LIN77,LIN79,LIN82]) provide the methods needed to calculate T for elastomeric blocks in which a crack propagates at the interface between the material and a rigid insert. Using their results, we consider a “2 blocks - simple shear sample” with a pre-cut at the interface elastomer/insert. Figure 2 presents this sample. As proposed in the previous cited papers, both the block width and the crack length are at least twice larger than the block thickness. Moreover, using a well-defined pre-cut length, our new sample can be used for crack propagation experiments in which the tearing energy and the crack growth rate remain constant when the crack propagates.
∆∆∆∆L ∆∆∆∆L
lc
b
ep c0
Figure 2 : Design of our new sample 3.2 DETERMINATION OF THE TEARING ENERGY
The determination of the tearing energy that corresponds to an elastomeric block under enforced displacement is directly based on the definition of Rivlin and Thomas:
l elas
c
W
b
T
∂
∂
−
=
1
,where b is the block width and Welast is the elastic energy stored in the sample. This elastic energy is calculated assuming that the material behaviour is linear under simple shear loading. Denoting Lmax and the maximum enforced displacement and resulting force,
respectively , the maximum tearing energy obtained during the test is denoted Tmax and can
be written as:
c
F
b
L
T
∂
∂
=
max max max2
In regards with this equation, the maximum tearing energy only depends on experimental parameters (
L
max/
2
b
) and on the global stiffness of the sample that is a function of the crack length (∂
F
max/
∂
c
). In the present work, this global stiffness is determined by a finite element analysis. The rubber block is modelled under plane strain conditions and simple shear experiments are simulated using the software ABAQUS. For a given value of the crack length increment, said dc, the crack propagation effect on the global stiffness is determined by performing computations on samples in which the crack length value is set to c, c+dc,c+2dc, …. For the simulations, the material behaviour is modelled by the nearly
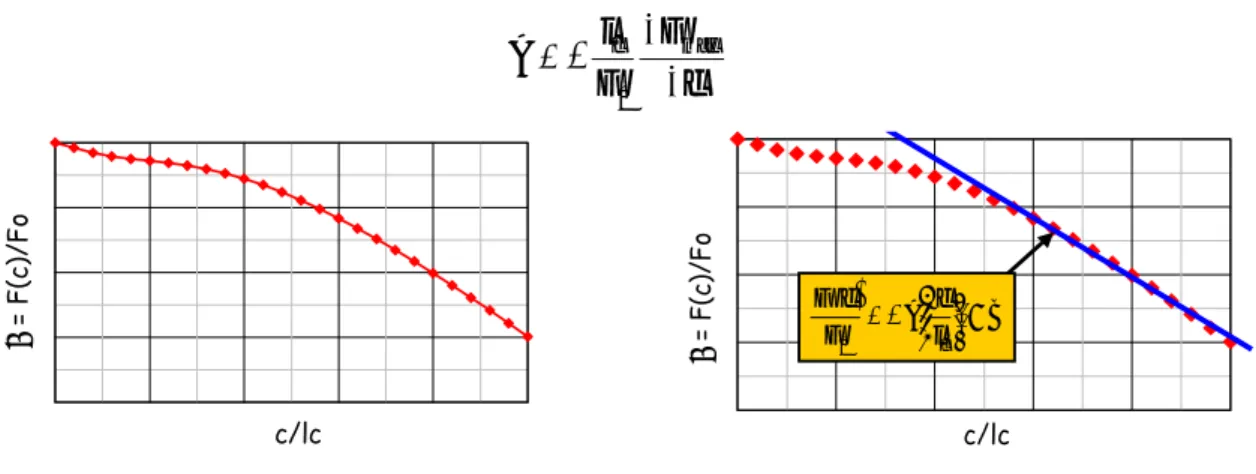
The results of these simulations can be summarised by the curve of the resulting force versus the crack length. More precisely, we consider non-dimensional variables, said the non-dimensional resulting force F/F0, where F0 is the resulting force obtained for the block
without pre-cut, and the non-dimensional crack length c/ lc where lc is the sample length. The corresponding curve is presented in Figure 3. As shown in this figure, the curve can be fitted by a linear equation for sufficiently large values of the crack length. The fitting results are shown in Figure 3. The slope of the line is denoted A and given by:
c
F
F
l
A
c∂
∂
−
=
max 0 c/lc α = F(c)/Fo c/lc α = F(c)/Fo ( ) B l c A F c F c + − = 0Figure 3 : resulting force versus crack length. Figure 4 : linear fit.
Using this new parameter, the maximum tearing energy can be written as:
c
l
b
F
L
A
T
⋅
⋅
⋅
=
2
0 max maxThis equation expresses that Tmax is a function of experimental parameters and of the
resulting force of a block without pre-cut F0. As this force can be related to the resulting force
FC0 (corresponding to a pre-cut block) by a constant parameter 1/α as shown in Figure 3, the
maximum tearing energy only depends on experimental parameters:
c c
l
b
F
L
A
T
⋅
⋅
⋅
=
2
0 max maxα
where b and lc describe the geometry of the sample, Lmax is the enforced displacement and
Fc0 is the resulting force corresponding to the accommodated sample without crack propagation.
The method adopted for the determination of Tmax presents a major limitation. The pre-cut
length and the crack length considered during the test should be chosen in order to ensure that the parameters A and α remain constant during the cyclic experiments.
Propagation direction Pre-cut co ∆c in the middle ∆c for the edge
Figure 5 : shape of the crack front for a sample under plane strain conditions
Figure 6 presents the evolution of the maximum and minimum forces obtained during a fatigue test under controlled displacement conditions.
number of cycles Force (N) effort mini effort maxi 1 2 3 F mini F maxi number of cycles Force (N) effort maxi Fc0 ∆Fmax/∆N =cte 2 F maxi
Figure 6 : evolution of the resulting forces during the fatigue tests
It is to note that the maximum force highly varies during the test, whereas the minimum force that corresponds to zero displacement remain almost constant. This could be simply explained. On one hand, the zero displacement configuration represents the closure of the crack; it can be concluded that the crack length has no effect on Fmini. On the other hand, the
curve of Fmaxi can be divided in three different parts, that correspond to three different
physical phenomena:
• The beginning of the curve (indexed 1 in Figure 6) shows a high decrease of the resulting force during approximately 1000 cycles. This decrease is a consequence of the dissipative nature of elastomers. It includes the accommodation to the Mullins effect, the viscoelasticity of the material and the stabilisation of the block temperature.
• The main part of the curve (indexed 2) corresponds to the crack propagation. The chosen geometry and the test conditions imposes that the tearing energy remain constant. So, the crack growth rate is also constant and the measured curve can be fitted by a linear equation. Its slope is equal to
∆
F
max∆
N
and its intersection with the force-axis is Fc0 (see Figure 6).• The last part of the curve (indexed 3) corresponds to the catastrophic crack propagation that takes place before the breakage of the sample.
Considering the previous remarks, the determination of the crack growth rate is quite easy. Indeed, the crack growth rate only depends on the slope of the experimental curve and on some parameters previously obtained by FE calculations:
n
F
AF
l
n
F
F
c
dn
dc
c∆
∆
=
∆
∆
∆
∆
=
max 0 max max4 EXPERIMENTAL
RESULTS
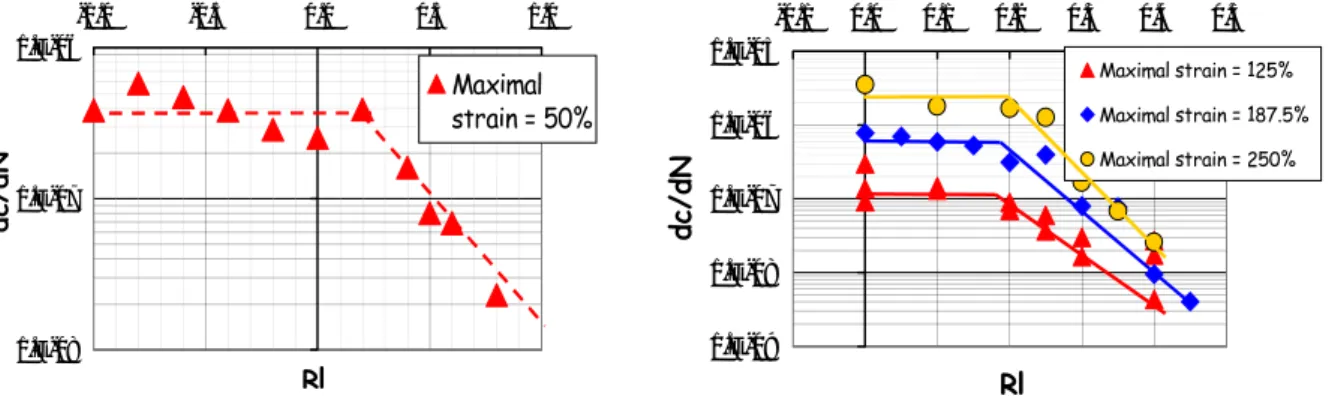
4.1 CRACK CLOSURE EFFECTExperiments under constant enforced maximal displacement were conducted to determine the influence of the minimal strain on the crack growth rate. Two materials were tested: a natural rubber (NR) which exhibits strain crystallisation effects and a polyurethane (PU) which does not. Experimental results are presented in Figure 7 for NR and in Figure 8 for PU. 1.E-08 1.E-07 1.E-06 -1.0 -0.5 0.0 0.5 1.0 Rl dc/dN Maximal strain = 50% 1.E-09 1.E-08 1.E-07 1.E-06 1.E-05 -0.1 0.0 0.1 0.2 0.3 0.4 0.5 Rl dc/dN Maximal strain = 125% Maximal strain = 187.5% Maximal strain = 250%
Figure 7 : influence of the minimal strain on the crack growth rate for PU
Figure 8 : influence of the minimal strain on the crack growth rate for NR
These figures present the influence of the displacement factor, said the ratio of the minimum on the maximum displacements of the loading cycle, on the crack growth rate. Moreover, as each curve stands for a constant value of the maximum displacement (or strain), the figures highlight the influence of the minimum enforced displacement on the crack growth rate. They demonstrate that the magnitude of the minimal enforced displacement has no influence on the crack growth rate as long as it remains lower than a threshold value. This threshold value corresponds to the special case of a loading cycle without compressive part. Above this threshold value, the crack growth rate significantly decreases as Rl increases. In regards with metallic material state of the art, this effect can be named the “crack closure effect”. In order to account of this effect, experimental results are not analyse considering the maximum tearing energy Tmax but the maximum amplitude of the tearing energy during the cycle
denoted ∆T and defined by:
∆T=Tmax–max(Tmin,0)
Finally, it is to note that the “crack closure effect” is not sensitive to the strain crystallisation.
remains constant for all values of Rl (see Figure 9 and Figure 10). It can be said that the material is reinforced whatever it crystallises or not.
-10,0 -9,0 -8,0 -7,0 -6,0 -5,0 2,25 2,75 3,25 Log ∆∆∆∆T (J/m²) Log dc/dn (m/cycles) Rl = -1 Rl = 0 Rl=0,75 -9,0 -8,0 -7,0 -6,0 2,5 2,75 3 3,25 3,5 Log ∆∆∆∆T (J/m²) Log dc/dn (m/cycles) Rl = 0 Rl = 0.25
Figure 9 : effect of non-relaxing conditions on
the crack growth rate law for PU Figure 10 : effect of non-relaxing conditions onthe crack growth rate law for NR
In conclusion of this study, we propose a first attempt to model the influence of non-relaxing conditions on the crack growth rate law. In order to develop our theory, the curves presented in Figure 8 are redrawn in a different way: for each value of the enforced displacement ratio, the corresponding crack growth rate is non-dimensionalised by the crack growth rate corresponding to Rl=0. Here, this method is only applied to NR and the corresponding master curve is presented in Figure 11.
1.E-03 1.E-02 1.E-01 1.E+00 1.E+01 -0.1 0.0 0.1 0.2 0.3 0.4 0.5 Rl dc/dn / (dc/dn) ref 125% 187.5% 250%
Figure 11 : master curve for the crack growth rate law under non-relaxing conditions. Case of NR
Finally, the crack growth rate law is approached by the following function:
( )
( )
>
+
×
+
×
=
<
=
⋅
⋅
=
d Lthreshool L L L L d Lthreshool L L LR
R
c
R
R
a
R
f
R
R
R
f
with
T
B
R
f
dn
dc
for
b
for
1
)
(
2 0 0 αThe corresponding fitted curve is shown in Figure 11.
4.3 INFLUENCE OF THE TEMPERATURE
Automotive AVS components are classically used at different temperatures in service conditions. Indeed, it is important to be able to quantify the temperature effect on the crack growth rate law. That is the reason why cyclic experiments were performed on both materials
at different temperatures. The crack growth rate laws are presented in Figure 12 for PU and in Figure 13 for NR. -10.0 -9.0 -8.0 -7.0 -6.0 -5.0 2 2.25 2.5 2.75 3 3.25 3.5 Log T (J/m²) Log dc/dn (m/cycles) -15°C 23°C 60°C -8.5 -8.0 -7.5 -7.0 -6.5 2.75 3.00 3.25 3.50 Log T (J/m²) Log dc/dn (m/cycles) 20° C 85°C
Figure 12 : crack growth rate law at different temperatures for PU
Figure 13 : crack growth rate law at different temperatures for NR
Examining the results and in accordance with previously published results, a major difference between the two materials can be observed:
• PU is very sensitive to the temperature: the crack growth rate law is shifted to higher values of dc/dn as the temperature increases (the material becomes stiffer as the temperature decreases).
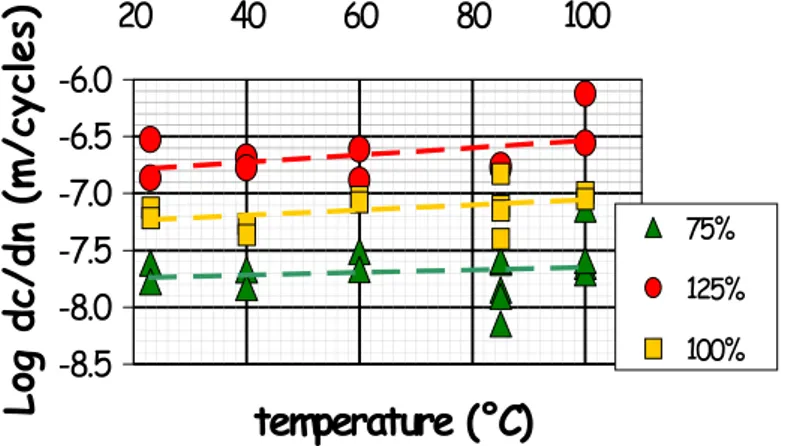
• NR results are more scattered but the material seems to be relatively insensitive to the temperature in comparison with PU, whatever the value of the enforced displacement. This observation is confirmed by Figure 14 in which the crack growth rate versus temperature curves are horizontal lines for each values of the enforced strain.
-8.5 -8.0 -7.5 -7.0 -6.5 -6.0 20 40 60 80 100
temperature (°C)
Log dc/dn (m/cycles)
75% 125% 100%5 CONCLUSION
The present work is the preliminary step of a wider experimental study on fatigue life of elastomers. The aim of this study consists partly in adapting the classical approach developed previously to investigate the crack propagation under simple loading conditions to the case of anti-vibration system parts.
In this paper, the limitations of the tearing energy as defined by Rivlin and Thomas were highlighted and a new experimental simple shear sample was presented. This sample reproduces plane strain conditions in the neighbourhood of the crack front and can be submitted to complex loading histories. Moreover, the methodology used to determine the crack growth rate was detailed. First experimental results on both PU and NR were thoroughly analysed and the corresponding crack growth rate laws were established. Moreover, the influence of the pre-loading conditions and of the temperature on this law was also considered. All of these results are in good agreement with previously published results and validate our new sample.
Further works are in progress and new experiments are planned in order to investigate the influence of the loading frequency and of ageing conditions on the fatigue life of elastomers. The next step of the study will be concerned with the effect of complex loading conditions (enforced force or enforced displacement, form of the cycle, sample accommodation…) on the crack growth rate law.
ACKNOWLEDGEMENTS
The authors acknowledge the CETIM Nantes for its participation in the study and more especially for the fractographic analysis of the broken samples.
BIBLIOGRAPHIC REFERENCES
[BUS96] Busfield J.J.C., Davises C.K.L and Thomas A.G. "Aspects of Fracture in Rubber Components", International Rubber Conference, Manchester, pp 191-207, 1996. [GEN64] Gent A. N., Lindley P. B. and Thomas A. G., “Cut Growth and Fatigue of Rubbers.
I. Relationship between Cut Growth and Fatigue”, J. Appl. Polym. Sci., Vol 8, pp. 455-466, 1964.
[GEN78] Gent A. N. and Kim H. J., « Tear Strength of Streched Rubber », Rubber Chem.
Technol., Vol 51, pp. 35-44, 1978.
[GRI20] Griffith A., « The Phenomena of Rupture and Flow in Solids », Phil. Trans. Roy.
Soc., Series A, Vol 221, pp. 163-199, 1920.
[LIN77] Lindley P. B. and Teo S. C., « Strain concentration factors for bonded rubber blocks with radiused fillet », Plastics and Rubber : Materials and Applications, pp. 152-158, 1977.
[LIN79] Lindley P. B. and Teo S. C, « Energy for crack growth at the bonds of Rubber Springs », Plastics and Rubber : Material and Applications, pp. 29-37, 1979. [LIN82] Lindley P. B. and Stevenson A., « Fatigue resistance of Natural Rubber in
compression », Rubber Chem. Technol., Vol 5, pp. 337-351, 1982.
[RIV53] Rivlin R. S. and Thomas A. G., « Rupture of Rubber. I. Characteristic Energy for Tearing ». J. Polym. Sci., Vol 10, pp. 291-318, 1953.
[THO58] Thomas A. G., « Rupture of Rubber. V. Cut growth in Natural Rubber Vucanizates », J. Polym. Sci., Vol XXXI, pp. 467-480, 1958.