OATAO is an open access repository that collects the work of Toulouse researchers and makes it freely available over the web where possible
Any correspondence concerning this service should be sent
to the repository administrator: [email protected]
This is an author’s version published in: http://oatao.univ-toulouse.fr/ 25326
To cite this version:
Fillieux, Caroline . Communautés de rongeurs et risque de
leptospirose selon un gradient de déforestation au Cambodge.
Thèse d'exercice, Médecine vétérinaire, Ecole Nationale Vétérinaire de Toulouse – ENVT, 2017, 110 p.
ANNEE 2017 THESE : 2017 – TOU 3 – 4110
COMMUNAUTES DE RONGEURS ET RISQUE DE
LEPTOSPIROSE SELON UN GRADIENT DE
DEFORESTATION AU CAMBODGE
_________________
THESE
pour obtenir le grade de DOCTEUR VETERINAIRE
DIPLOME D’ETAT
présentée et soutenue publiquement devant l’Université Paul-Sabatier de Toulouse
par
FILLIEUX Caroline
Née, le 26 septembre 1991 à CHATENAY-MALABRY (92) ___________
Directeur de thèse : M. Guillaume LE LOC'H
___________ JURY PRESIDENT : M. Gérard CAMPISTRON ASSESSEURS : M. Guillaume LE LOC'H M. Gilles MEYER
Professeur à l’Université Paul-Sabatier de TOULOUSE
Maître de Conférences à l’Ecole Nationale Vétérinaire de TOULOUSE Professeur à l’Ecole Nationale Vétérinaire de TOULOUSE
Répartition des Enseignants-Chercheurs par Département.
Mise à jour : 03/11/2017
DIRECTRICE:
I
SABELLE CHMITELINELEVAGEETPRODUITS/SANTE PUBLIQUEVETERINAIRE
SCIENCESBIOLOGIQUESET FONCTIONNELLES
SCIENCESCLINIQUESDESANIMAUX DECOMPAGNIE,DESPORTETDE
LOISIRS
Responsable : M. SANS ALIMENTATION ANIMALE :
M. ENJALBERT Francis, PR
Mme PRIYMENKO Nathalie, MC
Mme MEYNADIER Annabelle, MC
EPIDEMIOLOGIE : Mathilde PAUL, MC PARASITOLOGIE-ZOOLOGIE : M. FRANC Michel, PR M. JACQUIET Philippe, PR M. LIENARD Emmanuel, MC
Mme BOUHSIRA Emilie, MC
HYGIENE ET INDUSTRIE DES ALIMENTS : M. BRUGERE Hubert, PR
M. BAILLY Jean-Denis, PR
Mme BIBBAL Delphine, MC
Mme COSTES Laura, AERC
Mme DAVID Laure, MCC
PATHOLOGIE DE LA REPRODUCTION : M. BERTHELOT Xavier, PR
M. BERGONIER Dominique, MC
Mme CHASTANT-MAILLARD Sylvie, PR
Mme HAGEN-PICARD Nicole, PR
M NOUVEL Laurent-Xavier, MC
Mme MILA Hanna, MC
PATHOLOGIE DES RUMINANTS : M. SCHELCHER François, PR
M. FOUCRAS Gilles, PR
M CORBIERE Fabien, MC
M. MAILLARD Renaud, PR . M. MEYER Gilles, PR
PRODUCTION ET PATHOLOGIE AVIAIRE ET PORCINE :
Mme WARET-SZKUTA Agnès, MC
M. JOUGLAR Jean-Yves, MC
M. GUERIN Jean-Luc, PR
M. LE LOC’H Guillaume, MC
PRODUCTIONS ANIMALES
AMELIORATION GENETIQUE ECONOMIE : M. DUCOS Alain, PR
M. SANS Pierre, PR
M. RABOISSON Didier, MC
Responsable : Mme GAYRARD
ANATOMIE :
M. MOGICATO Giovanni, MC
M. LIGNEREUX Yves, PR
Mme DEVIERS Alexandra, MC
ANATOMIE PATHOLOGIQUE - HISTOLOGIE : M. DELVERDIER Maxence, PR
Mme LETRON-RAYMOND Isabelle, PR
Mme BOURGES-ABELLA Nathalie, PR
Mme LACROUX Caroline, PR
M GAIDE Nicolas, AERC
BIOLOGIE MOLECULAIRE :
Mme BOUCLAINVILLE-CAMUS Christelle, MC
MICROBIOLOGIE – IMMUNOLOGIE - MALADIES INFECTIEUSES : M. MILON Alain, PR
M. BERTAGNOLI Stéphane, PR
M. VOLMER Romain, MC
Mme BOULLIER Séverine, MC
Mme DANIELS Hélène, MC
BIOSTATISTIQUES :
M. CONCORDET Didier, PR
M. LYAZRHI Faouzi, MC
PHARMACIE-TOXICOLOGIE : M. PETIT Claude, PR
Mme CLAUW Martine, PR
M. GUERRE Philippe, PR
M. JAEG Philippe, MC
PHYSIOLOGIE –PHARMACOLOGIE THERAPEUTIQUE :
M. BOUSQUET-MELOU Alain, PR
Mme GAYRARD-TROY Véronique, PR
Mme FERRAN Aude, MC
M. LEFEBVRE Hervé, PR
BIOCHIMIE. :
Mme BENNIS-BRET Lydie, MC
ANGLAIS :
M. SEVERAC Benoît, PLPA
Mme MICHAUD Françoise, PCEA
Responsable : Mme CADIERGUES
ANESTHESIOLOGIE M. VERWAERDE Patrick, MC CHIRURGIE : M. AUTEFAGE André, PR M. ASIMUS Erik, MC M. MATHON Didier, MC
Mme MEYNAUD-COLLARD Patricia, MC
Mme PALIERNE Sophie, MC
MEDECINE INTERNE : Mme DIQUELOU Armelle, MC
M. DOSSIN Olivier, MC
Mme LAVOUE Rachel, MC
Mme GAILLARD-THOMAS Elodie, MCC
OPHTALMOLOGIE :
M. DOUET Jean-Yves, MC
DERMATOLOGIE :
Mme CADIERGUES Marie-Christine, PR
IMAGERIE MEDICALE
M. CONCHOU Fabrice, MC
BIOLOGIE MOLECULAIRE. : Mme TRUMEL Catherine, PR
PATHOLOGIE DES EQUIDES : M. CUEVAS RAMOS Gabriel, MC Mme LALLEMAND Elodie, AERC
2
REMERCIEMENTS:
A Monsieur le Professeur Gérard Campistron
Professeur à l’Université Paul-Sabatier de TOULOUSE
Qui nous a fait l‟honneur d‟accepter la présidence du jury de thèse. Hommages respectueux.
A Monsieur le Docteur Guillaume Le Loc’h
Maitre de conférences de l’Ecole Nationale Vétérinaire de Toulouse Médecine zoologique et santé de la faune sauvage
Pour son support et sa confiance, Sincères remerciements.
A Monsieur le Professeur Gilles Meyer
Professeur de l’Ecole Nationale Vétérinaire de Toulouse Pathologie des ruminants
Qui nous fait l‟honneur de participer à notre jury de thèse, Veuillez accepter mes plus sincères remerciements.
3 A la fondation France Vétérinaire International, Pour la bourse qu‟ils m‟ont attribué et qui m‟a permis d‟étudier le master Inter‟Risk un an en Thaïlande.
A l‟Université Fédérale de Toulouse,
Pour attribution de cette bourse qui aide les étudiants souhaitant accroitre leur compétence par la réalisation de projets à l‟international. Sincère remerciement à Malaury Boissier pour sa flexibilité et gentillesse.
To Kasetsart University and the Veterinary Faculty, For hosting this international master degree. I couldn‟t have learnt better how to manage and estimate health risks in South East Asia if I stayed in France. This master deeply influences my thoughts and beliefs. I am also very grateful for the Education Faculty and the women football club for their kindness and involvement towards me.
To the master Inter’Risk teachers, For their involvement, the great quality of their teaching, their advice and support given all along the year.
4 Au Docteur Mathieu Pruvot,
Project Lead - Wildlife Health
Epidémiologiste au Wildlife Conservation Society Cambodia
Pour son encadrement durant ce stage, pour la pertinence de ses conseils, et pour son investissement tout au long de ma thèse.
To the WCS Team, Field work in the deep deforested areas in Cambodia is not easy tasks. It was only made possible thanks to the help and tenacity of a number of people. I am greatly thankful to every person from the WCS who participated in the field work. I am especially thankful to the team I‟ve been working with: Sokha Chea, our coordinator and Srey Em Sours, Onthida Choeun, Sreyleap Torng, Sunsisonila Kang, Udom Hun, Sophornn Ton, Sithun Nuon and the villagers that provided their help.
To all the technicians of the virology unit of Institut Pasteur du Cambodge, I am grateful for the assistance given by Vibol HUL during my stay and for his previous work on the project with the PCR and on the sequences analyses. My special thanks are also extended to Jill-Léa Ramassamy who did an enormous job during the first year of the project.
Aux enseignants de l’Ecole Nationale Vétérinaire de Toulouse pour cette magnifique formation, et enfin à la promo barbe.
Qu‟ils trouvent ici le témoignage de ma gratitude.
The present thesis is the result of an internship done with Wildlife Conservation Society and was part of the One Health LACANET program, funded by the European Commission.
1
CONTENT LIST
REMERCIEMENTS: ... 2 LIST OF FIGURES ... 6 LIST OF TABLES ... 7 ABBREVIATIONS ... 8 PART 1 – RÉSUMÉ ... 10PART 2 – LITTERATURE REVIEW ... 16
1. Health: links between wildlife, land use change and human outbreaks ... 16
1.1. Using One Health approach to tackle disease emergence ... 16
1.2. Links between wildlife, biodiversity and health ... 17
1.2.1. Ecosystem services provided by the forest in Cambodia ... 17
1.2.2. Land-use change and the (re)emergence of zoonosis... 18
1.2.3. Impact of land-use change on wildlife and diseases ... 20
2. Land-use change in Cambodia: trajectories and socio- economic context ... 20
2.1. Deforestation rate estimation in SEA and Cambodia: ... 21
2.2. How economic development and land concessions led to deforestation in Cambodia ... 22
2.2.1. Insecurity of land title in Cambodia ... 22
2.2.2. The role played by economic land concessions in the deforestation . 24 3. Leptospirosis to study the impact of deforestation in Cambodia ... 24
3.1. Leptospirosis overview in SEA: ... 25
3.1.1. High burden in Cambodia but under-reporting of cases: ... 25
3.1.2. Epidemiology of leptospirosis in SEA ... 26
3.2. Prevalence of leptospira among rodents in SEA: ... 28
3.3. Risk factors of rodents infections: ... 28
3.3.1. Flooding season ... 28
2
3.3.3. Individual characteristics explaining the prevalence ... 29
4. Future research recommendations ... 32
4.1. The concept of chronotone to study land-use change ... 33
PART 3 – HYPOTHESIS ... 36
PART 4 – MATERIALS & METHODS... 39
1. Zone selection for a chronosequence design ... 39
2. Study sites and rodent trapping ... 39
2.1. Capture-Mark-Recapture design ... 41
3. Rodent manipulation ... 42
3.1. Rodent measurements and identification ... 42
3.2. Rodent samples ... 42
4. Laboratory analyses ... 42
4.1. Leptospira species and genetic diversity ... 42
4.1.1. Human pathogenic Leptospira infection status ... 43
4.1.2. Leptospira detection among rodents... 43
4.2. Rodent species identification ... 43
4.2.1. Choice criteria for final species decision ... 43
4.2.2. Morphological rodents identification... 44
4.2.3. Barcoding: molecular technique for species identification: ... 44
5. Statistical analyses – capture-mark-recapture modeling ... 45
5.1. Capture – Mark – Recapture data used to estimate the detectability ... 45
5.2. Assumptions of closed capture models ... 46
5.3. Encounter histories, covariates and models selection using MARK software ... 46
5.3.1. About Mark analyses ... 46
5.3.2. Models tested and model selection... 48
3
5.3.4. Summary of the statistic procedure followed ... 49
PART 5 – RESULTS ... 52
1. Rodent community composition and structure ... 52
1.1. Rodent community dominated by three genuses ... 52
1.2. Apparent Mus spp. sex proportion ... 53
2. Abundance estimation ... 54
2.1. N when all sites analyzed collectively... 54
2.1.1. Best model ... 56
2.1.2. Significant covariates ... 56
2.1.3. Population dynamic and variation between zones and season ... 57
2.2. Abundance estimation for Mus spp. in zone 3 ... 58
3. Mus spp. capture probability and sex proportion ... 60
3.1. Capture probabilities according to sex ... 60
3.2. Links between the capture probability and the sex proportion ... 62
4. Leptospira infection and risk estimation ... 63
4.1. Maxomys spp., Rattus spp. and Mus spp. apparent Leptospira prevalence 63 4.2. Mus spp. corrected Leptospira prevalence ... 64
4.3. Risk indicator for the emergence of Leptospira spp. along a deforestation gradient ... 66
PART 6 – DISCUSSION ... 68
1. Ecological drivers of Leptospira infection in Mus spp. ... 68
1.1. Higher female Mus spp. capture probability than male during the dry season in the cultivated area and links with species behaviours ... 68
1.2. Leptospira prevalence underestimated during the dry season in the cultivated area ... 69
2. Rodent community dynamic and risk of Leptospira ... 69
4
2.2. Habitat preference ... 69
2.3. Possible mechanisms of Leptospira emergence during deforestation ... 70
3. Methodological considerations ... 71
3.1. Space-for-time study design ... 71
3.2. Leptospira infection ... 72
3.3. The putative species Rattus sp. R3 ... 72
4. Limitations of the statistical analyses performed ... 73
4.1. Goodness of fit and assumptions ... 73
4.1.1. Data deleted and consequences on p and c ... 73
4.1.2. Small sample size prevent abundance estimation ... 74
5. Bias in the detectability ... 75
5.1. Individual heterogeneity ... 75
5.2. Food availability and environmental covariates ... 75
6. Research perspectives ... 76
6.1. The importance of the environment in the wildlife epidemiological cycle . 76 6.2. Future research using modeling disease in wildlife ... 77
PART 7 – CONCLUSION ... 79
BIBLIOGRAPHY ... 81
APPENDICES ... 91
APPENDIX PART 1 : LACANET project objectives ... 91
APPENDIX PART 2 – 1.2.3: A schematic of the complex relationships between altered environmental conditions and human health (Myers et al., 2013) ... 92
APPENDIX PART 2 – 2.2.1: “Poverty & Equity Data - Cambodia - The World Bank,” (2017) Country inequality trend: distribution of income or consumption by quintile. ... 93
APPENDIX PART 2 - 2.2.2 A: Maps of deforestation and land concessions in Cambodia from LICADHO ... 94
5 APPENDIX PART 2 - 2.2.2 B: Maps of land concessions areas repartition around protected areas in Cambodia from LICADHO ... 95 APPENDIX PART 2 - 2.2.2 C: Maps of land concessions crops in Cambodia from LICADHO ... 96 APPENDIX PART 2 - 2.2.2 D: Maps of land concessions ownership in Cambodia from LICADHO ... 97 APPENDIX PART 2 – 2.2.2 D: Active Fire Reports October 2012 – March 2013 from Forest Trend (2015) ... 98 APPENDIX PART 2 – 2.2.2 E: Fire Distribution in Relation to Forest Formations and Land Concessions ... 99 APPENDIX PART 4 – 3.1: Animal measurements and identification ... 100 APPENDIX PART 4 – 4.2.2.: Decision tree to guide rodent species identification and illustration from Francis 2008 ... 101 APPENDIX PART 4 – 5.1.A.: Illustration from Cooch et al., (2012) ... 102 APPENDIX PART 4 – 5.1.B: Encounter histories: input for mark analyses . 102 APPENDIX PART 4 – 5.2.: Matrix created for modeling using MARK software ... 103 APPENDICE PART 5 – 1.1. : Total number of capture individuals from the three main genus captured by zone by site by season and the species identity.. ... 105 APPENDIX PART 5 – 3.: Count of all captured individuals by species for each zone, site and season. ... 106 APPENDIX PART 5 - 2.1.: List of models used to calculate the average estimated abundance for Maxomys spp., Rattus spp., and Mus spp. by zone by season ... 108 APPENDIX PART 5 – 3.3.2.: Rodents species ranked according to their habitat specialization (Morand et al., 2015b) ... 110
6
LIST OF FIGURES
Figure 1 - Ecology of zoonoses: natural and unnatural histories (Karesh et. al.,
2012). ... 17
Figure 2 - Land-use change as one of the primary driver of disease emergence: scaled number of zoonotic disease emerging infectious diseases events per transmission route categorized by the primary driver of disease emergence for each pathogen (Loh et al., 2015). ... 19
Figure 3 - Forest land area (in 10000 ha) in Cambodia from 1990 to 2015 – exported data collected on FAO website ... 22
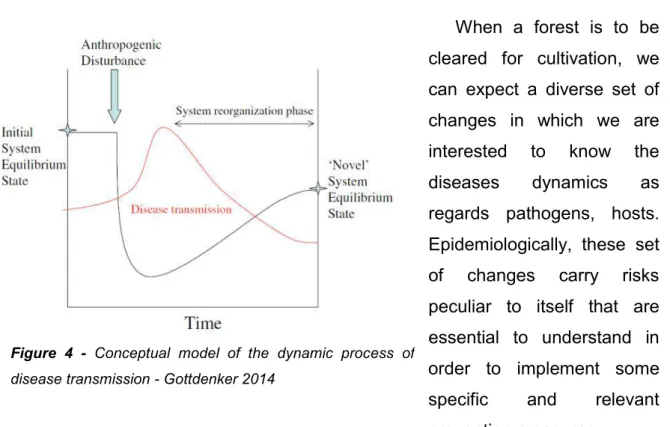
Figure 4 - Conceptual model of the dynamic process of disease transmission - Gottdenker 2014 ... 34
Figure 5 - Locations of sites sampled in red superimposed with the protected areas in Cambodia, map used from Open Development Cambodia... 40
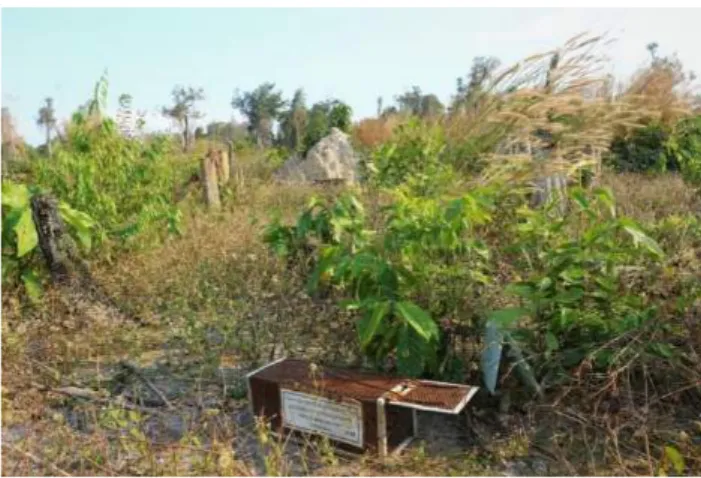
Figure 6 - Locally made non-lethal Havahart traps placed in the cultivated area ... 40
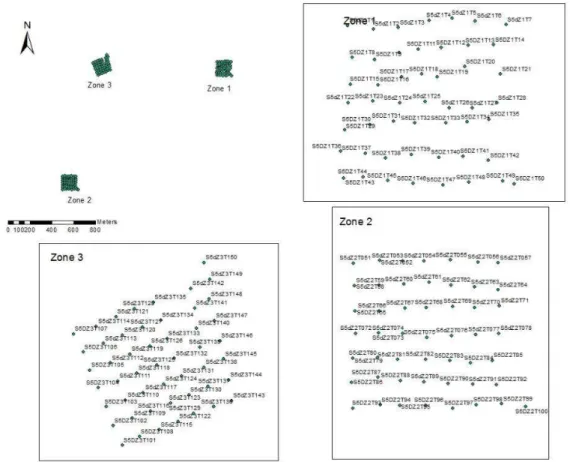
Figure 7 - Example of a trapping grid with the three zones represented ... 41
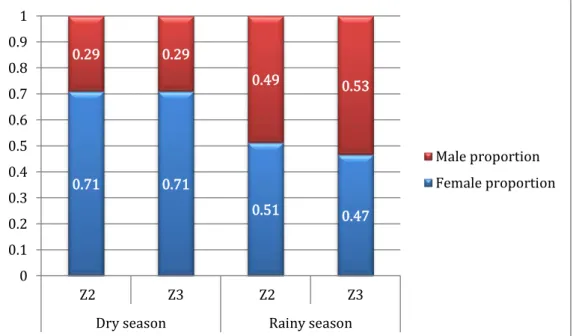
Figure 8 - Mus spp. apparent sex proportion by zone by season ... 53
Figure 9 - N of a model average and their confidence interval for the three main genus captured along a deforestation gradient (zone 1 = intact forest, zone 2 = disturbed forest with intense tree logging, zone 3 = cultivated area). ... 58
Figure 10 - Capture probability and their confidence interval represented by sex, site and season in the disturbed forest - zone 2 (A) and the cultivated area - zone 3 (B). ... 61
Figure 11 - Mus spp. corrected and apparent sex proportion in zone 3 between seasons ... 63
Figure 12 - Apparent Leptospira prevalence by zone by season for the three most abundant genuses ... 65
Figure 13 - Risk of Leptospira spp. along a deforestation gradient by zone by season ... 66
7
LIST OF TABLES
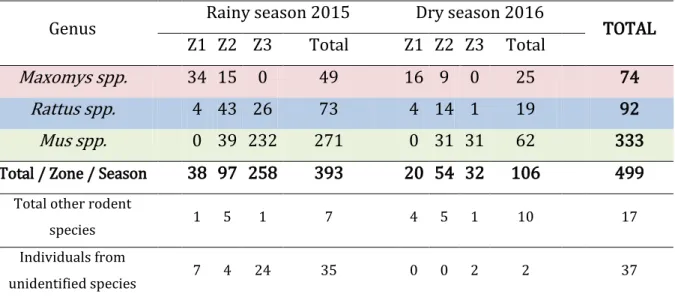
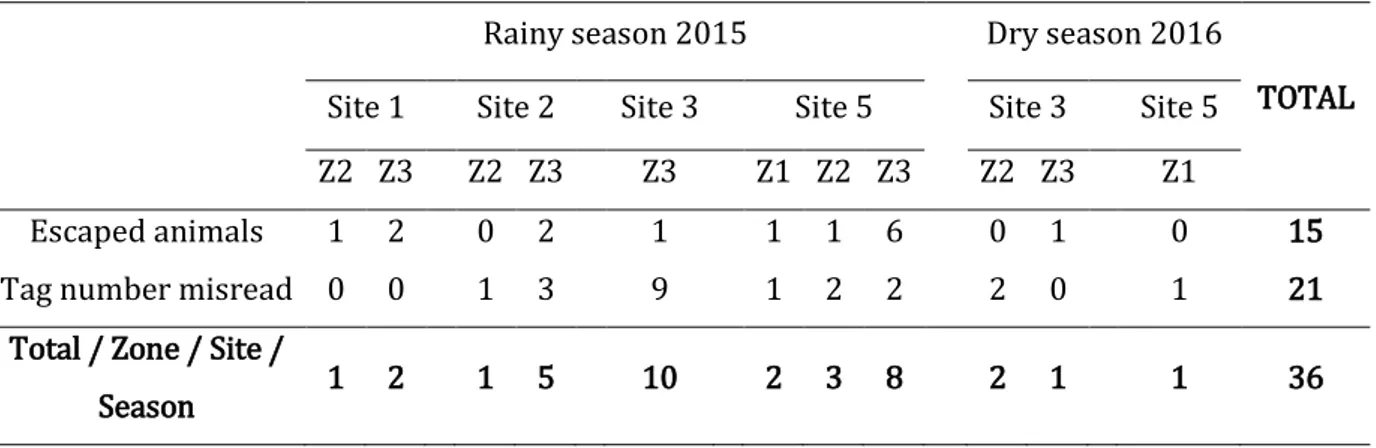
Table 1 - Comparison of leptospirosis prevalence among rodents of 5 studies conducted in SEA. A. Leptospirosis prevalence per species – results are a percentage (total number of sampled animal into brackets) B. Main study design characteristics. ... 31 Table 2 - Sampling time period for each sites and the time interval between seasons ... 40 Table 3 - Individuals distribution by zone and season for the main rodent genuses with the total number of individuals from other rodent species and individuals from unidentified species ... 52 Table 4 - Number of animal removed according to the identification problem by zone/ site/season. ... 54 Table 5 - Estimated abundance (N ) of model average for Maxomys spp., Rattus spp. and Mus spp. by zone, by season.; ... 55 Table 6 - Best model that fitted the data by genus, by zone, by season. ... 56 Table 7 - Mus spp. N of models average in zone 3 (cultural lands) by site by season with the best model fitting the data.. ... 59 Table 8 - Best model that fitted the data for Mus spp. in zone 3 (cultural land) by season ... 59 Table 9 - Uncorrected and estimated abundance of Mus spp. in zone 3 by sex, season using {Mt+Si} for the rainy season and {Mt+t²+Si} for the dry season with the corrected and apparent sex proportion. ... 62 Table 10 – Apparent prevalence in percentage of leptospirosis by zone and season for each of the main genus with the total number of positive individual and the total number of tested individual. ... 64 Table 11 – Corrected and uncorrected prevalence of Mus spp. in zone 3 by season with the corrected and apparent prevalence (%) ... 65
8
ABBREVIATIONS
c: probability of recapture (sign used during MARK analyses)
COI: Cytochrome c Oxydase I CT: Cycle-to-threshold
ELC: Economic Land Concession GPS: Global Positioning System
HCI: Higher limit of the 95% Confidence Interval LCI: Lower limit of the 95% Confidence Interval
N : Estimated abundance (estimated thanks to MARK software) OECD: Organisation for Economic Co-operation and Development
p: probability of first capture (sign used during MARK analyses)
PCR: Polymerase Chain Reaction
RT-PCR: Real-Time Polymerase Chain Reaction SEA: South-East Asia
SECR: Spatially Explicit Capture-Recapture VTM: Viral Transport Media
9
10
PART 1
– RÉSUMÉ
Dans le cadre de ma cinquième année vétérinaire, j‟ai suivi le master d‟évaluation et de gestion du risque en santé à l‟interface entre homme, animal et environnement, appelé Inter‟Risk. Ainsi, mon stage de master et cette thèse s‟inscrivent dans le projet de recherche Lacanet soutenu par le CIRAD ainsi que l‟association non gouvernementale appelée Wildlife Conservation Society.
L‟étude des occurrences des maladies infectieuses émergentes entre 1940 et 2004 montrent que 70% d‟elles sont des zoonoses et qu‟entre les années 1990 et aujourd‟hui une part grandissante de la transmission de ces zoonoses a pour origine la faune sauvage (Jones et al., 2008). L‟Asie du Sud Est est une région singulière car elle se situe au carrefour des différents points chauds (hotspot) étant à la fois une région très riches en espèces notamment menacées (Schipper et al., 2008) et un lieu important d‟émergence des maladies infectieuses (Jones et al., 2008). Morand et al. (2014) ont montré que le nombre d‟espèces en danger est corrélé au risque d‟émergence des maladies infectieuses. D‟autres auteurs présentent le changement d‟utilisation des terres, l‟un des impacts majeurs de l‟homme sur sa biosphère, comme un des mécanismes à l‟origine de l‟émergence de certaines maladies infectieuses.
Ainsi, les facteurs causant l‟émergence des maladies infectieuses sont souvent discutés (Loh et al., 2015; Patz et al., 2004). Les grandes organisations internationales comme l‟Organisation Mondiale de la Santé ou l‟OIE s‟accordent à dire qu‟une vision intégrée de la santé est nécessaire pour faire face à ce risque accru d‟émergence. De fait, depuis le début des années 2000, l‟étude conjointe de la santé animale, humaine et celle de l‟environnement s‟est progressivement développée sous le concept de « One Health » qui permet une approche de la santé dans sa globalité.
Le Cambodge est un pays marqué par le régime des Khmer rouges, à l‟origine d‟un conflit extrêmement violent qui a débuté en 1975, et le pays n‟a retrouvé une stabilité qu‟une 1993 (Cambodia Tribunal Monitor, 2009). Aujourd‟hui, le Cambodge est en plein développement avec un PIB annuel de 7% depuis 2011 (OECD, 2017),
11 notamment grâce au commerce de l‟habillement et aux investissements étrangers. Malgré cette croissance économique persistante, la corruption est encore très présente comme l‟attestent l‟index de gini, marqueur des inégalités, qui était ainsi croissant entre 2004 et 2007 et le fait que l‟inviolabilité du droit de la propriété ne soit toujours pas acquis. Ainsi, le gouvernement cambodgien a attribué des terres, parfois privées, à des concessions de terres (LICADHO, 2015).
De surcroît, le Cambodge présente l‟un des plus fort taux de déforestation annuel d‟Asie du Sud Est, celui étant d‟environ1.57% entre les années 1990 à 2010 (source officielle de la FAO) De nombreux auteurs prédisent par ailleurs que la déforestation provoquerait une émergence des cas de leptospirose (Patz et al., 2004). Ainsi, la population rurale cambodgienne se situe à la confluence de l‟insécurité des droits humains et d‟une déforestation intense présentant un risque accru d‟émergence des zoonoses. Cela nous a poussés à explorer les mécanismes, eux-mêmes, qui sous-tendent l‟émergence de la leptospirose au cours de la déforestation.
La leptospirose est une maladie infectieuse dont la bactérie responsable est
Leptospira spp. La bactérie se transmet par l‟urine d‟un animal infecté et persiste
dans l‟environnement. Les rongeurs sont considérés comme des réservoirs de la bactérie. En effet, la bactérie colonise les tubules proximaux des reins et continue de se multiplier pendant plusieurs années sans que les rongeurs ne présentent de symptômes (Levett, 2001).
Au cours de cette étude, nous avons fait l‟hypothèse que le processus de déforestation augmente la circulation de Leptospira spp. entre les rongeurs. Ainsi, le but de cette étude est d‟identifier les mécanismes menant à l‟émergence de la leptospirose en partant d‟une forêt intacte à une zone agriculturale. Nous avons fait les hypothèses suivantes :
(1) Une forêt avec un abattage intense constitue une zone de transition entre la forêt intacte et la zone d‟agriculture de par une végétation intermédiaire. Ainsi, les différentes espèces de rongeurs se chevauchent et ont des contacts plus fréquents. Cette zone est alors considérée comme une zone de spillover, permettant la transmission du pathogène d‟un individu naïf à un individu infecté. (2) La zone cultivée, en tant qu‟écosystème simplifié et manipulé par l‟homme, est
considérée comme moins résiliente aux changements entre saisons qu‟une forêt intacte. En conséquence, les variations des dynamiques de population seront
12 différentes. Des variations importantes des populations de rongeurs sont attendues dans la zone cultivée, que l‟on considère comme une zone d‟amplification de la maladie.
(3) Dans le cas d‟une transmission directe de la leptospirose par des espèces de rongeurs spécialistes, la déforestation diminuera le risque d‟émergence de la leptospirose.
Pour tester ces hypothèses, nous avons étudié la dynamique des populations de rongeurs avec pour objectif d‟estimer les abondances saisonnières pour chaque espèce de rongeurs et pour chaque niveau de déforestation. L‟estimation de cette abondance a été mise en relation avec la probabilité de capture et de recapture. L‟estimation de la détectabilité permet de distinguer une variation d‟abondance réelle d‟une variation liée à une différence probabilité de capture.
Dans le but d‟étudier les mécanismes d‟émergence de la leptospirose au cours de la déforestation, il est important de considérer le processus de déforestation comme un continuum dans le temps plutôt que le passage d‟un écosystème de type forêt à un écosystème cultivé (Bradley, 2004). Pour ce faire, le processus de déforestation est étudié grâce à un design d‟étude appelé space for time substitution (Bradley, 2004). Ce design considère que des zones avec des gradients de déforestation croissant, choisies en fonction de leur proximité géographique, reflète le processus temporel de la déforestation en lui-même. Il s‟agit d‟une substitution du temps pour l‟espace. Ainsi, le design space for time substitution, s‟affranchit d‟un suivi longitudinal long et couteux mais assure le reflet temporel du processus de déforestation. Trois zones, présentant un gradient croissant de déforestation ont donc été définies : une zone de forêt intacte qui ne subit qu‟un abattage sélectif d‟arbre (il n‟existe plus de forêt vierge au Cambodge), une zone de forêt perturbée qui subit un abattage non sélectif d‟arbres et une modification du paysage au rythme le plus rapide et enfin une zone cultivée de moins de deux ans depuis la déforestation complète. Ces trois zones sont choisies géographiquement proches et reflètent le processus de déforestation à des temps différents. L‟étude a été répétée dans cinq sites différents pendant la saison des pluies et la saison sèche dans les provinces de Mondulkiri et de Kampong Thom au Cambodge. Les rongeurs ont été capturés simultanément dans les trois zones d‟un même site pendant huit nuits
13 consécutives. Les rongeurs capturés sont marqués par une boucle auriculaire, échantillonnés puis relâchés au niveau du piège. Les espèces ont été déterminées par analyses moléculaires (barcoding) (Bordes et al., 2015) et vérifiées par les données morphologiques récoltées. Les données de capture et recapture ont permis de créer des histoires de capture au cours des huit nuits consécutives pour chaque individu. Ces données appelées données de capture-marquage-recapture sont utilisées pour la modélisation de l‟abondance et des probabilités de capture et recapture sous le logiciel MARK. Le statut infectieux vis-à-vis de la leptospirose a été déterminé par RT-PCR en ciblant les gènes rrs et lipl32 (Smythe et al., 2002; Stoddard et al., 2009). Le gène rrs représente une séquence universellement portée par Leptospira spp. et que l‟espèce soit pathogène ou intermédiaires, tandis que le gène lipl32 représente une séquence uniquement présente chez les leptospires pathogènes.
Un total de 553 individus ont été capturés avec trois genres majoritairement capturés que sont Maxomys., Rattus et Mus. Les résultats de la modélisation montrent que les estimations d‟abondance de ces trois genres majoritaires varient entre les saisons et entre les différents niveaux de déforestation. En effet, les individus Maxomys spp. ne sont jamais capturés dans la zone cultivée tandis que les individus Mus spp. ne sont jamais capturés dans la zone de forêt intacte. Les individus Rattus spp. quant à eux, ont été capturés dans les trois niveaux de déforestation. Ce schéma de répartition est observé durant la saison sèche et la saison des pluies. De plus, le genre Mus spp. est celui qui présente la plus forte variation d‟abondance entre les saisons dans la zone cultivée en passant de 63,52 individus [CI 95% : 38,56 ; 161,18] en saison sèche à 327,41 individus [CI 95% : 323,69 ; 331,29] en saison humide (abondance pour tous sites regroupés).
Les résultats de capture montrent également une proportion apparente des femelles Mus spp. différente entre les saisons dans la zone cultivée. En effet, la proportion de femelle de 0,71 en saison sèche est significativement différente de la proportion de femelle de 0,47 en saison humide dans la zone cultivée. Cependant, les analyses d‟abondance corrigée contredisent cette différence de proportions entre femelles et mâles. Cela s‟explique par une différente probabilité de capture en fonction du sexe de l‟individu. En effet, les femelles présentent une probabilité de capture supérieure au mâle au cours de la saison sèche dans la zone cultivée, tandis
14 que la probabilité de capture est identique entre les mâles et les femelles pendant la saison humide.
Enfin, des estimations corrigées de la prévalence de leptospirose ont été calculées lorsque la taille de l‟échantillon le permettait. Un indicateur du risque de l‟émergence de Leptospira spp. a été calculé en combinant les abondances par genre et par site à la prévalence apparente de Leptospira spp. (la prévalence corrigée ne pouvant être estimée à cause d‟une taille d‟échantillon faible). Les résultats montrent notamment une augmentation du risque d‟émergence de
Leptospira spp. avec le niveau de déforestation pendant la saison humide. Ce risque
n‟augmente pas en saison sèche.
Ce dernier résultat est cependant à parfaire en utilisant des prévalences corrigées. En effet, la littérature scientifique nous informe que les mâles sont plus susceptibles d‟être infectés par Letpospira spp. que les femelles (Ivanova et al., 2012). Ce fait est à mettre en relation avec la plus forte « visibilité » des femelles au cours de la saison sèche qui masque la prévalence réelle au sein de la communauté des rongeurs. Ainsi, la prévalence apparente de la leptospirose est sous-estimée au cours de la saison sèche dans la zone cultivée, ce qui entraine également une sous-estimation du risque d‟émergence. De plus, la plupart des études préalables ne prenant pas en compte la probabilité de capture des femelles, leur prévalence est probablement également sous-estimée. La faible taille de l‟échantillon de cette étude ne nous a pas permis de calculer la prévalence corrigée. Cependant, les résultats de la deuxième année de ce projet devraient fournir des nouvelles données pour compléter ce travail.
De par le design particulier de cette étude, il est possible de mettre en avant les conséquences du processus de déforestation lui-même. Nous avons montré une modification de la communauté de rongeur au cours de la déforestation avec une abondance plus importante pendant la saison humide que la saison sèche. Cette étude offre également un aperçu de l‟importance de prendre en compte des probabilités de détection avant de tirer des conclusions sur la prévalence et l‟écologie d‟une maladie.
15
16
PART 2
– LITTERATURE REVIEW
1. Health: links between wildlife, land use change and human
outbreaks
1.1. Using One Health approach to tackle disease emergence
One Health is an emerging way of thinking, studying and solving challenging health threats, which aims to consider human, animal and environmental health linkages. Health has often been ill-defined and mostly human focused, by defining health as the absence of diseases. However, it can also be thought with a broader point of view which defined health as the presence of a well-being. Stephen et al. (2014) maintained the idea that „One health‟ projects were mainly focused on diseases from an animal-human perspective, often leaving environment a step behind. They suggested that we should adopt an integrative definition of health that we can link with the concept of „resilience‟ often used by ecologists. Resilience is the capacity to cope and recover from stressors or changes. They insisted on the fact that we could benefit from a socio-ecological approach to health and consider the reciprocal care of health and the environment for human well-being and this thought should be the base for „One Health‟ projects. Myers et al. (2013) also highlighted that existing research on human health impacts of ecosystem alterations focused on a single outcome of health. Since ecosystem degradation has multiple impacts on health, Myers et al. (2013) advised to study their contribution to health outcomes. For example, we can ask „how much is malaria a consequence of deforestation‟ and thus consider the net health effects. This would have more benefit for public health and conservation.
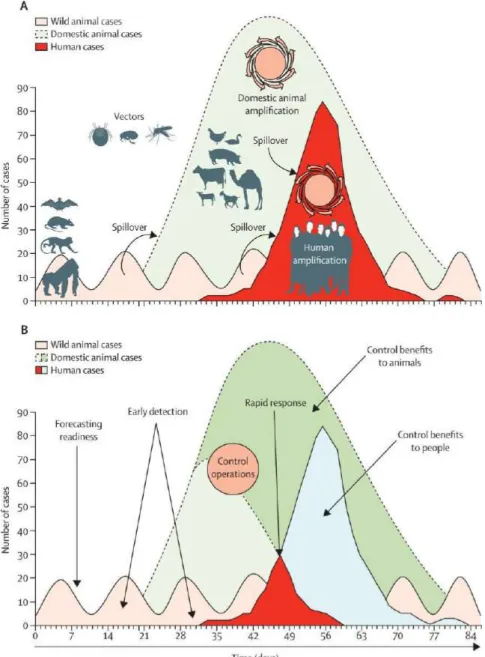
With this in mind, disease ecology, understudied at the moment but already a dynamic area of research could play an important role to understand mechanisms of diseases emergence and reduce number of cases. As illustrated by Karesh et al. (2012) in the figure 1 bellow showing the dynamic of zoonosis emergence from wildlife to domestic animals and humans. Early detections surveillance systems among wildlife population at the interface with human and animals could be a key component to improve public health. These challenges could be addressed using a One Health approach.
17
Figure 1 - Ecology of zoonoses: natural and unnatural histories (Karesh et. al., 2012). A. Transmission of infection and amplification in people (bright red) occurs after a pathogen from wild
animals (pink) moves into livestock to cause an outbreak (light green) that amplifies the capacity for pathogen transmission to people.
B. Early detection and control efforts reduce disease incidence in people (light blue) and animals (dark green). Spillover arrows shows cross-species transmission.
1.2. Links between wildlife, biodiversity and health
1.2.1. Ecosystem services provided by the forest in Cambodia
Persson et al. (2010) wrote a report for the Stockholm Environment Institute about the ecosystem services supporting livelihoods in Cambodia. Forest resources
18 were reported to be used in all seven villages surveyed. Twenty five percent of the villagers identified forest resources as their second most important source of income, as it is also observed in other tropical countries (Colfer et al., 2006). Timber, bamboo, rattan are the main forest products collected. Added to this, food such as snails, frogs, eels as well as edible plants or leaves are collected for household consumption and medicinal care. These goods collected by numerous households contribute to an important part of the household income as well as the protein supply, as revealed by interviews in this study.
Persson et al.'s report (2010) highlights that some villagers experienced a decline in availability due to the interdiction to collect forest products from new economic land concessions leading to the need to pay to collect these resources while it was free of charge before.
When people‟s food, health care, economic systems have always been intertwined with the forest, its loss have negative implications not only for their socio-economic status, but also for their mental health and well-being. These populations also become prone to infectious diseases because of an unpredictable sanitary situation and different exposure pathways to infectious diseases (Colfer et al., 2006).
Soil stabilization, erosion control, sustaining air quality, climate regulation, carbon sequestration are some examples among a long list of forest ecosystems services.
1.2.2. Land-use change and the (re)emergence of zoonosis
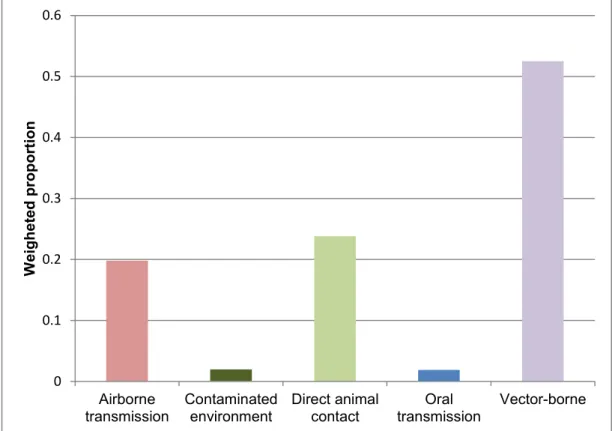
Two-thirds of known human infectious pathogens have emerged from animals, with the majority of recently emerging pathogens originating in wildlife (Taylor et al. 2001; Jones et al. 2008). Among others, the occurrence of chagas disease, yellow fever and leishmaniasis have been linked to the change in land use in tropical regions. This has been explained by the particularly intense changes faced by primary forests that opened to extractive industries (Karesh et al., 2012). These lands are also emerging disease hotspots because of their richness in wildlife biodiversity and thus probably richness in pathogens never seen by human populations. At the same time, contacts between human populations and unmodified ecosystems are increasing. Loh et al., (2015) identified zoonotic diseases attributed to land-use change and attributed a likelihood for each transmission pathways. Thus, zoonotic
19 diseases attributed to land-use change were more likely to be transmitted via the vector-borne pathway (52.5%), followed by direct animal contact (23.8%), the airborne pathway (19.8%), and a smaller proportion from the contaminated environment and oral transmission pathways (2%).
Figure 2 - Land-use change as one of the primary driver of disease emergence: scaled number of zoonotic disease emerging infectious diseases events per transmission route categorized by the primary driver of disease emergence for each pathogen (Loh et al., 2015).
Three main mechanisms leading to the emergence of humans pathogens after the clearing of forests has been suggested by Wilcox & Ellis, (2006): the exposure of immunologically naïve population to pathogen present in forests, an increase in the abundance of dispersal of pathogens influencing hosts abundance and distribution and finally, the alteration of ecohydrological functions which facilitate the survival and transport of waterborne pathogens.
Wilcox and Ellis (2006) said in their article called forests and emerging
infectious diseases of humans: “disease emergence is a transient phenomenon in a
human population, and in its most severe form is typically a consequence of rapid social and environmental change or instability”.
0 0.1 0.2 0.3 0.4 0.5 0.6 Airborne transmission Contaminated environment Direct animal contact Oral transmission Vector-borne W eigh eted prop o rt ion
20 1.2.3. Impact of land-use change on wildlife and diseases
In SEA, the importance of rodent-borne diseases in regards to emergence of zoonotic diseases is very high (Morand et. al., 2015a). Moreover, (Serge Morand et al., 2014) showed that rather than the richness of birds and mammals, it is the number of threatened mammals and bird species that is positively correlated with outbreaks. Biodiversity is thus a source of pathogens, but the loss of biodiversity or its regulation seems to be associated with an increase in the number of zoonotic outbreaks.
Land-use change had considerably impacted the biodiversity (Sodhi et al., 2004; Wilcove et al., 2013). The reemergence of leptospirosis is recognized to be linked with deforestation (Patz et al., 2004).Myers et al., (2013) proposed a schematic of the complex relationships between altered environmental conditions and human health (appendix part 2 -1.2.3).
Galetti et al., (2015) studied the change in abundance and diet of rodents following the extinction of a dominant terrestrial mammal in a neotropical rainforests. Their results support the hypothesis that the local extinction of a dominant ungulate has an effect on the abundance and diversity of small mammals in species-rich communities. Two of the three rodent species were found with an increased abundance in defaunated forests (Akodon montensis and Oligoryzomys nigripes). This finding has important consequences in terms of human-health since these 2 species are important hosts of Hantavirus. Thus, Galetti et al.'study (2015) highlights that defaunated non-fragmented forests contribute to an increase in the population of Hantavirus hosts and ultimately-trigger the emergence and spread of lethal diseases in human populations.
2. Land-use change in Cambodia: trajectories and socio- economic
context
Miettinen et al. (2011) identified that the main change trajectories leading to deforestation in South-East Asia, between 2000 - 2010, is due to the transition from forest to plantations. Stibig et al., (2014) ranked the main forest change processes in SEA between 1990 - 2010 and identified that the first cause of forest loss is the conversion to cash crop plantations (coffee, tea, sugarcane, oil palm). The second
21 cause identified being logging and thirdly, fast-growing forest plantations as rubber plantations. The latter trajectory was mainly occurring in Cambodia.
Moreover, official data on 200 Economic Land Concessions (ELCs) analyzed by Forest Trend (2015) indicate that their main purpose of deforestation was for rubber plantations (about 1.1 million hectares of concessions areas), sugar culture (150,000 ha) and pulp/paper (100,000 ha). ELCs are estimated to cover 12% of the country (LICADHO, 2015), see 2.1. These preliminary results support the conclusion made by Stibig et al. (2014) that rubber is the major driver of deforestation performed by ELCs in Cambodia.
2.1. Deforestation rate estimation in SEA and Cambodia:
Deforestation rate in SEA is recognized to be one of the highest in the world (Deforestation Dataset University of Maryland, 2014). FAO estimated in 1995 that SEA harbor 15% of the world‟s tropical forest (Stibig et al., 2014). Estimated rates of deforestation vary from one to another study. Miettinen et al. (2011) estimated an overall annual deforestation rate of 1.0% in continental and insular SEA between 2000 and 2010. This rate is lower than the estimation provided by FAO during the 1990‟s, which estimated a 1.5% - 1.7% deforestation rate. However, Stibig et al. (2014) indicate an annual deforestation rate of 0.67 for the 1990‟s and 0.59 for the 2000‟s. There are huge disparities between SEA‟s countries. Sumatra being the highest with an annual deforestation rate of 2.7% between 2000 – 2010 (Miettinen et al., 2011).
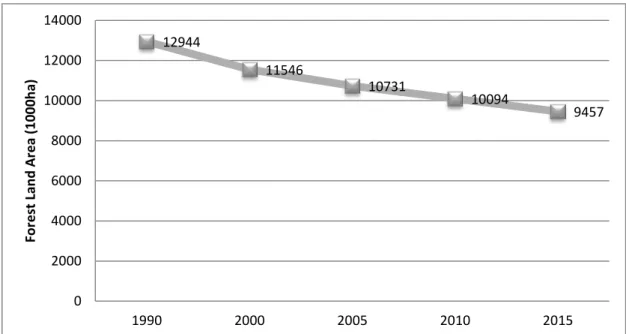
To focus on Cambodia, official data collected by FAO indicate a decrease of the forest land area from 12,944,000 ha in 1990 to 9,457,000 ha in 2015, with an annual deforestation rate of 1.57% from 1990 to 2010 (figure 3).
The national forest cover change assessment conducted in 2006 by the forest administration (the key government agency in the forestry sector in Cambodia) concluded that forest cover declined from 61% of the total land area in 2002 to 59% in 2006, which is equivalent to an annual rate of deforestation from 2002-2006 of 0.5% of the total land area (The forestry administration, 2010). According to a report of 2015 (Forest Trend, 2015), Cambodia is losing forest at a rate of 804 square mile a year, that‟s to say 1.15%.
22 12944 11546 10731 10094 9457 0 2000 4000 6000 8000 10000 12000 14000 1990 2000 2005 2010 2015 Fo re st Lan d A re a ( 1000 h a)
2.2. How economic development and land concessions led to deforestation in Cambodia
2.2.1. Insecurity of land title in Cambodia
After a three decades history of violent conflicts and traumatic Khmer Rouge regime, Cambodia has reached a political stability since 1993, when the newly elected government came to power (Cambodia Tribunal Monitor, 2009). This has led to an improvement of development indicators (“World Bank Cambodia Data,” 2017), of the enrollment rate in primary education and of maternal health (World Bank, 2006). Cambodia is now considered as an emerging country, with a rapid and solid economic performance of a constant 7% annual GDP since 2011, which rank it in the top 3 of highest GDP of ASEAN 10 (OECD, 2017).
However, growth has been largely driven by the garment, tourism and construction sectors, located in the urban areas, while agricultural growth has been rather modest, with more than 90% of Cambodia‟s poverty in rural areas (World
Bank, 2006). Thus, the primary drivers of growth have only few linkages with the
majority of the population, leading to an urban growth bias (Rudi et al., 2014).
While, international indicators depict a decrease in the poverty trends, the inequality indicators are not doing so (appendix part 2 - 2.2.1.The World Bank,” 2017). Indeed, the Gini coefficient (the most commonly used measure of inequality)
Figure 3 - Forest land area (in 10000 ha) in Cambodia from 1990 to 2015 – exported data
23 has risen from 0.38 in 2004 to 0.41 in 2007 before to decrease. Moreover, the Economist Intelligence Unit, (2009), based on its Political Instability Index1, identified Cambodia as one of the most vulnerable nations to socio-political unrest due to social inequality and economic distress. Cambodia‟s corruption index lies at 2.1 out of 10, ranking it 156th position out of 176 countries; and for the second year Cambodia is the most corrupt South East Asian country on their list (“Transparency International,” 2017).
The strategy of Cambodian government has been to promote investment influx in order to favor economic growth, regardless on human rights (Amnesty International, 2008; Rudi et al., 2014). With 56% of the country‟s ELCs granted to foreign companies, ELCs are estimated to cover 2,1 million hectares, ie. approximately 12% of the country (LICADHO, 2015).
The opaque process by which land titles are granted is based on selective and arbitrary law enforcement for those with connections to the powerful and weak institutions (De Lopez, 2002; LICADHO, 2015). Some forced evictions cases are not a last resort decisions and land title not a guarantee, depriving Cambodian from their human rights (“LICADHO,” 2015).
Land grabs have been made through violence, in some cases involving Cambodian authorities (LICADHO, 2015; Amnesty International, 2008), and inadequateness of relocation sites (Land and house rights work group, 2009) created a more economic vulnerable population, that has also an impact on their mental health and well-being (Colfer et al., 2006).
Thus, the Kingdom of Cambodia is a post-conflict developing society characterized by weak democratic institutions, large inequality, in spite of consistent economic growth. The absence of security of tenure, in the context of endemic corruption, and a rapid influx of foreign investment and economic development, has led to a land rights crisis in Cambodia.
1
This index includes 3 economic distress index and 12 vulnerability indicators which are: inequality; state history; corruption; ethnic fragmentation; trust in institutions; status of minorities; history of political instability; proclivity to labor unrest; level of social provision; a country's neighborhood; regime type (full democracy, authoritarian, etc); and the interaction of regime type with political factionalism.
24 2.2.2. The role played by economic land concessions in the deforestation
From 1997 to 2002, deforestation in Cambodia was mainly associated with smallholder agricultural encroachment along the boundaries between extensive forest and non-forest landscapes (Amariei, 2004). This form of deforestation appears relatively limited today as large scale agri-industrial plantations have rapidly encroached on forest lands since mid-2004.
Thus, ongoing deforestation in Cambodia is mainly explained by the large land concessions accorded to agricultural companies. Nearly 14% (nearly 12% according to LICADHO) of the country has been allocated to these corporations. Moreover, according to Engvall et al. (2007), due to the absence of constraints for investors, many of them have focused on harvesting existing forest resources and then left empty lands once trees were cut.
Using Nasa satellite images of forest fires and carbon emissions, Forest Trend localized ongoing deforestation. These records showed that ELCs are targeting the oldest and most valuable forests (many of them on national forest lands) for logging. This information is consistent with the maps published by LICADHO that made observations in the country (appendix part 2 - 2.2.2.)
Thus, lands are acquired by powerful people in connection with a corrupted government. The loss of forest cover observed in Cambodia is consistent with land use and land cover change patterns associated with demographic growth and economic development in most countries.
The combined effects of this land-use change have severe impacts on the livelihood of villagers facing insecure income and land title, as well as threats upon an exploited forest ecosystems.
3. Leptospirosis to study the impact of deforestation in Cambodia
Leptospirosis is an infection caused by bacteria of genus Leptospira that includes 9 pathogenic species and at least 5 intermediate species (with approximately 20 species and more than 300 serovars) (Bharti et al., 2003). Half of the pathogenic serovars belongs to species L. interrogans or L. borgpetersenii. Symptoms vary widely, making distinction between malaria, viral hepatitis, yellow fever, dengue and
25 viral meningitis very complicated and leading to misdiagnosis. In most cases, leptospirosis leads to a febrile illness. Asymptomatic or subclinical infection is believed to be common in endemic regions (Levett, 2001).
3.1. Leptospirosis overview in SEA:
Classified by WHO as a neglected zoonotic disease, a subset of neglected tropical diseases, leptospirosis is however not included in its top 17 priorities. At the same time, literature reports that leptospirosis burden is very likely underestimated in low-income tropical countries, and may therefore be comparable or even higher to other important neglected tropical diseases (visceral leishmaniasis, severe dengue and cysticercosis for example).
Several studies support the fact that leptospirosis is an important and emerging NTD which should be more taken into consideration (Costa et al., 2015; Mwachui et al., 2015; Picardeau et al., 2015). Moreover, as highlighted by Ewald et al. (2002), we should focus on diseases already globally distributed and prevalent, representing consequently a major threat for public health instead of focusing on famous and excessive media exposure that benefits some acute infectious diseases.
Indeed, leptospirosis is one of the world‟s most widespread zoonotic infectious diseases. Thailand, Cambodia, Laos, Vietnam are considered endemic areas for this disease.
3.1.1. High burden in Cambodia but under-reporting of cases:
WHO estimates the prevalence in tropical countries at 10 cases per 100 000 people, and can soar to over 100 cases per 100 000 people in case of epidemic (WHO | Leptospirosis Burden Epidemiology Reference Group, 2017). Costa et al., (2015) estimated the global burden of leptospirosis at over one million severe human cases per year, and approximately 60,000 deaths per year. However these numbers are likely underestimated due to limitations of surveillance systems in low income countries (Picardeau et al., 2015).
SEA is a region where incidence is high, and more and more countries report leptospirosis outbreaks (Cosson et al., 2014). Current trends of leptospirosis outbreaks, especially in endemic areas, indicate that geographic spread and
26 epidemics will increase in the future (WHO SEA Regional Office).Thailand, for example, which has a relatively good health system, reports several thousand cases of leptospirosis each year, while Cambodia reports very few. This discrepancy could be due to under-reporting. Indeed, the largest study in Cambodia on human leptospirosis tested N=612 hospitalized-patients with an infectious syndrome (among them 10% were previously tested negative to dengue from the dengue surveillance network). This study revealed that 14.4 % were tested positive for an acute
Leptospira infection (detected by PCR targeting rrs gene and lfb1 for confirmation)
and 29.9% were positive by at least one biologic marker (IgM or PCR) (Berlioz-Arthaud et al., 2010).
In order to get free from the selection bias of hospitalized patients, a community based study has been conducted by Hem et al. (2012) in Kampong Cham, the most populated province in Cambodia. They aimed to estimate the risk of being infected by Leptospira among children and young adults (< 20 years old) with fever. A total of 8295 samples were first tested for the most common cause of fever in Cambodia (Dengue, Japanese encephalitis virus, Chikungunya virus, Influenza, Respiratory Syncitial Virus and Human Metapneumovirus). Positives samples were removed and a random selection of the 7162 remaining negatives samples was done. Among the 2358 samples tested for anti-leptospirosis IgM, 26.7% were found positives. Modeling analyses lead to an overall semestrial probability of having fever caused by leptospirosis of 1.03% (95%CI: 0.95%-1.22%) among all children and young adult under 20 years old with fever (Hem et al., 2012).
Thus, Cambodia is an endemic country of leptospirosis with a high burden of infections but with high under-reporting of cases.
3.1.2. Epidemiology of leptospirosis in SEA
The source of infection in humans is usually urine of an infected animal, the contamination being mainly for indirect contact. The main portal of entry is through abrasions or cuts after prolonged immersion in water. Although rats, mice and other rodents are believed to be reservoir, a wide range of other mammals (dogs, deer, rabbits, cattle, buffaloes, sheep, and pigs) also carry and transmit Leptospira.
27 This wide range of animals which can serve as an infection source explains the wide geographically distribution of this zoonotic disease. Moreover, some infected species, as rodents for example, can remain asymptomatic and shed infectious organisms in urine for their entire lifetime. Indeed, Leptospira colonize persistently the proximal renal tubules (Levett, 2001). Wildlife might play an important role in the transmission pathway (Mwachui et al., 2015) but the mechanisms are still unclear.
Most Leptospira are resistant in the environment with a longer survival in warm and humid conditions (Andre-Fontaine et al., 2015). Thus, we observe a seasonality of the disease with a peak incidence during rainy seasons in tropical countries; which are usually developing countries with greater contacts with livestock, domestic pets and wild animals (Levett, 2001).
The review from Bharti et al. (2003) underlined that isolated populations of mammals may have an important role in the maintenance of unusual serovars, and that a single species may carry different serovars in geographically distinct populations.
Clinical disease in wild animals appears to be less severe than the one described in subsequently infected humans. Although numerous pathogenic serogroups of Leptospira exist, not all exhibit the same virulence in each animal species.
Leptospirosis transmission risk factors
In their review, Mwachui et al., (2015) aimed to assess the environmental and behavioral determinants of leptospirosis transmission, classified risk factors into the following categories: i) water related (eg. flooded areas), ii) agriculture area (eg. rice production), iii) landscape factors (eg. forest cover), iv) socio-economic status (specific home construction materials as a proxy), v) sanitation (eg. type of and proximity to sewage system), vi) behavioural (eg. walking barefoot), vii) animals.
Occupational exposure such as rice farming and other agricultural activities is significant, as well as the exposure of the general population during activities of daily living.
Floods and heavy rain were associated with leptospirosis in almost all studies investigating these risk factors (n = 17). This is consistent with the increasing number of outbreaks reported during flooding events and it can be considered as one of the
28 main risk factors in tropical countries (Lau et al., 2010). In addition they hypothesize that due to global warming, extreme weather events will occur with increasing frequency and intensity worldwide. Thus, the risk of flooding events is expected to increase leading to an expected increasing leptospira transmission risk.
Living in rural areas was associated with increased risk of leptospirosis infection in studies comparing rural and urban residents. This result was unrelated to geographic study location, which means the risk is higher in rural areas for developed countries as well as resource poor countries.
Thus, leptospirosis risk has also to be considered globally in the perspective of climate change.
3.2. Prevalence of leptospira among rodents in SEA:
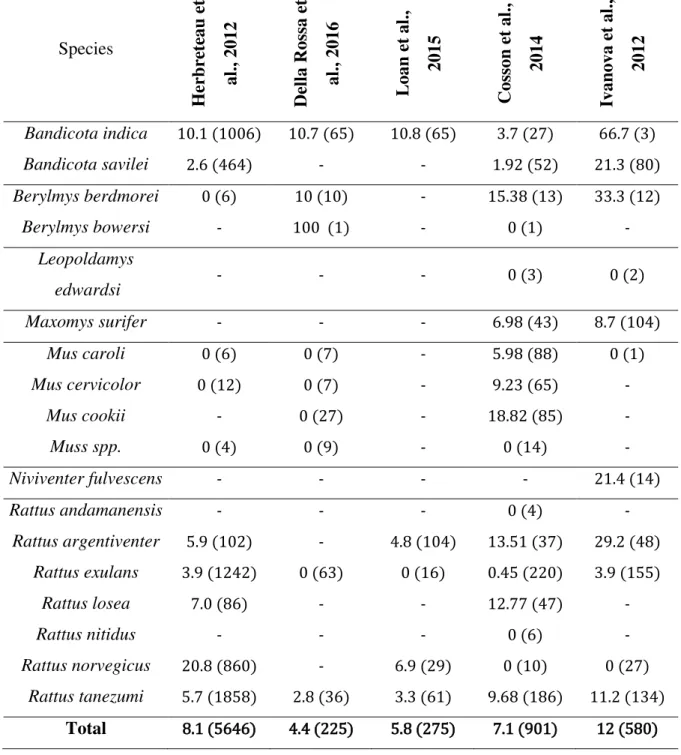
The mean prevalence of leptospira among rodents in SEA varies from one study to another: from 4.4% (Della Rossa et al., 2016) to 7.1% (among 901 total rodents sampled) (Cosson et al., 2014) and even 12% (with 580 rodents sampled) (Ivanova et al., 2012). Morand et al. (2015), combined rodents‟ leptospirosis studies conducted in Thailand and estimated an overall prevalence of 8.1% among rodents. Details per species are shown in the following table 1 – A. associated with the main information about the study design (table 1 – B.).
3.3. Risk factors of rodents infections:
3.3.1. Flooding season
A clear seasonality pattern, with higher prevalence for Leptospira infections of rodent species during the flooding season has been showed by Ivanova et al., (2012). They showed that the wet season is favorable for transmission of Leptospira in rodents, particularly in rain-fed fields.
3.3.2. Host species
29 Cosson et al. (2014) conducted a study in seven localities in SEA (three in Thailand, two in Cambodia, two in Lao PDR) within four different habitats types (forested areas, non-floodable and floodable lands, human dwellings). Their results showed a large variation of the mean prevalence in rodents across localities and habitats, but not between rodent species. Leptospira prevalence was very low in human dwellings (2%) and when removed, Leptospira prevalence was similar between floodable areas, forests and non-floodable agricultural fields.
However, another study showed that species living in forests and in non-flooded habitats, such as Berylmys berdmorei and Niviventer fulvescens, have similar level of infection to species inhabiting rice fields (i.e. with low slope values) (Ivanova et al., 2012).
These two studies suggest that not only rice fields but forests, secondary forests, and their interface with agricultural fields are also areas of potential risk for leptospirosis infection in humans. Thus it challenges the idea that leptospires mainly circulate in wetlands.
3.3.2.2. Rodent infection and species
The level of detection of leptospira in the different species presents considerable differences (Ivanova et al., 2012 ; Herbreteau et al., 2012 ; Cosson et al., 2014 ; Loan et al., 2015). Bandicota spp. and Rattus spp. are reported to be important hosts of leptospires of human health importance. Moreover, high prevalence was observed in rarely investigated species such as Niviventer
fulvescens, whereas on the contrary, Mus spp. appeared to be not infected (Ivanova
et al., 2012).
It has been suggested that the observed differences in prevalence may reflect differences in population densities, rather than intrinsic differences in susceptibility among species (Cosson et al., 2014). Differences in sample size, species distribution, as well as in laboratory methods for determining prevalence complicate comparisons across studies.
30 Ivanova et al., (2012) confirmed that prevalence of infection increases with age, a result consistent with a chronic and unlethal disease for rodents as previously mentioned. Males were significantly more likely to be infected than females (Cosson et al., 2014). Moreover, Loan et al. (2015) identified rat size (those in the fourth quantile of body size) as having an increased risk of testing positive (OR = 3.74).
31
Table 1 - Comparison of leptospirosis prevalence among rodents of 5 studies conducted in SEA. A. Leptospirosis prevalence per species – results are a percentage (total number of sampled animal into brackets) B. Main study design characteristics (next page).
A Species Her b re te au e t al., 2012 De ll a Rossa e t al., 2016 L oan e t al., 2015 Cosson e t al., 2014 Ivan ova e t al., 2012 Bandicota indica 10.1 (1006) 10.7 (65) 10.8 (65) 3.7 (27) 66.7 (3) Bandicota savilei 2.6 (464) - - 1.92 (52) 21.3 (80) Berylmys berdmorei 0 (6) 10 (10) - 15.38 (13) 33.3 (12) Berylmys bowersi - 100 (1) - 0 (1) - Leopoldamys edwardsi - - - 0 (3) 0 (2) Maxomys surifer - - - 6.98 (43) 8.7 (104) Mus caroli 0 (6) 0 (7) - 5.98 (88) 0 (1) Mus cervicolor 0 (12) 0 (7) - 9.23 (65) - Mus cookii - 0 (27) - 18.82 (85) - Muss spp. 0 (4) 0 (9) - 0 (14) - Niviventer fulvescens - - - - 21.4 (14) Rattus andamanensis - - - 0 (4) - Rattus argentiventer 5.9 (102) - 4.8 (104) 13.51 (37) 29.2 (48) Rattus exulans 3.9 (1242) 0 (63) 0 (16) 0.45 (220) 3.9 (155) Rattus losea 7.0 (86) - - 12.77 (47) - Rattus nitidus - - - 0 (6) - Rattus norvegicus 20.8 (860) - 6.9 (29) 0 (10) 0 (27) Rattus tanezumi 5.7 (1858) 2.8 (36) 3.3 (61) 9.68 (186) 11.2 (134) Total 8.1 (5646) 4.4 (225) 5.8 (275) 7.1 (901) 12 (580)
32 B Her b re te au e t al., 2012 L oan e t al., 2015 De ll a Rossa e t al., 2016 Cosson e t al., 2014 Ivan ova e t al., 2012 Samples location Compiled surveys of microparasites in rodents trapped - Thailand Vietnam, Mekong Delta Northern Thaïland 7 areas among Thailand, Lao PDR, Cambodia Cambodia (2 provinces) Types of habitats studied Markets (5), Farms (20), Edge of rice fields (6), Tropical forest - Natural Park (with
large numbers of canals) (4)
4 habitats: forest, non-flooded and flooded lands, humans settlements
Study period
Dry season, rainy season only for market samples 2009-2010 Dry and rainy season Laboratory analyses used RT - PCR RT - PCR RT-PCR targetting lipL32 gene RT-PCR Mérien et al protocol (1992) identified saprophytic leptospires
4. Future research recommendations
A working group on land-use change and disease emergence published an article on policy recommendations as regards further research on landscape
33 fragmentation and infectious disease (Patz et al., 2004). They advised the acquisition of key data on pathogen load of wildlife, as well as the relative abundance of organisms (vectors, pathogens, hosts). These key information would unable the understanding of fragmentation‟s consequences and disease ecology.
Moreover, given the high heterogeneity of risk factors identified by the recent review from Mwachui et al. (2015), general recommendations for designing effective healthcare interventions are difficult to address. More knowledge is needed. Indeed, they highlighted the fact that the role of rodents was surprisingly understudied in SEA (2 studies out of their 64 selected studies). Even if we know that the underlying rodent population dynamic feeds environmental contamination, they advised that future epidemiological studies should address ecological, climatic and rodent demographic components for a more detailed understanding of habitat role. Authors also suggested that future attempts to develop leptospirosis transmission models should primarily address environmental water related exposures as a main driver for transmission (Mwachui et al., 2015).
As well, very few knowledge is available as regards epidemiology of leptospira among wild communities of rodents, pathogen and host dynamic. Also, whether environmental conditions determine Leptospira species distribution in nature remains largely unexplored (Cosson et al., 2014).
4.1. The concept of chronotone to study land-use change
Disease transmission is a dynamic and complex process which can be explained by a multitude of factors including the structure and organization of social and ecological systems but also the public health system (Scoones, 2017).
What happens during the transition period between two states at the equilibrium? The reorganization phase separating these two states is illustrated by the conceptual model below.
The concept of ecotone has been a very much useful tool to study mechanisms happening at the interface between two ecosystems. However, it becomes limited once we want to integrate the chronology sequence happening between two steady-states of ecosystems. Thus, the concept of chronotone, as introduced by Bradley