OATAO is an open access repository that collects the work of Toulouse
researchers and makes it freely available over the web where possible
Any correspondence concerning this service should be sent
to the repository administrator:
[email protected]
This is a Publisher’s version published in:
http://oatao.univ-toulouse.fr/26099
To cite this version:
Tavakkoli, Mohammad and Flahaut, Emmanuel
and Peljo, Pekka and Sainio,
Jani and Davodi, Fatemeh and Lobiak, Egor V. and Mustonen, Kimmo and
Kauppinen, Esko I. Mesoporous Single-Atom-Doped Graphene–Carbon
Nanotube Hybrid: Synthesis and Tunable Electrocatalytic Activity for Oxygen
Evolution and Reduction Reactions. (2020) ACS Catalysis, 10 (8). 4647-4658.
ISSN 2155-5435
Mesoporous Single-Atom-Doped Graphene
−Carbon Nanotube
Hybrid: Synthesis and Tunable Electrocatalytic Activity for Oxygen
Evolution and Reduction Reactions
Mohammad Tavakkoli,
*
Emmanuel Flahaut, Pekka Peljo, Jani Sainio, Fatemeh Davodi, Egor V. Lobiak,
Kimmo Mustonen, and Esko I. Kauppinen
Cite This:ACS Catal. 2020, 10, 4647−4658 Read Online
ACCESS
Metrics & More Article Recommendations*
sı Supporting InformationABSTRACT: Mesoporous heteroatom-doped carbon-based nanomaterials are very promising as catalysts for electrochemical energy conversion and storage. We have developed a one-step catalytic chemical vapor deposition method to grow a highly graphitized graphene nanoflake (GF)−carbon nanotube (CNT) hybrid material doped simultaneously with single atoms of N, Co, and Mo (N−Co−Mo− GF/CNT). This high-surface-area material has a mesoporous structure, which facilitates oxygen mass transfer within the catalyst film, and exhibits a high electrocatalytic activity and stability in oxygen reduction and evolution reactions (ORR and OER) in alkaline media. We have shown that in this metal (M)−N−C catalyst, M (Co, Mo)−C centers are the main sites responsible for OER, while, for
ORR, both M and N−C centers synergistically serve as the active sites. We systematically investigated tuning of the ORR and OER activity of the porous catalyst depending on the choice of the underlying substrate. The ORR kinetic current and OER activity for N−Co−Mo−GF/CNT were significantly enhanced when the catalyst was deposited onto a Ni substrate, resulting in an advanced electrocatalytic performance compared to the best bifunctional ORR/OER catalysts reported so far. Using a developed scanning electrochemical microscopy analysis method, we demonstrated that the higher OER reactivity on Ni was attributable to the formation of underlying catalyst/Ni interfacial sites, which are accessible due to the porous, electrolyte-permeable structure of the catalyst.
KEYWORDS: single-atom electrocatalysis, heteroatom doping, graphene−carbon nanotube hybrid, mesoporous electrocatalyst, oxygen reduction/evolution reaction, substrate effect, scanning electrochemical microscopy
1. INTRODUCTION
The need for low-cost electrocatalysts based on earth-abundant materials, rather than critical noble metals, such as Pt, Ru, and Ir, for catalyzing oxygen reduction reaction (ORR) and oxygen evolution reaction (OER) has motivated a large body of research. ORR and OER are the most important electro-chemical reactions that limit the efficiencies of fuel cells, water electrolyzers, and metal−air batteries. An ORR or OER electrode comprises three main components: (i) an electro-catalystfilm composed of active sites for catalysis, (ii) a catalyst support, which is typically made of high-surface-area and porous carbon-based materials that can enhance the number of active sites on the surface and improve the conductivity of the catalyst, and (iii) a conductive substrate on which the electrocatalyst (or catalyst/support) is deposited. All three components require a rational design for the production of advanced electrodes for electrochemical energy storage and conversion devices.
Among various nonprecious electrocatalysts, nitrogen (N)-doped carbon materials (N−C) have recently evolved into metal-free ORR and OER catalysts.1,2The catalytic activity of
N−C electrocatalysts for ORR3−6 and OER7 can be further improved by codoping with transition metals (M−N−C catalysts). M−N−C catalysts are generally synthesized by pyrolysis of a mixture of nitrogen-containing chemicals, transition metal inorganic salts, and carbon-based supporting materials.8Carbon-supporting materials for fuel cell electrodes should possess high porosity, high conductivity, a large surface area, and high electrochemical stability.4,9,10Porous materials facilitate electrolytic mass transport through the electrode and increase accessibility to the active sites.2,3 For oxygen mass transfer, mesopores (pore size 2−50 nm) are superior to micropores (pore size <2 nm).11,12 Mesoporous structures enhance the portion of electrochemically available active sites,3 and they have been reported to be promising porous
Received: January 21, 2020
Revised: March 9, 2020
Published: March 20, 2020
Research Article
pubs.acs.org/acscatalysis
© XXXX American Chemical Society
4647
https://dx.doi.org/10.1021/acscatal.0c00352
ACS Catal. 2020, 10, 4647−4658
This is an open access article published under a Creative Commons Attribution (CC-BY)
License, which permits unrestricted use, distribution and reproduction in any medium, provided the author and source are cited.
electrodes,12−14which can activate extra active sites within the pores and enhance the electrocatalytic activity for ORR. Recently, N-doped mesoporous carbons containing transition metals have been reported to be promising bifunctional electrocatalysts for ORR/OER15 and water electrolysis.16 Carbon black has been widely utilized as the catalyst support due to its high availability and low cost; it nevertheless contains a high number of micropores, which hinder oxygen transport in the electrocatalyst and reduce the accessibility of active sites.4,10 Carbon black also contains an abundance of dangling bonds and defects, which can easily form surface oxides, resulting in corrosion under electrochemical oxida-tion.17 In contrast, catalyst supports that consist of a highly graphitized carbon structure, such as carbon nanotubes (CNTs) and graphene, are reported to be more stable.10,17,18 CNTs and graphene have high conductivity and can be doped by heteroatoms, which differ from carbon in their electro-negativity. The heteroatom doping of graphitic carbon nanomaterials, regardless of whether the dopant has a lower (as B, P, S, and transition metals) or higher (as N) electronegativity than that of carbon, can polarize adjacent carbon atoms, change the electronic properties of carbon skeletons,2,19and improve the catalytic activity of carbon-based electrocatalysts for various electrochemical reactions, including ORR20−22 and OER.23,24 Therefore, designing high-surface-area mesoporous M−N−C electrocatalysts using CNT and graphene supports is a promising route to producing highly active and robust materials for catalyzing ORR and OER.
Graphene−CNT hybrid nanomaterials have demonstrated promising performance in various applications.25−31 The simultaneous growth of graphene and CNT has, however, rarely been reported,26,27,32−34 but typically resulted in graphitic structures with a relatively high number of defects. In graphene−CNT hybrid films, the CNTs form a conductive framework to which the graphene flakes adhere, significantly improving overall conductivity.26,32 Due to an increase in tunneling efficiency, the conductivity of a graphene−CNT hybrid can surpass that of a CNT film.35 Here, we report a synthesis method that produces a high-quality graphene−CNT hybrid in which the grapheneflakes are doped with N, Co, and Mo heteroatoms for enhanced electrocatalytic performance.
Substrates over which electrocatalysts are deposited play an important role in defining electrocatalytic activity. The substrate can modify the surface morphology, porosity, electronic structure, and conductivity of electrocatalysts.36,37 For ORR, the role of the substrate has not been well studied in alkaline media. However, experimental investigations have shown that the OER electrocatalytic activities of manga-nese,38,39 cobalt,40 and Ni-based41 oxides, as well as Fe (oxy)hydroxide,42 NiCeOx,43 and amorphous Co(OH)244 in
alkaline media are dramatically improved using an AuOx/Au
substrate instead of commonly used glassy carbon (GC). The Au substrate can potentially diffuse into the electrocatalyst film.43
An electrocatalyst possessing a porous, electrolyte-permeable structure furthermore provides access to underlying active sites,42,45 allowing the formation of metal oxide−gold interfacial sites that catalyze the OER at lower overpotentials than metal oxide sites.43Ni foam has also been widely used in recent years for the enhancement of the OER activity of various electrocatalysts.46 However, Ni foam offers a large active surface area and a highly continuous porous three-dimensional (3D) network enhancing accessibility to the active
comparison with other substrates difficult, as it is unclear how much activity is enhanced by the formation of catalyst/ substrate interfacial active sites, relative to the influence of the structure and morphology of the substrate.
Here, we introduce a facile and scalable one-step synthesis method for the production of a novel electrocatalyst composed of few-layer graphene nanoflakes (GFs) and CNTs doped with N, Co, and Mo heteroatoms (N−Co−Mo−GF/CNT). In catalysis science, the newfield of single-atom catalysts (SACs) with isolated metal atoms dispersed on solid supports has attracted wide research attention because of the maximum atom-utilization efficiency and unique properties of SACs.47 Among SACs, those with carbon-based48and particularly with graphene or graphene-like49 supports are widely investigated catalysts because of the extraordinary physicochemical proper-ties of such supports. However, owing to the high surface energy of single atoms, immobilization of atomic metal centers on the support for the fabrication of SACs has been challenging.47 Here, in contrast to other synthetic strategies for SACs,47−49the SAC is produced during the synthesis of the carbon support (GF/CNT), providing a facile one-step synthesis process for the fabrication of high-performance SACs without any extra cost arising from the immobilization process of the single-atom metals on the support. This high-surface-area mesoporous catalyst shows high ORR and OER activities in alkaline media. Furthermore, we have systemati-cally investigated the role of Ni, Au, and GCflat disk substrates on the ORR and OER catalytic activities of a high-performance mesoporous catalyst (N−Co−Mo−GF/CNT) in comparison to well-established ORR and OER catalysts such as Pt/C and RuO2, respectively. Our study of substrate effects on the OER
and ORR catalytic activity of porous materials establishes a basis for the rational design of electrodes with optimized activity and provides guidelines for future studies.
2. RESULTS AND DISCUSSION
2.1. Synthesis of Catalyst Materials. N−Co−Mo−GF/ CNT was synthesized by modifying a catalytic chemical vapor deposition (CCVD) method50that was initially developed for the scalable synthesis of CNTs. The CCVD synthesis of the CNTs is a chemical vapor deposition (CVD) process in which the carbon precursor molecules are catalytically decomposed at high temperatures on the surface of a metallic support that acts as the catalyst for the growth of CNTs. The mesoporous N− Co−Mo−GF/CNT catalyst was prepared using a CCVD synthesis reactor as depicted inFigure 1. The synthesis process has been optimized to grow a GF/CNT hybrid via a one-step synthesis process. Briefly, Mg0.99(Co1−xMox)0.01O (x∼ 0.25)
was used as the catalyst to synthesize graphitic carbon nanomaterials. This catalyst was developed previously for the synthesis of double-walled CNTs.50,51Using this catalyst, the growth of crumpled graphene structures has been also observed during the CCVD synthesis of the CNTs,51probably by the direct catalytic decomposition of CH4 on MgO
oxide.51,52In this work, the growth conditions were optimized to grow a graphene−CNT hybrid material rather than CNTs or graphene layers. The catalyst was prepared by combustion synthesis of a stoichiometric mixture of (NH4)6Mo7O24·4H2O,
magnesium and cobalt nitrates, and citric acid fuel as explained in refs 50 and53. The catalyst powder was then placed in a furnace under aflow of 205 sccm H2and 45 sccm CH4. The furnace temperature was increased from ambient temperature
room temperature. The heating and cooling were performed at a rate of 5 °C min−1. For the nitrogen-doped material, acetonitrile was introduced into the reactor by bubbling the feedstock of hydrogen and methane (total flow rate = 250 sccm) through an impinger containing anhydrous acetonitrile for 6 min with the furnace temperature at 1000°C so that ∼1 mL acetonitrile was utilized in this process. The time during which the N source was introduced into the synthesis reactor was extremely short in comparison to the overall growth time of the material. Hence, the sample synthesized without N heteroatoms (denoted the Co−Mo−GF/CNT sample) would likely have a similar structure to that synthesized with N dopants, except for the N heteroatoms in part of the graphitic carbon network.
After cooling to room temperature, the sample was processed with an aqueous solution of HCl to dissolve the remaining catalyst powder and unprotected catalytic nano-particles. The sample was washed with deionized water until a neutral pH was obtained. After washing, the wet sample was frozen and then dried by lyophilization. During this process, only those metallic atoms/nanoparticles that were firmly embedded in the graphitic carbon network were protected against dissolution in the acid. After this step, inductively coupled plasma atomic emission spectroscopy (ICP-AES) revealed 4.96 and 1.65 wt % for Co and Mo, respectively, in
the N−Co−Mo−GF/CNT hybrid material (see details of the elemental analysis in theSupporting Information).
The resulting material was dispersed in ethanol (5 mg mL−1) using ultrasound sonication for 1 h, followed by magnetic stirring for 3 days, so that a homogeneous ink was formed. This ink was used for the material characterizations and the electrochemical measurements.
2.2. Characterization of the Synthesized Material. 2.2.1. Atomic Resolution Electron Microscopy Character-ization. High-resolution transmission electron microscopy
(HR-TEM) images of the N−Co−Mo−GF/CNT hybrid
material are shown in Figure 2a,b, where the presence of 50−70 nm GFs is visible. Scanning TEM (STEM) was also employed (Figure 2c−h), in which an angstrom-sized 60 keV
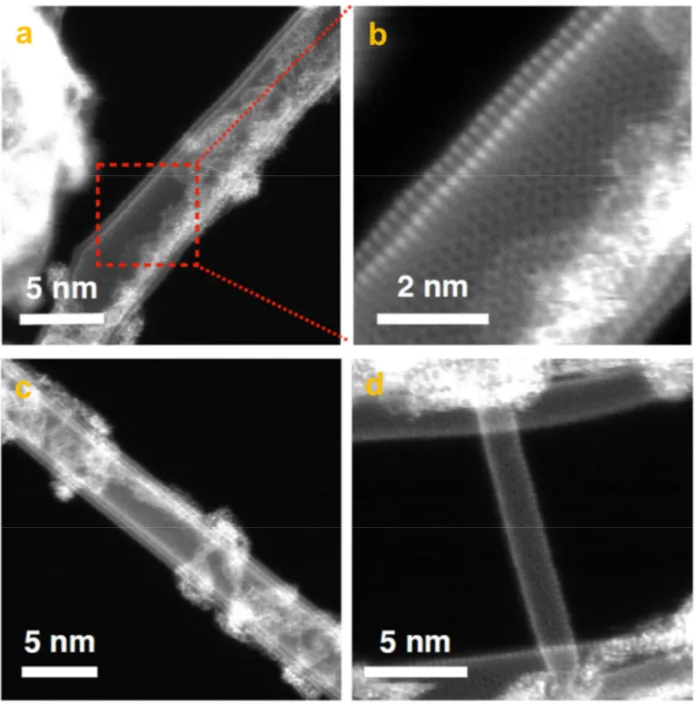
electron probe was raster-scanned over the sample, and images were recorded with high- or medium-angle annular dark-field (HAADF and MAADF) detectors. Electron energy loss spectroscopy (EELS) with single-atom precision was also performed. The signals from the detectors and EELS can be obtained simultaneously, allowing direct correlation of images and spectroscopic data. In MAADF and especially HAADF imaging, the contrast of the image is highly sensitive to the atomic number or the mass of nuclei (contrast images). Z-contrast allows individual heavy atoms and small metallic nanoparticles to be distinguished from the low-Z carbon support based on their brightness.54−58 Here, both annular detectors were used, and elemental identification at the atomic resolution was conducted by EELS as has been previously done for heteroatom-doped graphene and CNTs.54,55,59,60 Figure 2c,d demonstrates how the CNTs bridge the graphene nanoflakes, leading to the expected improvement in the material conductivity. Metallic Co and Mo atoms were not detected in the monolayer graphene (Figure 2e,f), whereas N was identified directly from the STEM image, for which the corresponding EELS point spectrum is shown in Figure S1.
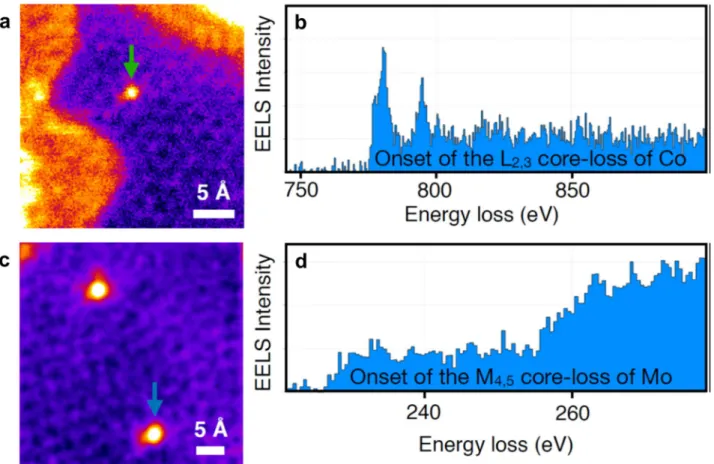
Figure 1f demonstrates the presence of pentagon and heptagon rings in the hexagonal crystalline structure leading to strain-related corrugation in the structure of GFs. In contrast to monolayer GFs, individual metal atoms were identified in multilayers, as is evident in Figures S2 and 2g,h. Figure S2
shows example STEM images of Co and Mo heteroatoms with corresponding EELS maps. In a binary collision with a 60 keV Figure 1.Scheme of the synthesis reactor used for the growth of the
N−Co−Mo−GC/CNT and Co−Mo−GC/CNT materials (MFC is an abbreviation for massflow controller). The schematic illustration of the N−Co−Mo−GC/CNT sample is based on high-resolution scanning transmission electron microscopy (STEM) images and electron energy loss spectroscopy (EELS) analysis.
Figure 2.(a, b) HR-TEM and (c−h) STEM images of N−Co−Mo−GF/CNT. (a) TEM image of 30−50 nm GFs and (b) few-layer GF, (c, d) STEM image of the GFs interconnected by CNTs, with (d) showing CNTs bridging the GFs, (e, f) high-resolution STEM images taken from a graphene monolayer, showing the honeycomb structure, and (g, h) STEM images of double- or few-layer GFs. Individual metal atoms are observed as bright spots on the carbon support.
ACS Catalysis pubs.acs.org/acscatalysis Research Article
https://dx.doi.org/10.1021/acscatal.0c00352
ACS Catal. 2020, 10, 4647−4658
electron, >1 eV in-plane kinetic energy can be transferred to a heavy nucleus such as that of Co,61which is enough to activate adatom diffusion in few-layer graphene encapsulation. The fact that the metal atoms remained completely stable during our STEM experiments serves as a strong indication of their covalent nature. STEM images taken from the CNTs in the N−Co−Mo−GF/CNT material are shown in Figure S3. No metallic dopants were observed in the sidewall of CNTs, hinting that the CNTs are mainly a conductive network bridging the GFs for efficient electron transport, rather than providing additional active M−C sites for electrocatalysis.
Figure S4 shows single-, double-, and few-layer graphene nanoflakes in the synthesized material. In some parts of the sample, Co and Mo nanoparticles were also detected. The frequency at which the particles were observed was never-theless much lower than that of the individual metallic atoms, as is also visible inFigure S5.
2.2.2. Raman Spectroscopy. Raman spectroscopy is a powerful method that allows the detection of graphitization in carbon nanomaterials. Generally, the Raman spectra of sp2
-hybridized carbon exhibit major spectral components emerging from defects (D-band at 1300−1360 cm−1) and in-plane G-band vibrations at 1570−1600 cm−1.62−64Earlier studies have shown that the disorder-induced D-band is increased when the graphitic carbon lattice is doped with foreign atoms.64Figure 3
shows the Raman D- and G-bands of Co−Mo−GF/CNT with and without N heteroatom doping. The highly crystalline sp2
carbon structure of the Co−Mo−GF/CNT sample is reflected in its relatively low ID/IG ratio of 0.06. Nitrogen doping increased the ID/IGratio to 0.1, which can be attributed to the
substitution of N heteroatoms in the graphitic carbon. The observed ratio is significantly lower than that reported for other synthesized graphene−CNT hybrids in the litera-ture.25−27,31−33 This demonstrates that the synthesis method reported here allows the production of conductive heteroatom-doped graphene−CNT structures with higher quality than has previously been possible.
2.2.3. Pore-Size Analysis. Figure S6 shows the nitrogen adsorption−desorption isotherm of N−Co−Mo−GF/CNT, which exhibits a typical IV-type isotherm curve with a distinct hysteretic loop associated with capillary condensation taking place in the mesopores.65,66The shape of the hysteretic loop
nonrigid aggregates of platelike particles.66Figure S6shows the cumulative pore volume and pore-size distributions of the N− Co−Mo−GF/CNT calculated using the Barrett−Joyner− Halenda (BJH) method, revealing an average pore width of 11.5 nm. Moreover, a high specific surface area of 911 m2g−1 was measured using the Brunauer−Emmett−Teller (BET) method.
2.3. Oxygen Reduction Activity and Discussion. To evaluate the activity of the N−Co−Mo−GF/CNT catalyst for ORR on various Ni, Au, and GC substrates, rotating disc electrode (RDE) voltammetry measurements were carried out at different rotation rates in 0.1 M KOH (see details of the electrochemical procedures in the Supporting Information).
Figure 4a demonstrates the ORR linear sweep voltammetry
(LSV) comparison of N−Co−Mo−GF/CNT and conven-tional Pt/C 20 wt % on different substrates at a rotation of 1600 rpm. The corresponding ORR Tafel plots are depicted in
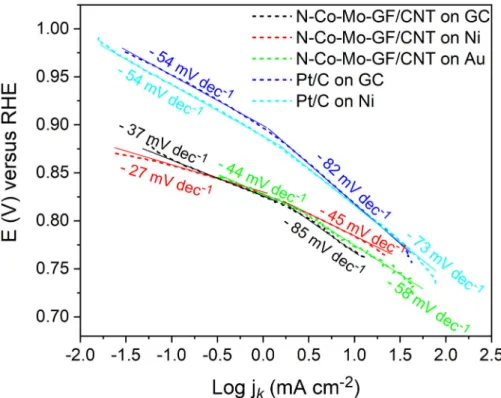
Figure S7. The prepared catalyst exhibited a remarkable ORR catalytic activity on all of the substrates with a half-potential of ∼0.83 V, and an onset potential of ∼0.9 V relative to the reversible hydrogen electrode (RHE). The ORR Tafel slopes for the N−Co−Mo−GF/CNT catalyst were 27, 37, and 44 mV dec−1on Ni, GC, and Au substrates, while, for Pt/C, they were 54 mV dec−1on both GC and Ni substrates (Figure S7). The kinetic current and the number of electrons involved per O2in the ORR on N−Co−Mo−GF/CNT were calculated based on the Koutecky−Levich (K−L) equation, as explained in the Supporting Information. The ORR LSV polarization curves at various rotation rates (400, 700, 900, 1200, 1600, 2000, and 2500 rpm) for N−Co−Mo−GF/CNT on GC, Ni, and Au substrates and for Pt/C on GC and Ni substrates, together with the corresponding linear K−L plots through the inverse current density (j−1) as a function of the inverse of the Figure 3. Raman spectra obtained from N−Co−Mo−GF/CNT
(black line) and Co−Mo−GF/CNT (red dashed line) samples. The spectra show a low ID/IGratio for the one-step synthesized graphene/
CNT hybrids, reflecting the high level of graphitization of the samples. The data are normalized with respect to G-band intensities.
Figure 4.(a) ORR polarization curves in an O2-saturated 0.1 M KOH
solution at 1600 rpm and (b) ORR kinetic currents and number of transferred electrons obtained at 0.7 V vs RHE for N−Co−Mo−GF/ CNT on GC, Ni, and Au substrates, as well as for Pt/C on GC and Ni substrates.
Figure S8. The kinetic current density (jk), measured from the
y-intercept of linear K−L plots at a potential of 0.7 V vs RHE, is depicted in Figure 4b. For the N−Co−Mo−GF/CNT on various substrates, jkincreased from 91 mA cm−2on GC to 129
mA cm−2 on Ni, but decreased to 61 mA cm−2 on the Au substrate. Similarly, for Pt/C, the improvement in jkon GC vs
the Ni substrate was significant, so that jkincreased from 66 to 133 mA cm−2. These results show that the Ni substrate can considerably improve the ORR kinetic current for both Pt/C and N−Co−Mo−GF/CNT catalysts, rendering Ni a promis-ing substrate for alkaline ORR. The correspondpromis-ing number of transferred electrons on all tested substrates was close to 4 (Figure 4b), indicating that the ORR was dominated by a four-electron process.
Retention of the ORR current was approximately 97% under 0.70 V for 21 h using the N−Co−Mo−GF/CNT electro-catalyst, showing higher stability than Pt/C (Figure S9). The N−Co−Mo−GF/CNT electrocatalyst also exhibited an improved ORR catalytic activity and stability in comparison to the previously reported multi-heteroatom-doped porous carbon catalyst.67 The activity of this catalyst for ORR is comparable to that of the best heteroatom-doped carbon nanomaterials,2 nonprecious M−N−C,3,4,68−71 and single-(and few-) atom72 ORR electrocatalysts reported so far in terms of the ORR half-wave potential, kinetic current density, and stability.
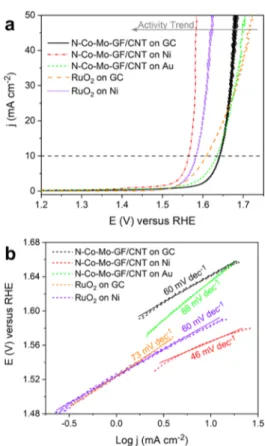
2.4. Oxygen Evolution Activity and Discussion. The electrocatalytic activity of N−Co−Mo−GF/CNT for OER was also investigated by RDE measurements in 0.1 M KOH. The OER polarization curves of the prepared catalyst on GC, Ni, and Au substrates are compared with a well-established water oxidation catalyst, RuO2, on GC and Ni substrates in Figure
5a. On the GC substrate, RuO2 exhibited a slightly higher activity at low current densities (<20 mA cm−2) than N−Co− Mo−GF/CNT. However, at high current densities (≫20 mA cm−2), the synthesized catalyst suppressed RuO2tested in this
work so that it required a potential of 1.68 V, rather than 1.72 V for RuO2, to reach a current of 50 mA cm−2. In contrast to
manganese- and cobalt-based oxides38−41,44 and NiCeOx,
43
which demonstrate drastic improvements in activity for OER when the surface or substrate is enriched with Au, we did not observe a significant enhancement of activity with an Au substrate. Nevertheless, the OER activity of the N−Co−Mo− GF/CNT catalyst was remarkably enhanced when it was coated on a Ni substrate. The onset overpotential and the required overpotential to reach 10 mA cm−2 (ηOER,10)
decreased by ∼50 and ∼77 mV, respectively, on Ni in comparison to the GC substrate. For RuO2, the onset
overpotential over Ni was similar to that over GC, but the ORR current improved and the ηOER,10was ca. 26 mV lower.
Nonetheless, for the N−Co−Mo−GF/CNT catalyst, which has a high-surface-area mesoporous structure, the electrolyte can more readily permeate the underlying layers and the Ni/ catalyst interface, where a synergistic effect occurs, forming new active sites with a higher reactivity and a lower onset overpotential. Figure S10 illustrates the synergistic effect between the Ni substrate and the N−Co−Mo−GF/CNT electrocatalyst for enhancing activity for OER. The OER Tafel plots of the prepared catalyst and RuO2are shown in Figure
5b. The Tafel slope values for the N−Co−Mo−GF/CNT catalyst on Ni, Au, and GC substrates follow a trend of Ni < GC < Au, where a lower slope indicates a more active electrode. RuO2 also had a lower Tafel slope on Ni than on
GC. Since the Tafel slope is related to the reaction mechanism, the difference perhaps arises from a change in the rate-determining step of the OER.
The N−Co−Mo−GF/CNT catalyst on Ni required over-potentials of just 330 and 350 mV to reach 10 and 50 mA cm−2 (denoted ηOER,10 and ηOER,50), respectively. The catalyst’s performance upon a 24 h continuous operation at 20 mA cm−2 was also highly stable (Figure S11). The OER electrocatalytic performance of N−Co−Mo−GF/CNT on Ni was close to that reported previously for highly active OER electrocata-lysts,2,73−78especially at high currents.
Substrate effects enhancing the OER activity of RuO2have recently been reported.79 Here, we demonstrated that for a mesoporous electrolyte-permeable catalyst, such as N−Co− Mo−GF/CNT, the role of the substrate could be more significant. We believe that this represents a route to further developing the activity of mesoporous carbon-based catalysts through the addition of suitable active metals to the substrate, or to the surface of the catalyst, where new active sites are formed at the metal/catalyst interface.
Hence, the high-surface-area mesoporous N−Co−Mo−GF/ CNT hybrid material represents a stable ORR/OER electro-catalyst with a high activity that can be further improved using a Ni substrate. This catalyst exhibited an advanced electro-catalytic performance in terms of both ORR and OER activities compared to the best bifunctional ORR/OER catalysts reported in the literature.2,80−85
2.5. Active Sites for Oxygen Evolution and Reduction Reactions. 2.5.1. Active Sites Over the Glassy Carbon Substrate. The C−C sites in pristine graphene and CNTs are almost catalytically inactive. Carbon nanomaterials doped by heteroatoms, however, form new active sites that can activate Figure 5.(a) OER polarization curves and (b) corresponding OER Tafel plots of the N−Co−Mo−GF/CNT catalyst on GC, Ni, and Au compared to Pt/C on GC and Ni substrates in 0.1 M KOH.
ACS Catalysis pubs.acs.org/acscatalysis Research Article
https://dx.doi.org/10.1021/acscatal.0c00352
ACS Catal. 2020, 10, 4647−4658
them for ORR20−22and OER.23,24In the case of the N−Co− Mo−GF/CNT catalyst as an M−N−C catalyst, the N−C and/ or the M (Co, and Mo)−C sites act as the active sites for ORR and OER. To find out whether the N−C and/or M−C sites are responsible for the observed activity, an electrocatalyst was synthesized without the temporary introduction of acetonitrile, thus lacking a nitrogen source (see Section 2.1above). This material is denoted Co−Mo−GF/CNT.
The comparison of the ORR activity of the Co−Mo−GF/ CNT and N−Co−Mo−GF/CNT samples (Figures 6a and
S12) revealed that the material without N sites remained active for ORR, but that its activity was considerably lower than that in the presence of N heteroatoms. In comparison, doping with N sites resulted in an ORR half-wave potential increase of∼50 mV and a 7-fold enhancement in kinetic current density (from 13 to 91 mA cm−2 at 0.7 V). Meanwhile, the number of
transferred electrons also increased from 3.2 to 4 (Figure S12). This change in ORR activity indicates that both the N−C and M−C sites are synergistically responsible for ORR activity.
The comparison of the OER activity of the Co−Mo−GF/ CNT and N−Co−Mo−GF/CNT samples is shown inFigure 6b. Doping with N sites increased theηOER,10andηOER,50by 27
and 13 mV, respectively, indicating that the sample without N has slightly higher OER activity than the N-doped sample. The Tafel slope of the N-doped sample is, however, slightly lower than that without N (Figure S13). We can, therefore, conclude that the main OER active sites in the N−Co−Mo−GF/CNT are likely to be the M−C sites. The slight decrease in OER activity after doping with N heteroatoms can be attributed to the increase in the number of defect sites in the graphitic network, which is also corroborated by Raman spectroscopy (Figure 3). The stability of Co−Mo−GF/CNT for OER was also tested by a chronopotentiometry measurement at 20 mA cm−2, where a stable performance upon continuous operation for 12 h was observed (Figure S14).
2.5.2. Active Sites over the Ni Substrate. 2.5.2.1. X-ray Photoelectron Spectroscopy (XPS): Investigating the Possi-bility of Ni Diffusion into the Catalyst Film, and Changes in Catalyst Surface Composition during Electrocatalysis. XPS was used to study the chemical composition of the N−Co− Mo−GF/CNT sample. Figure 7 shows the cobalt 2p, molybdenum 3d, and nitrogen 1s regions of the sample both before and after electrochemical ORR and OER measure-ments. The related carbon 1s, oxygen 1s, and survey spectra, as well as atomic concentrations, are provided in the Supporting Information (Figure S15 and Table S1).
Figure 7a displays the Co 2p spectra of the N−Co−Mo− GF/CNT sample. The Co 2p3/2 peak has been deconvoluted assuming the presence of two chemical states: Co(0) and Co(II).86In the pristine material, mainly Co(0) is found at a 2p3/2binding energy of 778.1 eV, but a ca. 25% contribution of Co(II) is also required to explain the spectra. The binding energies and spectral shape correspond to Co(0). After OER, a typical Co 2p spectrum of Co(II) is observed, with a 2p3/2
peak at roughly 780.24 eV,86 and a small contribution from Co(0) is still observed at∼778 eV.
The Mo 3d spectra are shown inFigure 7b. The spectra have been deconvoluted, assuming the presence of Mo(0) and Mo(VI).87In the pristine material, the spectrum shows a clear 3d5/2peak at 228.2 eV corresponding to Mo(0) and another 3d5/2 peak at roughly 232.3 eV corresponding to Mo(VI).87
The 3d3/2peak of Mo(0) at roughly 231.3 eV overlaps with the
Mo(VI) 3d5/2peak. The 3d3/2peak of Mo(VI) is found at a binding energy of 235.5 eV. After ORR/OER, the Mo 3d Figure 6.Effect of N heteroatoms on the ORR and OER activities of
the N−Co−Mo−GF/CNT electrocatalyst. (a) ORR and (b) OER polarization curves of Co−Mo−GF/CNT compared to that of N− Co−Mo−GF/CNT. The polarization curves were obtained in a 0.1 M KOH solution at a scan rate of 5 mV s−1and a 1600 rpm rotation speed. The electrocatalysts were deposited on a GC substrate.
Figure 7. X-ray photoelectron spectra of the N−Co−Mo−GF/CNT catalyst before (black lines) and after (red lines) the ORR and OER
spectrum is dominated by an overlapping sulfur 2s peak at roughly 232.9 eV, which is attributed to sulfate impurities from the electrolyte. Some Mo(0) is still observed, but its contribution has been clearly reduced (see Table S1 in the Supporting Information). Also, the lack of a 3d3/2 peak at 235.54 eV related to Mo(VI) indicates that the amount of oxidized molybdenum has significantly decreased.
The oxidation of Co and Mo after OER measurements can be attributed to the Co and Mo nanoparticles that were initially encapsulated in carbon layers but oxidized during the OER. During the OER, the graphene layers that protect the metal nanoparticles can be stripped off (Figure S16) due to the presence of highly reactive pentagonal rings and significant strain on the C−C bonds. This causes permeation of the electrolyte into the metal core and subsequent oxidation.77 The decrease in the amount of Mo after the electrochemical measurements can be attributed to the anodic dissolution of molybdenum in the alkaline solution.88
Figure 7c shows high-resolution N 1s spectra of the N−Co− Mo−GF/CNT sample before and after the electrochemical measurements. The spectra have been deconvoluted assuming a generally used model with the following N-functional groups: pyridinic-N (ca. 398.3 eV), pyrrolic-N (ca. 400.1 eV), graphitic-N (ca. 400.9 eV), and other N species (ca. 403− 405 eV).89,90The peak in binding energies between 403 and 405 eV can be attributed to various oxidized nitrogen configurations, clustered N substitutions, hydrogenation of the nitrogen dopants, and N2molecules trapped inside carbon
nanotubes or between graphene layers.89 The relative concentrations of the different nitrogen species in the pristine sample were 38% pyridinic-N, 35% graphitic-N, and 27% other N species. After OER, the pyrrolic-N component was also required for a satisfactoryfit, yielding relative concentrations of 25% pyridinic-N, 26% pyrrolic-N, 25% graphitic-N, and 24% other N species. The XPS analysis of the N−Co−Mo−GF/ CNT sample revealed the presence of 1 atom % N before and after ORR/OER measurements (Table S1).
According to earlier experimental work with graphene nanoribbon networks doped with nitrogen, the electron-donating graphitic-N moieties serve as active sites for ORR, while the electron-withdrawing pyridinic-N sites are respon-sible for OER.1Here, however, we could not verify that the N moieties served as the active sites for OER, but, instead, we observed that single metal atoms in the grapheneflakes were the main sites responsible for OER.
To detect possible Ni diffusion from the substrate into the N−Co−Mo−GF/CNT film during electrochemical measure-ments, the catalyst material over the Ni substrate was transferred onto an Au substrate after the ORR/OER measurements. This prevented substrate Ni detection in the XPS measurements. In these measurements, Ni was not detected, meaning that Ni did not diffuse into the catalyst during the electrochemical measurements. This is in clear contrast to what has been observed for NiCeOxdeposited onto
an Au electrode, in which XPS depth profiles demonstrated that Au from the substrate could diffuse into the catalyst film.43 2.5.2.2. Scanning Electrochemical Microscopy (SECM) Analysis: Unraveling Where the OER Reaction Takes Place on the Ni Substrate. The OER takes place on the catalyst surface and/or in the underlying layers where new sites are formed at the substrate/catalyst interface. To study where the OER reaction actually takes place, scanning electrochemical microscopy (SECM) was used. SECM is a scanning probe technique capable of imaging local reactivity at a high spatial resolution. Here, using SECM, we established that the enhanced OER activity of N−Co−Mo−GF/CNT over the Ni (rather than the GC) substrate was due to newly formed interfacial sites, thus yielding a synergistic effect.
Figure S17 shows the theoretical approach curves of the SCEM tip for the positive (enhancement in the tip current) and negative (reduction in the tip current) feedbacks, as well as the overlay of the experimental approach curves for the tip on
Ni and on the N−Co−Mo−GF/CNT mesoporous film
deposited on Ni. A similar response was also observed on the GC substrate (data not shown here). A negative feedback to the tip ORR current was observed over both GC and Ni when approaching the surface (Figure S17) because the substrate can block the flux of the oxygen to the Pt tip. In contrast, for the N−Co−Mo−GF/CNT mesoporous film, a positive feedback on the Pt tip was observed, as illustrated in
Figure S17. This indicates that some oxygen was trapped within the catalyst layer due to hydrophobicity or the porous surface structure of the GFs and CNTs. A similar observation has been reported when approaching a porous poly(vinylidene fluoride) membrane.91
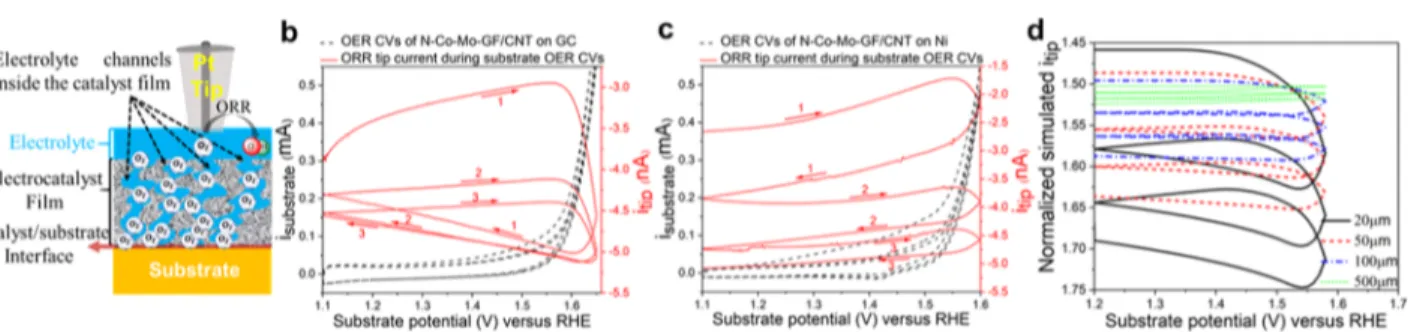
As the tip depletes oxygen from the solution, oxygen from the porous film partitions into the solution, resulting in similar behavior to that observed when approaching a water−air interface.92−94 The simulations described in the Supporting Information and Figures S17 and S18were conducted to reproduce the positive feedback for Figure 8. (a) Schematic representation of the Pt SECM tip for approaching the electrocatalyst surface to observe the feedback from the electrocatalyst and substrate, as well as O2diffusion from the substrate/catalyst interface to the tip. (b, c) Results of substrate generation−tip
collection experiments, where the substrate potential was scanned to the OER region at a scan rate of 5 mV s−1, while the tip potential was kept at a constant value of 0.3 V to drive ORR. The tip was placed close to the surface of N−Co−Mo−GF/CNT on (b) GC and (c) Ni substrates. (d) Simulated transient tip ORR currents obtained for the experimental OER CVs in (c) for the several oxygen diffusion distances, showing that a similar ORR tip current response to that experimentally measured in (c) is reproduced if the OER takes place significantly further from the catalyst top surface, at approximately 5μm from the tip. The tip current in (d) is normalized by the ORR current in the bulk.
ACS Catalysis pubs.acs.org/acscatalysis Research Article
https://dx.doi.org/10.1021/acscatal.0c00352
ACS Catal. 2020, 10, 4647−4658
the tip approach curve over a porous catalyst, which traps oxygen molecules within the porous layer. Mass transport in porous electrodes has been studied previously95by SECM, but not with gaseous species partitioning into the porous electrode. The simulated approach curve reproduced well the exper-imentally observed positive feedback to the ORR tip current that was obtained on the N−Co−Mo−GF/CNT electro-catalyst surface as shown inFigure S17. The oxygen from the film could be depleted by applying a sufficiently low potential (∼0−0.3 V vs RHE) to the substrate for reducing oxygen. When this was done with the Pt tip (kept at 0.3 V vs RHE) near the substrate, the ORR tip current approached zero. Interestingly, when the substrate potential was removed, after a sufficient time, a positive feedback was again observed when approaching the mesoporous film. This indicates that the dissolved oxygen from the solution can partition into the porous electrode, thus restoring the initial situation.
In the substrate generation−tip collection (SG−TC) mode of SECM, as schematically shown in Figure 8a, oxygen that evolves on the substrate during the OER is subsequently reduced and detected on the probe tip placed close to the substrate surface.96 When OER cyclic voltammetry (CV) is carried out on the substrate, the ORR current response on the SECM tip will vary depending on the distance between the tip and the sites at which OER takes place on the substrate.96 Here, depending on how the SECM tip current responds to the formation of O2on the substrate, we can interpret whether
the OER takes place within the catalyst layer or at the catalyst/ substrate interface. This approach can hence confirm whether the enhanced activity of N−Co−Mo−GF/CNT over the Ni (rather than the GC) substrate is indeed due to newly formed interfacial sites with a synergistic effect.
The SG−TC SECM experiments were carried out with the N−Co−Mo−GF/CNT catalyst deposited on GC (Figure 8b) and Ni (Figure 8c) substrates. The substrate potential was scanned to the OER region, while the tip potential was kept at a constant value of 0.3 V to drive the ORR sufficiently. The experimental results inFigure 8c show that it took much longer for oxygen to reach the tip when Ni was used as the substrate, resulting in a stepwise increase in the tip current. When GC was used as the substrate, the response was more immediate but also decayed much faster. This indicates that when Ni was used as the substrate, the evolved oxygen remained in the catalyst layer, while, on GC, the oxygen was released faster. To simulate this effect qualitatively, the oxygen diffusion distance to the tip was varied between 20 and 500μm by increasing the thickness of the porous layer, as shown in Figure 8d. Simulations showed that when the diffusion distance was small, the tip response was fast, and the decay in the current was also more rapid. When the distance increased, however, the time for oxygen to reach the tip was greater, leading to a similar response to that observed experimentally on the Ni substrate (Figure 8c). This indicates that on GC, oxygen evolution takes place close to the catalyst surface and/or the oxygen is released rapidly from the catalyst layer. Meanwhile, on the Ni substrate, OER takes place deeper in the catalyst layer (seeScheme S1). These results indicate that OER, in fact, takes place close to the electrocatalyst/Ni interface, where new active sites can be formed with a higher OER electrocatalytic activity than that of sites on the catalyst surface. These results are in good agreement with an earlier report by Snook et al.96 They demonstrated that by increasing the distance between
immediately decrease when the OER current on the substrate is reduced during the backward scan of OER CV, due to the time required for the oxygen generated at the substrate to diffuse to the probe tip. As a result, when the O2 diffusion length from the substrate is increased, the ORR on the tip also takes place later than the OER onset potential.96 This also explains why the ORR tip current in Figure 8b increases at almost the same time at which the substrate starts to produce O2 (at OER onset potential), while, in Figure 8c, the
enhancement in the tip current takes place later than O2 production on the substrate. These SG−TC SECM experi-ments thus provide a novel technique to observe where the electrocatalytic reaction takes place in porous multilayer electrocatalysts.
3. CONCLUSIONS
In summary, a high-surface-area mesoporous hybrid of graphene nanoflakes and CNTs doped with single atoms of N, Co, and Mo has been synthesized using a fast and scalable, low-cost one-step chemical vapor deposition process. The material shows high activity and stability for catalyzing ORR and OER in alkaline media. In the prepared catalyst, we demonstrate that N−C sites do not serve as the main active sites for OER activity, although they do have a synergistic effect with M−C sites, thus enhancing activity for ORR. We have further demonstrated how the use of Ni, Au, and GC substrates affects the electrocatalytic activity of the synthesized catalyst for ORR and OER. The use of a Ni substrate, in comparison to GC and Au, increases the ORR kinetic current and significantly improves the OER activity of the mesoporous catalyst. Based on XPS analysis, no Ni diffusion from the substrate to the porous catalyst was detected during the electrochemical measurements. Instead, enhanced electro-catalytic activity is attributed to the catalyst/Ni interfacial sites that are accessible through the pores of the electrocatalyst film. By applying the developed SECM analysis method, we further confirm that instead of the catalyst surface, a significant amount of the evolved O2 at the low overpotentials during
OER originated from the underlying catalyst/Ni interface. We have thus established a new catalyst for alkaline OER and ORR with tunable reactivity depending on the choice of the underlying substrate, which opens new avenues for the growth of heteroatom-doped graphene−CNT hybrids for various applications.
■
ASSOCIATED CONTENT*
sı Supporting InformationThe Supporting Information is available free of charge at
https://pubs.acs.org/doi/10.1021/acscatal.0c00352.
STEM and TEM images; N2 adsorption/desorption
isotherms; additional electrochemical ORR and OER measurements; additional details on electrochemical procedures, physical, and chemical characterizations; XPS; SECM analysis; and related references (PDF)
■
AUTHOR INFORMATIONCorresponding Author
Mohammad Tavakkoli− Department of Applied Physics, Aalto University School of Science, FI-00076 Aalto, Finland;
orcid.org/0000-0003-4859-1922;
Phone: +358504140950; Email:mohammad.tavakkoli@
Authors
Emmanuel Flahaut− CIRIMAT, Université de Toulouse, CNRS, INPT, UPS, UMR CNRS-UPS-INP No 5085, Université Toulouse 3 Paul Sabatier, 31062 Toulouse, France Pekka Peljo− Research Group of Physical Electrochemistry and
Electrochemical Physics, Department of Chemistry and Material Sciences, Aalto University School of Chemical Engineering, FI-00076 Aalto, Finland; orcid.org/0000-0002-1229-2261
Jani Sainio− Department of Applied Physics, Aalto University School of Science, FI-00076 Aalto, Finland
Fatemeh Davodi− Department of Chemistry and Material Sciences, Aalto University School of Chemical Engineering, FI-00076 Aalto, Finland
Egor V. Lobiak− Nikolaev Institute of Inorganic Chemistry, SB RAS, 630090 Novosibirsk, Russia; orcid.org/0000-0001-5085-5531
Kimmo Mustonen − Faculty of Physics, University of Vienna, 1090 Vienna, Austria; orcid.org/0000-0002-0953-7299
Esko I. Kauppinen− Department of Applied Physics, Aalto University School of Science, FI-00076 Aalto, Finland;
orcid.org/0000-0003-1727-8810
Complete contact information is available at:
https://pubs.acs.org/10.1021/acscatal.0c00352
Notes
The authors declare no competingfinancial interest.
■
ACKNOWLEDGMENTSThis work has been supported by the Academy of Finland (ANCED project) and the Magnus Ehrnooth Foundation. The authors also thank Prof. Kari Laasonen for fruitful discussions and Dr. Hua Jiang for taking the TEM images.
■
REFERENCES(1) Yang, H. B.; Miao, J.; Hung, S.-F.; Chen, J.; Tao, H. B.; Wang, X.; Zhang, L.; Chen, R.; Gao, J.; Chen, H. M.; Dai, L.; Liu, B. Identification of catalytic sites for oxygen reduction and oxygen evolution in N-doped graphene materials: Development of highly efficient metal-free bifunctional electrocatalyst. Sci. Adv. 2016, 2, No. e1501122.
(2) Paul, R.; Du, F.; Dai, L.; Ding, Y.; Wang, Z. L.; Wei, F.; Roy, A. 3D Heteroatom-Doped Carbon Nanomaterials as Multifunctional Metal-Free Catalysts for Integrated Energy Devices. Adv. Mater. 2019, 31, No. 1805598.
(3) Lee, S. H.; Kim, J.; Chung, D. Y.; Yoo, J. M.; Lee, H. S.; Kim, M. J.; Mun, B. S.; Kwon, S. G.; Sung, Y.-E.; Hyeon, T. Design Principle of Fe−N−C Electrocatalysts: How to Optimize Multimodal Porous Structures? J. Am. Chem. Soc. 2019, 141, 2035−2045.
(4) Yan, X.-H.; Xu, B.-Q. Mesoporous carbon material co-doped with nitrogen and iron (Fe−N−C): high-performance cathode catalyst for oxygen reduction reaction in alkaline electrolyte. J. Mater. Chem. A 2014, 2, 8617−8622.
(5) Wu, G.; More, K. L.; Johnston, C. M.; Zelenay, P. High-Performance Electrocatalysts for Oxygen Reduction Derived from Polyaniline, Iron, and Cobalt. Science 2011, 332, 443−447.
(6) Parvez, K.; Yang, S.; Hernandez, Y.; Winter, A.; Turchanin, A.; Feng, X.; Müllen, K. Nitrogen-Doped Graphene and Its Iron-Based Composite As Efficient Electrocatalysts for Oxygen Reduction Reaction. ACS Nano 2012, 6, 9541−9550.
(7) Davodi, F.; Mühlhausen, E.; Tavakkoli, M.; Sainio, J.; Jiang, H.; Gökce, B.; Marzun, G.; Kallio, T. Catalyst Support Effect on the Activity and Durability of Magnetic Nanoparticles: toward Design of Advanced Electrocatalyst for Full Water Splitting. ACS Appl. Mater. Interfaces 2018, 10, 31300−31311.
(8) Wu, G.; Johnston, C. M.; Mack, N. H.; Artyushkova, K.; Ferrandon, M.; Nelson, M.; Lezama-Pacheco, J. S.; Conradson, S. D.; More, K. L.; Myers, D. J.; Zelenay, P. Synthesis−structure− performance correlation for polyaniline−Me−C non-precious metal cathode catalysts for oxygen reduction in fuel cells. J. Mater. Chem. 2011, 21, 11392−11405.
(9) Dicks, A. L. The role of carbon in fuel cells. J. Power Sources 2006, 156, 128−141.
(10) Sharma, S.; Pollet, B. G. Support materials for PEMFC and DMFC electrocatalystsA review. J. Power Sources 2012, 208, 96− 119.
(11) Yarlagadda, V.; Carpenter, M. K.; Moylan, T. E.; Kukreja, R. S.; Koestner, R.; Gu, W.; Thompson, L.; Kongkanand, A. Boosting Fuel Cell Performance with Accessible Carbon Mesopores. ACS Energy Lett. 2018, 3, 618−621.
(12) Park, J.; Nabae, Y.; Hayakawa, T.; Kakimoto, M.-a. Highly Selective Two-Electron Oxygen Reduction Catalyzed by Mesoporous Nitrogen-Doped Carbon. ACS Catal. 2014, 4, 3749−3754.
(13) Proietti, E.; Jaouen, F.; Lefèvre, M.; Larouche, N.; Tian, J.; Herranz, J.; Dodelet, J.-P. Iron-based cathode catalyst with enhanced power density in polymer electrolyte membrane fuel cells. Nat. Commun. 2011, 2, No. 416.
(14) Liang, H.-W.; Wei, W.; Wu, Z.-S.; Feng, X.; Müllen, K. Mesoporous Metal−Nitrogen-Doped Carbon Electrocatalysts for Highly Efficient Oxygen Reduction Reaction. J. Am. Chem. Soc. 2013, 135, 16002−16005.
(15) Ding, J.; Wang, P.; Ji, S.; Wang, H.; Linkov, V.; Wang, R. N-doped mesoporous FeNx/carbon as ORR and OER bifunctional
electrocatalyst for rechargeable zinc-air batteries. Electrochim. Acta 2019, 296, 653−661.
(16) Ding, J.; Ji, S.; Wang, H.; Linkov, V.; Gai, H.; Liu, F.; Liu, Q.; Wang, R. N-Doped 3D Porous Ni/C Bifunctional Electrocatalysts for Alkaline Water Electrolysis. ACS Sustainable Chem. Eng. 2019, 7, 3974−3981.
(17) Shao, Y.; Yin, G.; Zhang, J.; Gao, Y. Comparative investigation of the resistance to electrochemical oxidation of carbon black and carbon nanotubes in aqueous sulfuric acid solution. Electrochim. Acta 2006, 51, 5853−5857.
(18) Antolini, E.; Gonzalez, E. R. Ceramic materials as supports for low-temperature fuel cell catalysts. Solid State Ionics 2009, 180, 746− 763.
(19) Hu, C.; Liu, D.; Xiao, Y.; Dai, L. Functionalization of graphene materials by heteroatom-doping for energy conversion and storage. Prog. Nat. Sci.: Mater. Int. 2018, 28, 121−132.
(20) Yang, L.; Jiang, S.; Zhao, Y.; Zhu, L.; Chen, S.; Wang, X.; Wu, Q.; Ma, J.; Ma, Y.; Hu, Z. Boron-Doped Carbon Nanotubes as Metal-Free Electrocatalysts for the Oxygen Reduction Reaction. Angew. Chem. 2011, 123, 7270−7273.
(21) Yang, Z.; Yao, Z.; Li, G.; Fang, G.; Nie, H.; Liu, Z.; Zhou, X.; Chen, Xa.; Huang, S. Sulfur-Doped Graphene as an Efficient Metal-free Cathode Catalyst for Oxygen Reduction. ACS Nano 2012, 6, 205−211.
(22) Jin, J.; Pan, F.; Jiang, L.; Fu, X.; Liang, A.; Wei, Z.; Zhang, J.; Sun, G. Catalyst-Free Synthesis of Crumpled Boron and Nitrogen Co-Doped Graphite Layers with Tunable Bond Structure for Oxygen Reduction Reaction. ACS Nano 2014, 8, 3313−3321.
(23) Davodi, F.; Tavakkoli, M.; Lahtinen, J.; Kallio, T. Straightfor-ward synthesis of nitrogen-doped carbon nanotubes as highly active bifunctional electrocatalysts for full water splitting. J. Catal. 2017, 353, 19−27.
(24) Ma, T. Y.; Dai, S.; Jaroniec, M.; Qiao, S. Z. Graphitic Carbon Nitride Nanosheet−Carbon Nanotube Three-Dimensional Porous Composites as High-Performance Oxygen Evolution Electrocatalysts. Angew. Chem., Int. Ed. 2014, 53, 7281−7285.
(25) Yan, Z.; Ma, L.; Zhu, Y.; Lahiri, I.; Hahm, M. G.; Liu, Z.; Yang, S.; Xiang, C.; Lu, W.; Peng, Z.; Sun, Z.; Kittrell, C.; Lou, J.; Choi, W.; Ajayan, P. M.; Tour, J. M. Three-Dimensional Metal−Graphene− Nanotube Multifunctional Hybrid Materials. ACS Nano 2013, 7, 58− 64.
ACS Catalysis pubs.acs.org/acscatalysis Research Article
https://dx.doi.org/10.1021/acscatal.0c00352
ACS Catal. 2020, 10, 4647−4658
[Electronic Supporting Information]
Mesoporous Single-Atom-Doped Graphene‒Carbon Nanotube Hybrid: Synthesis and
Tunable Electrocatalytic Activity for Oxygen Evolution and Reduction Reactions
Mohammad Tavakkoli,1,* Emmanuel Flahaut,2 Pekka Peljo,3Jani Sainio,1 Fatemeh Davodi,4 Egor V. Lobiak,5
Kimmo Mustonen,6 Esko I. Kauppinen 1
1 Department of Applied Physics, Aalto University School of Science, P.O. Box 15100, FI-00076 Aalto, Finland
2 CIRIMAT, Université de Toulouse, CNRS, INPT, UPS, UMR CNRS-UPS-INP N°5085, Université Toulouse 3 Paul Sabatier, Bât. CIRIMAT, 118, route de Narbonne, 31062 Toulouse cedex 9, France
3 Research group of Physical Electrochemistry and Electrochemical Physics, Department of Chemistry and Material Sciences, Aalto University School of Chemical Engineering, P.O. Box 16100, FI-00076 Aalto, Finland.
4 Department of Chemistry and Material Sciences, Aalto University School of Chemical Engineering, P.O. Box 16100, FI-00076 Aalto, Finland.
5 Nikolaev Institute of Inorganic Chemistry, SB RAS, 630090 Novosibirsk, Russia
6 Faculty of Physics, University of Vienna, 1090 Vienna, Austria
*To whom correspondence should be addressed:
M. Tavakkoli (email: [email protected])
S2
Experimental section
Chemical and chemical Characterizations:
Elemental Analysis
Organic elemental microanalysis for C, H and N elements was performed by combustion of the
sample at 1050°C in a flux of He/O2. Carbon and hydrogen were transformed into CO2 and water,
respectively, separated using a chromatographic column, and measured using a thermal conductivity
detector. The uncertainty was 0.50 % for carbon, 0.30 % for nitrogen and 0.20 % for hydrogen.
Oxygen content was measured by total pyrolysis of the sample at 1080°C in an N2 flux. Oxygen in
pyrolysis compounds is transformed into CO by treatment with activated carbon at 1120°C, and CO
is then detected by IR spectroscopy. The uncertainty of the measurement was 0.30 %. This elemental
analysis resulted in relative abundances of 90.8, 2.2, and 0.3 wt% for C, O, and N, respectively, in
the N-Co-Mo-GF/CNT sample.
For the determination of metal content, the samples were wet mineralized
1and analyzed by
inductively coupled plasma atomic emission spectroscopy (ICP-AES) (CREALINS) with an
uncertainty of 2 %. The ICP-AES revealed 4.96 and 1.65 wt% of Co and Mo, respectively, in the
N-Co-Mo-GF/CNT catalyst.
Gas adsorption
The full adsorption/desorption isotherm of nitrogen was obtained using a Micromeritics TriStar II
3020 after degassing the sample 1h at 90°C and then 10h at 120°C.
Electron microscopy
For transmission electron microscopy (TEM) and scanning TEM (STEM) characterizations, the
catalyst material was dispersed in ethanol (0.01 mg/ml) and a 2 µl droplet of the solution was cast on
a carbon-coated TEM grid and dried in ambient air. The TEM observations were conducted in a
JEOL-2200FS double Cs-corrected high-resolution microscope at an acceleration voltage of 200 kV.
The STEM analysis was conducted in an aberration-corrected Nion UltraSTEM100 microscope in
Vienna, operated at an acceleration voltage of 60 kV with the sample in a 5×10
−10mbar vacuum. The
images were acquired with a medium angle annular dark field (MAADF) detector, except for Figure
S2, which was acquired with a high angle (HAADF) detector. The respective semiangles were 60–
200 mrad and 80-300 mrad. To reduce the influence of probe tails and to decrease the detector noise,
some images were pre-processed with a double Gaussian filtering procedure.
2Where necessary, the
image contrast was further improved by applying the ImageJ lookup table “fire”. The impurity atoms
were identified with electron energy loss spectroscopy (EELS). The acquisition setup consisted of a
Gatan PEELS 666 spectrometer retrofitted with an Andor iXon 897 electron-multiplying
charge-coupled device camera (for details of the method, see ref.
3-4).
Raman Analysis
The Raman spectra of N-Co-Mo-GN/CNT and Co-Mo-GN/CNT were measured with a 633 nm
excitation laser. Five spectra were measured at different places on the samples, and their average ID/IG
ratio was calculated. The reported spectra are those in which the ID/IG ratio was closest to the average
value.
XPS Analysis
X-ray photoelectron spectroscopy (XPS) was carried out using a Kratos Axis Ultra spectrometer with
monochromated Al Kα-radiation, pass energy of 40 eV, X-ray power of 150-225 W and an analysis
area of approximately 700 µm x 300 µm. The deconvolutions of the XPS spectra were carried out in
CasaXPS. The nitrogen 1s region was deconvoluted using Gaussian peaks with positions fixed to
within ±0.1 eV of given values, and the full width at half-maximum (FWHM) restricted to be equal.
However, the broader N-oxide peak was restricted to positions between 403 and 405 eV with the
FWHM restricted to below 4.5 eV. The deconvolution of the Co 2p3/2 peak was performed as done
previously by Biesinger et al.
5CoO parameters have been used for Co(II) but the spectra for different
Co(II) compounds, such as Co(OH)2 and CoOOH, are rather similar. In the deconvolution of the Mo
3d region, an asymmetric CasaXPS line shape LA(1.1,2.3,2) was used for Mo(0) and the default
GL(30) line shape was used for other peaks. For Co and Mo the peak positions were fixed to within
±0.1 eV of values in the literature.
5-6To transfer the N-Co-Mo-GF/CNT catalyst after ORR/OER measurements over the Ni substrate onto
an Au substrate for the XPS measurements, the electrode was first immersed in deionized water to
wash the excess electrolyte from the catalyst film. Then, before the film dried, it was detached from
the substrate using a scalpel. Then, the free-standing catalyst film floating in the water was transferred
on an Au substrate.
S4
Scanning Electrochemical Microscopy (SECM) Analysis
All the electrochemical measurements were performed at ambient temperature (20 ± 2 °C) under
aerobic conditions in a Faraday cage with a CHI900 electrochemical workstation (CH Instruments,
Austin, USA). A homemade glass-insulated Pt microelectrode (diameter = 10 μm, RG = 8) was used
for all measurements, while a saturated calomel electrode and a Pt mesh were used as reference and
working electrodes. Ni or GC electrodes (geometric surface area of 0.196 cm
2) were used as substrate
electrodes, and the catalyst was deposited on the substrate as described in the Electrochemical
Procedures section for the preparation of the samples for electrochemical measurements. After
deposition of the catalyst, approximately one third of the catalyst layer was removed to enable
simultaneous study of the catalyst layer and the underlying substrate electrode. Approach curves were
recorded at a rate of 1 μm s
−1with a 0.2 μm step, with the Pt tip potential set to 0.3 V vs RHE to allow
diffusion-limited reduction of dissolved oxygen. The oxygen reduction current on the Pt tip was give
time to stabilize
7before beginning the approach. Once the tip was close to the substrate (typically
normalized distance by the electrode radius < 1), the substrate potential was scanned to the oxygen
evolution region at a scan rate of 5 mV s
−1, while keeping the SECM probe tip at a sufficiently
negative potential (0.3 V vs RHE) to allow the diffusion-controlled oxygen reduction, in substrate
generation – tip collection mode.
Electrochemical Procedures
Electrocatalytic activity was investigated for the oxygen reduction and evolution reactions (ORR and
OER) by rotating disk electrode (RDE) and by using a standard three-electrode system in 0.1 KOH.
The reference and counter electrodes were a Standard Calomel Electrode, and an Iridium wire,
respectively. Glassy carbon (GC, purchased from PINE Research), Ni (99.99%, purchased from
Goodfellow), and Au (99.99 % purchased from Goodfellow) were polished and used as the RDE
working electrode tips with a similar geometric surface area of 0.196 cm
2. The ORR and OER
polarization curves were measured at a scan rate of 5 mV s
−1in an O2-saturated electrolyte. The OER
electrochemical measurements were carried out at a rotation of 1600 rpm, while the ORR
measurements were measured at various rotation rates (400, 700, 1200, 1600, 2000, and 2500 rpm).
The ORR polarization curves were obtained in an O2-saturated electrolyte and were corrected by
subtracting background current measured under identical conditions in an N2-saturated electrolyte to
exclusively analyze the ORR current.
8The catalyst inks were drop cast onto the different substrates
with a similar loading of ~ 0.2 mg cm
-2and dried in air. Subsequently, 25 µl of 5 wt% Nafion was
diluted with 1 ml of ethanol and 5 µl of that solution was added on top of the catalyst layers as a
binder. Before any measurements were taken, the electrodes were cycled 50 cycles at between 0 and
1.2 V versus RHE at a 50 mV s
‒1scan rate to stabilize the electrochemical response of the catalysts.
The uncompensated ohmic electrolyte resistance (Ru) used for the iR correction was determined using
electrochemical impedance measurements by equating Ru to the minimum total impedance in a
non-Faradaic region measured between 10 Hz and 100 kHz, where the capacitive and inductive
impedances are negligible and the phase angle was near zero.
Measurement of the kinetic current density and the number of transferred in the ORR
The kinetic current and the number of electrons involved per O2 in the ORR on the catalysts were
calculated based on the Koutecky–Levich equation:
1/j = 1/j
k+ 1/j
l= 1/j
k+ 1/Bω
1/2(1)
where j is the experimentally measured current density, j
kis the kinetic current density, j
lis the
diffusion-limited current density, and ω is the electrode rotating rate. The diffusion limiting current
equals Bω
1/2and B was calculated from the slope of the Koutecky–Levich (K–L) plots based on the
Levich equation:
B = 0.2nF(DO2)
2/3υ
-1/6CO2
(2)
where n represents the number of transferred electrons per oxygen molecule, F is the Faraday constant
(F=96485 C mol
-1), DO2 is the diffusion coefficient of O2 in 0.1 M KOH (1.9 × 10
-5cm
2s
-1), υ is the
kinetic viscosity (0.01 cm
2s
-1), and CO2 is the bulk concentration of O2
in 0.1 M KOH (1.2 × 10
-6mol
cm
-3). The constant 0.2 is used when the rotation speed is stated in rpm. The number of transferred
electrons per O2 was calculated by Equation (2) where B equals the inverse of the slope of linear K–
L plots.
S6
Figure S1. (a) A
STEM image of the N-Co-Mo-GF/CNT sample; (b) A high-resolution STEM image of a graphene monolayer, showing a nitrogen heteroatom substitution and (c) the corresponding EELS spectrum which confirms the presence of the N heteroatom in the graphitic lattice.Figure S2. (a) High-resolution STEM image of a Co atom in a graphene layer in the N-Co-Mo-GF/CNT sample with (b) the corresponding EELS map, confirming the presence of single-atom Co in the graphitic lattice. (c) High-resolution STEM image of a Mo atom in a graphene layer in the N-Co-Mo-GF/CNT sample with (d) the corresponding EELS spectra, confirming the presence of single-atom Mo in the graphitic lattice.
S8
Figure S3. High-resolution STEM image of the main types of CNTs observed: (a and b) double-walled CNTs, (c) a triple-walled CNT, and (d) a single-walled CNT in the N-Co-Mo-GF/CNT sample. The atomic resolution of the images does not show the presence of metallic single-atoms (Co and Mo) in the CNTs, but these are detected in graphene nanoflakes in the N-Co-Mo-GF/CNT sample.
Figure S4. STEM image of graphene nanoflakes, showing the presence of monolayer, bilayer, and few-layer graphene in the N-Co-Mo-GF/CNT hybrid material. The bilayer and few-layer graphene are discriminated based on their contrast difference with the monolayer graphene.
S10
Figure S5. (a) STEM image of N-Co-Mo-GF/CNT. The inset shows the EELS map of a Co particle on the sample. (b) A high-resolution STEM image of the area indicated in sub-panel (a), showing that the density of single-atom dopants is significantly higher than the density of nanoparticles in the N-Co-Mo-GF/CNT sample. (c) The EELS map of a bimetallic (Co and Mo) nanoparticle obtained from the indicated area in sub-panel (b).
Figure S6. (a) N2 adsorption (solid black dots) and desorption (open red dots) isotherms at 77 K. (b)
Cumulative pore volume and pore size distribution obtained using the BJH method from the adsorption branch of the N2 isotherm.
S12
Figure S7. ORR Tafel plots of N-Co-Mo/GF/CNT on GC (black), Ni (red), and Au (green), as well as Pt/C on GC (blue), and Ni (cyan).
Figure S8. ORR polarization curves obtained at 400 (black lines), 700 (blue lines), 900 (green lines), 1200 (cyan lines), 1600 (red lines), 2000 (violet lines), and 2500 (dark yellow lines) rpm for N-Co-Mo/GF/CNT on (a) GC, (b) Ni, and (c) Au substrates, as well as for Pt/C on (d) GC, and (e) Ni substrates. (f) K-L plots at 0.7 V for N-Co-Mo-GF/CNT on GC (black), Ni (red), and Au (green), as well as for Pt/C on GC (blue), and Ni (cyan) substrates.
S14
Figure S9. ORR chronoamperometry measurements at 0.7 V vs RHE obtained for N-Co-Mo-GF/CNT and Pt/C deposited on a glassy carbon (GC) substrate.
Figure S10.
OER polarization curves of N-Co-Mo-GF/CNT on GC and Ni substrates compared to that
of a bare Ni substrate, indicating the synergistic effect between the Ni substrate and the
N-Co-Mo-GF/CNT electrocatalyst for enhancing OER activity. The polarization curves were obtained in a 0.1M
KOH solution at a scan rate of 5 mV s
−1and 1600 rpm rotation speed.
S16
Figure S11. OER chronopotentiometry measurement at 20 mA cm‒2 obtained for N-Co-Mo-GF/CNT
Figure S12. Effect of N heteroatoms on the ORR activity of the N-Co-Mo-GF/CNT electrocatalyst. (a) ORR kinetic current densities obtained from Co-Mo-GF/CNT (dark yellow), N-Co-Mo-GF/CNT, (black), and Pt/C (blue); (b) RDE ORR polarization curves of the Co-Mo-GF/CNT measured at 400 (black line), 700 (blue line), 900 (green line), 1200 (cyan line), 1600 (red line), 2000 (violet line), and 2500 (dark yellow line) rpm; (c) K-L plot of Co-Mo-GF/CNT (dark yellow) compared to that of N-Co-Mo-GF/CNT (black), and Pt/C (blue). All the plots were obtained in an O2-saturated 0.1M KOH solution. The electrocatalysts were deposited on a GC
S18
Figure S13.
OER Tafel plots of Co-Mo-GF/CNT compared to that of N-Co-Mo-GF/CNT and RuO2
Figure S14. ORR chronopotentiometry measurement at 20 mA cm
‒2obtained for Co-Mo-GF/CNT
deposited on a GC substrate.
S20
X-ray photoelectron spectroscopy (XPS)
Figure S15a shows the C 1s spectra in which a typical graphitic carbon peak is observed at about
284.4 eV. The O 1s spectrum in Figure S15b for the pristine sample shows a rather broad feature
mainly consisting of two components at roughly 532 eV and 534 eV related to C=O and C-O bonds
(also possibly from OH-groups) respectively,
9and a shoulder peak at roughly 530.5 eV which could
be related to MoO3 observed in the Mo 3d spectrum. After the electrochemical measurements, this
peak related to MoO3 was no longer observed in the sample. Figure S15c shows the photoelectron
survey spectra of the pristine sample and after the ORR and OER measurements. In the sample taken
after the electrochemical measurements in 0.1 M KOH solution, potassium 2p peaks between 292 eV
and 298 eV can also be seen. The atomic concentrations are given in Table S1.
To detect whether there was Ni diffusion from the Ni substrate into the N-Co-Mo-GF/CNT catalyst
film during the OER measurements, the catalyst material was transferred from the Ni substrate onto
an Au substrate after the OER measurements. XPS spectra detected no Ni in the catalyst film (Table
S1), meaning that Ni did not diffuse from the substrate into the N-Co-Mo-GF/CNT catalyst during
the electrochemical measurements. The higher detected amount of Co after the electrochemical
measurements in Table S1 can be attributed to the removal of carbon layers surrounding Co
nanoparticles during the OER. The graphene layers around the metal nanoparticles can be stripped
off during the OER,
10so that less signal attenuation will be caused by the carbon encapsulation layers,
and hence, more Co can be detected on the surface by XPS as a surface analysis technique.
Figure S15. X-ray photoelectron spectra of the N-Co-Mo-GF/CNT electrocatalyst before (black) and after (red) the ORR and OER measurements on the Ni substrate: a) C 1s region, b) O 1s region and c) survey spectra.
Table S1. The atomic percentages of elements in the pristine N-Co-Mo-GF/CNT sample and after ORR/OER measurements of the sample on the Ni substrate. The error associated with each value is roughly ±10%.
*The amount of Mo was estimated roughly by peak fitting and removing the overlapping S 2s peak
Element
pristine
After ORR and OER
C (%)
97.1
82.3
O (%)
1.6
11.1
N (%)
1.0
1.0
Co (%)
0.13
0.53
Mo (%)
0.08
0.02*
F (%)
-
2.5
K (%)
-
2.0
S (%)
-
0.53
Impurities < 0.2 at-%
Cl
Cl, Si
S22
Figure S16. TEM images of N-Co-Mo-GF/CNT (a) before and (b-d) after ORR/OER measurements. Sub-panel (b) shows that graphene layers surrounding the metal nanoparticles in sub-Sub-panel (a) are