Any correspondence concerning this service should be sent
to the repository administrator:
[email protected]
This is an author’s version published in:
http://oatao.univ-toulouse.fr/27013
To cite this version: Yu, Minghao and Shao, Hui and Wang, Gang
and Yang, Fan and Liang, Chaolun and Rozier, Patrick and Wang,
Cai-Zhuang and Lu, Xihong and Simon, Patrice and Feng, Xinliang
Interlayer gap widened α-phase molybdenum trioxide as high-rate
anodes for dual-ion-intercalation energy storage devices. (2020)
Nature Communications, 11 (1). ISSN 2041-1723
Official URL
DOI :
https://doi.org/10.1038/s41467-020-15216-w
Open Archive Toulouse Archive Ouverte
OATAO is an open access repository that collects the work of Toulouse
researchers and makes it freely available over the web where possible
Interlayer gap widened
α-phase molybdenum
trioxide as high-rate anodes for
dual-ion-intercalation energy storage devices
Minghao Yu
1,7, Hui Shao
2,3,7, Gang Wang
1, Fan Yang
4, Chaolun Liang
5, Patrick Rozier
2,3,
Cai-Zhuang Wang
6, Xihong Lu
4, Patrice Simon
2,3✉
& Xinliang Feng
1✉
Employing high-rate ion-intercalation electrodes represents a feasible way to mitigate the inherent trade-off between energy density and power density for electrochemical energy storage devices, but efficient approaches to boost the charge-storage kinetics of electrodes are still needed. Here, we demonstrate a water-incorporation strategy to expand the interlayer gap of α-MoO3, in which water molecules take the place of lattice oxygen ofα-MoO3. Accordingly, the modified α-MoO3 electrode exhibits theoretical-value-close specific capacity (963 C g−1 at 0.1 mV s−1), greatly improved rate capability (from 4.4% to 40.2% at 100 mV s−1) and boosted cycling stability (from 21 to 71% over 600 cycles). A fast-kinetics dual-ion-intercalation energy storage device is further assembled by combining the modified α-MoO3anode with an anion-intercalation graphite cathode, operating well over a wide discharge rate range. Our study sheds light on a promising design strategy of layered materials for high-kinetics charge storage.
1Center for Advancing Electronics Dresden (cfaed) & Department of Chemistry and Food Chemistry, Technische Universität Dresden, 01062
Dresden, Germany. 2 CIRIMAT, Université de Toulouse, CNRS, Toulouse, France. 3 Réseau sur le Stockage Electrochimique de l’Energie (RS2E), CNRS, 3459
Amiens, France. 4 MOE of the Key Laboratory of Bioinorganic and Synthetic Chemistry, The Key Lab of Low-carbon Chem & Energy Conservation of Guangdong Province, KLGHEI of Environment and Energy Chemistry, School of Chemistry, Sun Yat-sen University, 510275 Guangzhou, China. 5 Instrumental Analysis and
Research Centre, Sun Yat-sen University, 510275 Guangzhou, China. 6 Ames Laboratory-U. S. Department of Energy, and Department of Physics and Astronomy, Iowa State University, Ames, IA 50011, USA. 7These authors contributed equally: Minghao Yu, Hui Shao. ✉email: [email protected]; [email protected]
T
riggered by a huge energy demand from various industries ranging from individual electronics to grid storage, elec-trochemical energy storage devices represent an activefield for both research development and practical applications1–4. Typically, supercapacitors and batteries differ in electrochemical mechanisms, hence featuring almost opposite energy and power characteristics5–8. However, the demand for power and energy supply is equally imperative in actual use and is keen to expand in the future. Thus it is highly desirable to design new electro-chemical energy storage technologies to mitigate the trade-off between power density and energy density9. Recently, the dual-ion energy storage (DIES) concept has attracted increasing attention as it holds different charge storage chemistry with the conventional “rocking-chair” mechanism10–13. In DIES devices, the electrolyte provides both cations and anions to be involved in charge storage. Graphitic carbon provides an ideal host for anion accommodation. The high anion-intercalating potential (>4.0 V vs. Li/Li+) and ultrafast rate capability (78% capacity retention, up to 100 C rate) enable graphitic carbon a promising cathode for constructing energy storage devices with both high energy and power densities14. Previous studies have proposed several new DIES devices by assembling graphite cathode with conventional battery-type anodes (such as Li metal14, graphite15, Al metal16, Sn metal17, WS218, etc.). However, the power performance of DIES devices is still limited, and there is great interest in designing high-rate pseudocapacitive anode to be combined with graphite cathode to assemble high-energy, high-power DIES device.Orthorhombic MoO3(α-MoO3) is composed of edge-sharing [MoO6] octahedra bilayers stacked along [010] by van der Waals (vdW) interaction. It has been considered as one of the most promising cation-intercalation materials due to its eco-friendliness and also high Mo6+/Mo4+ redox activity19,20. The Li+-intercalation reaction inα-MoO3involves both Mo6+/Mo5+ and Mo5+/Mo4+ redox couples, which makes α-MoO3 a pro-mising electrode for Li-ion storage with a theoretical capacity of 1005 C g−121. Also, the electrochemical potential for Li-ion intercalation (around 2–3 V vs. Li/Li+) is far below the
anion-intercalation potential of graphitic carbon (>4.0 V vs. Li/Li+), which suggests the promise for assembling DIES devices com-posed of MoO3 anode and graphite cathode. However, the widespread application of α-MoO3 is severely restricted by its modest electrochemical reaction kinetics due to the low charge/ ion transport efficiency, leading to poor rate capability of α-MoO3 electrodes19,22. In addition, the unfavorable phase transition of α-MoO3 electrode around 2.8 V vs. Li/Li+ during the initial lithiation process results in the distortion of layers and a rapid capacity decay during the cycling test23,24. To tackle these obstacles, previous studies employed approaches like constructing nanostructures25 and creating oxygen vacancy26 to obtain favorableα-MoO3electrode with pseudocapacitive charge storage behavior and acceptable cycling life. Nevertheless, those reported α-MoO3 electrodes presented unsatisfied areal capacity perfor-mance due to low electrode weight loading (e.g., 39 mC cm−2at 1 mV s−1 with mass loading of 40μg cm−2)26. Such low areal performance limits the practical interest of these electrodes in energy storage devices, since it would result in a drastic decrease in performance at the cell level27.
In this study, we widen the interlayer gaps of α-MoO3 by incorporating H2O molecules between vdW interlayers (α-MoO3 with expanded interlayer gaps is denoted as e-MoO3). The incorporated H2O molecules take the place of lattice O of α-MoO3 and expand the ionic channel dimension, which is evidenced by the obviously increased b-lattice parameter of e-MoO3 (15.02 Å) compared to α-MoO3 (13.85 Å). e-MoO3 elec-trode prepared from this approach exhibits a high specific capacity (963 C g−1or 578 mC cm−2at 0.1 mV s−1), remarkably
improved electrochemical reaction kinetics with boosted rate performance (e-MoO3 vs. α-MoO3: 40.2% vs. 4.4% capacity retention at 100 mV s−1) as well as cycling life (e-MoO3 vs. α-MoO3: 71% vs. 21% capacity retention over 600 cycles) during Li+storage. Finally, we assemble a DIES device combining a Li+-intercalation e-MoO3 anode together with a PF6− -inter-calation graphite cathode in 2 M LiPF6 electrolyte. Taking advantage of the fast-kinetics intercalation/de-intercalation pro-cesses at both anode and cathode, the as-assembled DIES device operates within a 1.0–3.5 V voltage window over a wide discharge rate range (discharge time from 25 s to 3.5 h), and shows high energy density (up to 44 Wh L−1based on the whole device) with decent power capability (600 W L−1).
Results
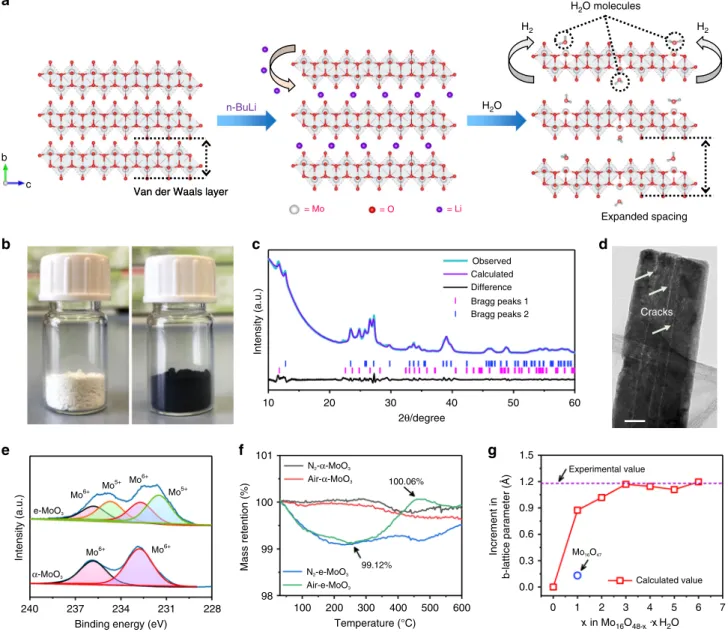
Expanding the interlayer gaps of α-MoO3. The procedure for expanding interlayer gaps of pristine α-MoO3 is described in Fig. 1a. α-MoO3 nanowires were first synthesized through a hydrothermal method and further immersed for 12 h in a solu-tion of n-butyllithium dissolved in hexane. Fast color change from white to dark blue was observed (Fig. 1b), suggesting the creation of reduced Mo species due to Li+ intercalation19,26. Afterwards, the sample was transferred into water, resulting in the oxidation of the sample by Li+ removal and simultaneous reduction of water into gaseous hydrogen. Thus the combination of reduction using n-butyllithium and oxidation using H2O leads to a complex process enlisting also a replacement of lattice oxygen by some H2O molecules, which enforces the expansion of the interlayer gaps.
The comparison of X-ray diffraction (XRD) patterns confirms the expansion of the interlayer space. The diffraction data of pristine α-MoO3 (Supplementary Fig. 1 and Supplementary Note 1) are indexed to JCPDS card no. 05-0508. It crystallizes in the orthorhombic system (SG: Pbnm) with the refined lattice parameters of a= 3.96 (6) Å, b = 13.85 (1) Å, c = 3.70 (5) Å. e-MoO3maintains similar peaks ofα-MoO3 with relatively broad peak width and, more importantly, shows (0k0) peaks shifted toward lower angles (Fig.1c). These peaks refer to an enlarged b value of 15.02 (3) Å, while a and c parameters stay almost unchanged (a= 4.08 (3) Å, c = 3.75 (2) Å). This result indicates an impressive expansion of the interlayer distance by 0.6 Å, largely higher than the 0.1 Å expansion reported for oxygen deficient α-MoO3compound26. Thus the wide interlayer distance in e-MoO3reported here is far above the interlayer distance solely induced by the oxygen vacancies. High-resolution transmission electron microscopic (TEM) and scanning electron microscopic (SEM) images (Fig.1d and Supplementary Fig. 2) confirm that
e-MoO3retains the nanowire structure but with a rougher surface with numerous cracks, in agreement with mechanical strains induced by the large expansion of interlayer space.
To elucidate the composition evolution along with interlayer gap expansion, Fourier transform infrared (FTIR) and Raman measurements have been conducted for α-MoO3 and e-MoO3 (Supplementary Fig. 3 and Supplementary Note 2). Compared with the FTIR and Raman peaks of MoO3, the remarkable change observed for e-MoO3 indicates the obvious crystal re-arrangement of the [MoO6] octahedra bilayers in e-MoO3. Electron paramagnetic resonance (EPR) spectra of bothα-MoO3 and e-MoO3 were measured at a low temperature of 90 K (Supplementary Fig. 4). In contrast toα-MoO3, e-MoO3displays an apparent signal with a g value of 1.93 and a line width of 49 Gs, which can be assigned to the presence of Mo5+donor levels close to the conduction band28,29. Consistent result is identified in Mo 3d X-ray photoelectron spectroscopy (XPS) data of e-MoO3 with newly appeared Mo5+3d 3/2 and 3d 5/2 peaks (234.7 and
231.5 eV, respectively, Fig. 1e)19,26. The atomic ratio between Mo5+and Mo6+reaches approximately 3:2. Comparison of O 1s XPS spectra (Supplementary Fig. 5) shows the presence of an extra peak at 532.4 eV for e-MoO3in addition to the peak located at 530.7 eV observed inα-MoO3which is characteristic of lattice oxygen30. This confirms the presence of incorporated H2O in e-MoO3 sample, and the atomic percentage of O in the incorporated H2O accounts for about 10% of total O atoms. No Li 1s signal is detected for e-MoO3, ruling out the possible pre-lithiation in e-MoO3 (Supplementary Fig. 6). This is consistent with the XRD patterns of e-MoO3after annealing in either N2or air, where no Li-containing compound is observed (Supplemen-tary Fig. 7 and Supplemen(Supplemen-tary Note 3). Thus, based on XPS analyses, the surface composition of e-MoO3 can be roughly estimated as MoO2.7·0.3 H2O. Thermogravimetry analysis (TGA, Fig. 1f) of e-MoO3 in the air was conducted to estimate the amount of incorporated H2O in the whole sample. It presents the
loss of intercalated water occurring at ~250 °C (mass retention of 99.12%) and the re-oxidation of oxygen-deficient MoO3 in the temperature range of 250–460 °C (mass retention of 100.06%), which is indicative of the formula MoO2.92·0.07 H2O for e-MoO3. From both XPS and TGA analysis, we notice that the molar amount of oxygen defects is approximately equal to that of the incorporated H2O molecules. Thus we consider that the incorpo-rated H2O molecules take the place of lattice O of e-MoO3, functioning as buffered spacer to stabilize the widened interlayer gaps between the layers. This assumption is further supported by the density functional theory (DFT) simulation, which is performed employing the bulk supercells of Mo16O48−x·xH2O (x= 1–6, which represents the number of the incorporated H2O molecules) shown in Supplementary Figs. 8 and 9. Notably, an increment of 0.9 Å in the b-lattice parameter is revealed even when one lattice O is replaced by one H2O molecule (Fig.1g). By contrast, for the sample with only oxygen defects (Mo16O47), the increment can = Mo = O = Li
n-BuLi
Van der Waals layer Van der Waals layer
H2 H2 Expanded spacing Intensity (a.u.) 10 Intensity (a.u.) Mass retention (%) Increment in b-lattice parameter (Å) 20 240 237 101 100 99.12% 100.06% 99 98 234 Mo6+ Mo6+ Mo5+ Mo6+ Mo5+ Mo6+ e-MoO3 N2-α-MoO3 Mo16O47 Experimental value Calculated value Air-α-MoO3 N2-e-MoO3 Air-e-MoO3 α-MoO3
Binding energy (eV)
231 228 100 200 300 Temperature (°C) 400 500 600 1.5 1.2 0.9 0.6 0.3 0.0 0 1 2 3 x in Mo16O48-x .xH2O 4 5 6 7 30 2θ/degree 40 50 Observed Calculated Difference Bragg peaks 1 Bragg peaks 2 60 H2O H2O molecules c b a b c e f g d Cracks
Fig. 1 Structure and composition analysis ofα-MoO3and e-MoO3. a Schematic representation of expansion process from pristineα-MoO3(left), reaction
withn-butyllithium (middle), to e-MoO3with H2O molecules located at the oxygen-defect sites (right). White: Mo; Red: O; Purple: Li; Blue: H.b Digital
photos ofα-MoO3(left) and e-MoO3(right).c Rietveld refinement of XRD pattern and d high-resolution TEM image for e-MoO3.Scale bar ind 50 nm. e
Mo 3d XPS profiles of α-MoO3and e-MoO3.f TGA curves ofα-MoO3and e-MoO3measured in nitrogen and air atmosphere.g Calculated increment in
b-lattice parameter induced by H2O intercalation. The value is also compared with the calculated value of oxygen-defective MoO3−x(Mo16O47) and
only reach 0.13 Å, which further confirms the dominant role of the incorporated H2O in expanding the interlayer gaps. When x is between 3 and 6 (corresponding to MoO2.81·0.19 H2O to MoO2.63·0.37 H2O), the calculated increment in the b-lattice parameter agrees well with our experimental XRD results. In addition, the simulated e-MoO3 structure with most stable configuration also reveals that the incorporated H2O induces the distortion of the [MoO6] octahedra (Supplementary Fig. 10), leading to substantial changes in O–O distances (both intra- and inter-layer ones, Supplementary Fig. 11 and Supplementary Note 4).
The increment in band density near the Fermi level for e-MoO3 compared with α-MoO3 is evidenced by the ultraviolet photoelectron spectroscopy analysis (Supplementary Figs. 12 and 13 and Supplementary Note 5) and O K-edge X-ray absorption near-edge structure spectra (Supplementary Fig. 14 and Supple-mentary Note 6). e-MoO3 sample exhibits a remarkable conductivity of 0.95 S m−1 at 300 K as determined by the van der Pauw 4-probe method (Supplementary Fig. 15), whereas the conductivity of pristineα-MoO3was too low to be detected. The enhanced conductivity can be explained by the narrowed band gap and the increment in the carrier concentration (Supplemen-tary Fig. 16 and Supplemen(Supplemen-tary Note 7), which can be attributed to the electron hopping mechanism boosted by Mo5+31,32. Enhanced Li+storage kinetics of e-MoO3. e-MoO3sample with large opened interlayer space has been used as electrode material for Li-ion intercalation reaction. Figure2a, b compares the initial three galvanostatic charge/discharge cycles at 50 mA g−1 in 2 M LiPF6 dissolved in ethyl methyl carbonate electrolyte. Thefirst lithiation process ofα-MoO3starts with a short constant potential plateau at about 2.75 V vs. Li/Li+, which is consistent with the presence of a reduction peak in thefirst cathodic cyclic voltammetry (CV) cycle (Supplementary Fig. 17). This process is related to an irreversible phase transition and will be later discussed in more detail in the in operando XRD section. By contrast, such a feature is not observed in thefirst lithiation reaction of e-MoO3, identifying the role of the widened interlayer gaps in inhibiting the phase transition. Also, the Coulombic efficiency of e-MoO3in thefirst cycle (85%) is found to
be higher than that ofα-MoO3(78%). Such an improvement is also observed during the next cycles (Fig.2a, b).
CV curves from a scan rate range of 0.1–100 mV s−1 were
collected for both α-MoO3 and e-MoO3 electrodes with similar weight loadings (Supplementary Fig. 18). As revealed in Fig.2c, e-MoO3depicts both higher capacity and better rate capability than α-MoO3. At an extremely slow scan rate of 0.1 mV s−1, the capacity of e-MoO3electrode is close to the theoretical capacity (1005 C g−1, 279 mAh g−1), while α-MoO3 electrode only shows a capacity of 756 C g−1 (210 mAh g−1). Importantly, our e-MoO3 electrode delivers an outstanding areal capacity of 578 mC cm−2, drastically outperforming the reported state-of-the-art α-MoO3-based pseu-docapacitive electrodes19,22,25,26,33. When the scan rate increases to 10 and 100 mV s−1, e-MoO3can maintain high capacities of 233 and 72 mC cm−2, respectively, indicating high power capability. As forα-MoO3electrode, the capacity at 10 and 100 mV s−1can only reach 20 and 3 mC cm−2, respectively. Moreover, galvanostatic charge/discharge profiles at different rates also verify the superior rate capability of e-MoO3electrode (Supplementary Fig. 19).
The significant role of the incorporated H2O molecules in accelerating the diffusion of Li+within e-MoO3lattice was further studied. Figure2d compares the Li+diffusion coefficient (D) of α-MoO3 and e-MoO3 obtained by employing a galvanostatic intermittent titration technique (GITT, see Supplementary Figs. 20 and 21). The DLi+values in e-MoO3electrode (2.4 × 10⁻¹²–3.5 × 10⁻¹⁰cm2s−1) are substantially higher than those in α-MoO
3 electrode (3.9 × 10⁻¹³–6.0 × 10⁻¹¹cm2s−1). The fastened Li+ diffusion can be assigned to both the expanded ionic diffusion channels and the shielding effect of incorporated H2O that screens the electrostatic interaction between Li+ and MoO3 lattice34,35. Meanwhile, we measured the electrochemical impedance spectro-scopy for both α-MoO3 (Supplementary Fig. 22) and e-MoO3 (Fig. 2e) at various potentials from the cathodic process. Both electrodes depict stable ohmic resistance (Rs) and V-shape variation for charge transfer resistance (Rct) along with the change of potential (Supplementary Fig. 23). It can be observed that Rs, Rct, and the overall resistance of e-MoO3are all lower than those of α-MoO3, further justifying the improved charge and ion transfer efficiency for e-MoO3.
4 a d e f b c 3 2 P otential (V) vs . Li/Li + 1 0.0 1E–9 Lithiation Delithiation 1E–10 1E–11 1E–12 1E–13 3.0 2.5 2.0 2.0 2.5 3.0 0.4 0.8
Initial phase transition
1st cycle 2nd cycle 3rd cycle x in LixMoO3 D (cm 2 s –1 ) –Z” (ohm cm 2) Z’ (ohm cm2) x in e-LixMoO3 1.2 1.6 2.0 4 3 2 P otential (V) vs . Li/Li + Potential (V) vs. Li/Li+ Specific capacity (C g –1) Specific capacity (C g –1 ) Areal capacity (mC cm –2 ) 1 0.0 1200 800 400 0 0 400 800 1200 0.4 0.8 1st cycle 2nd cycle 3rd cycle 1.6 V vs. Li/LI+ 1.8 V 2.6 V 2.8 V 3.0 V 3.2 V 2.0 V 2.2 V 2.4 V 1.2 1.6 2.0 0.1
α-MoO3: Specific Areal
Areal Specific e-MoO3: e-MoO3-discharge e-MoO3-charge α-MoO3-discharge α-MoO3-charge α-MoO3 e-MoO3 1 10 Scan rate (mV s–1) 100 0.1 1 10 100 1000 10,000 1000 100 10 900 600 300 0 0 100 200 300 Cycle no. 400 500 600 1
Fig. 2 Li+storage behavior ofα-MoO3and e-MoO3electrodes. Initial three galvanostatic charge/discharge profiles of a α-MoO3andb e-MoO3
electrodes.c Specific and areal capacity as a function of scan rate. d Li+diffusion coefficient calculated from GITT curves. e Nyquist plots of e-MoO3at
In addition, e-MoO3electrode exhibits a significant improvement in cycling stability compared toα-MoO3(Fig.2f). When cycled at 100 mA g−1for 600 cycles, e-MoO3still maintains a high capacity of 455 C g−1, delivering excellent capacity retention of 71%. In contrast,α-MoO3electrode shows rapid capacity decay, from 586 C g−1in thefirst cycle to 175 C g−1after only 50 cycles.
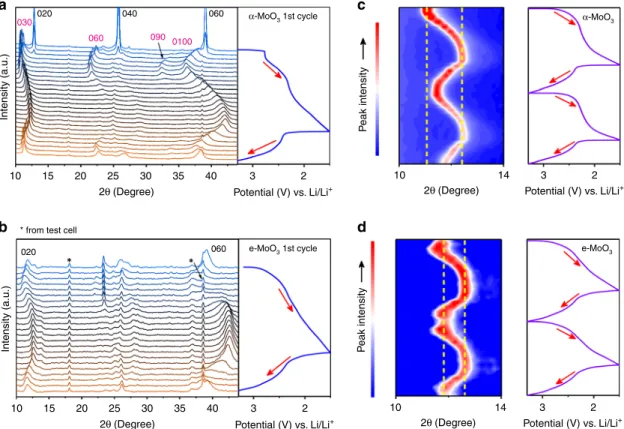
To gain insight into the performance superiority of e-MoO3to pristine α-MoO3, we further carried out in operando XRD characterizations of electrodes during the first three lithiation/de-lithiation cycles. During the initial lithiation/de-lithiation (Fig. 3a), α-MoO3 electrode experienced an irreversible phase transition at 2.75 V vs. Li/Li+, which was evidenced by the rapid disappearance of the (0k10) peaks of the pristineα-MoO3and the appearance of a set of broad (0k20) peaks belonging to the lithiated MoO3 (LixMoO3). This irreversible phase transition results in a sudden distortion of the layers inα-MoO3, which accounts for the fast structural collapse and sluggish kinetics ofα-MoO336. Although limited information can be gained for e-MoO3from XRD peaks within 15–35° due to the overlap of multiple peaks, one can clearly notice that the primitive (020) and (060) peaks of e-MoO3were well maintained during the whole lithiation/de-lithiation process (Fig. 3b). This result suggests a stable structural phase resulting from the expanded interlayer gaps in e-MoO3. We further compare the shift of the (0k0) peak of α-MoO3and e-MoO3 located between 10° and 14° during the second and third lithiation/de-lithiation cycles (Fig.3c, d), which is directly associated with the volume change of the lattice in b direction. Benefiting from the lessened electrostatic interaction between Li+ and MoO3 lattice, the peak shift of e-MoO3 (0.8°) during the second cycle is apparently smaller than that ofα-MoO3 (1.3°). Besides, almost no difference is observed between the peaks of e-MoO3at the beginning of the second cycle and at the end of the third cycle, whileα-MoO3displays a peak shift of 0.6°. Thus we conclude that the incorporated H2O molecules efficiently alleviate the volume change of e-MoO3 and prevent the structure collapse
during Li+insertion/extraction, which also explains the enhanced cycling performance of e-MoO3with respect toα-MoO3.Moreover, aside from α-MoO3, we also demonstrated the feasibility of our H2O-incorporation strategy in improving the charge storage ability of birnessiteδ-MnO2for Zn-ion aqueous batteries (Supplementary Figs. 24 and 25 and Supplementary Note 8).
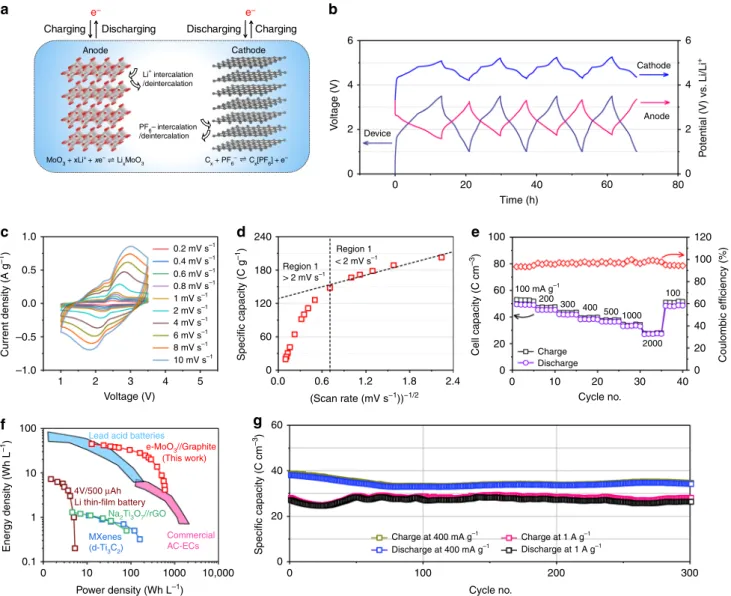
Full DIES device. Full DIES device was further assembled by e-MoO3 anode, graphite cathode and 2 M LiPF6 in ethyl methyl carbonate electrolyte to demonstrate the practical application of our e-MoO3 electrode in constructing full device. As anion-intercalation graphite cathode owns a high anion-anion-intercalation potential (average discharge potential: 4.6 V), a large specific capacity (396 C g−1at 50 mA g−1), and importantly high charge-storage kinetics (almost no capacity decay from 50 to 500 mA g−1, Supplementary Fig. 26 and Supplementary Note 9), the designed e-MoO3//graphite device holds the opportunity to mitigate the inherent trade-off between energy density and power density for energy storage devices. According to the specific capacity of e-MoO3anode and graphite cathode at a low rate, a cathode/anode mass ratio of 2.5 was used to assemble the dual-ion-intercalation device (Fig.4a), and a theoretical capacity of 275 C g−1is expected for the cell based on the total mass of active materials. From the experiments, a reversible capacity of 200 C g−1(72.7% of theore-tical capacity) could be achieved at 100 mA g−1(based on the mass of e-MoO3) within a 1.0–3.5 V voltage range.
Figure 4b shows the first four galvanostatic charge/discharge cycles using a Li metal reference electrode to record the anode and cathode potentials during the cell cycling. After thefirst two cycles, the potential windows for anode and cathode stabilize as 1.8–3.3 and 4.3–5.3 V vs. Li/Li+, respectively (Fig.4b). At the end
of charge and discharge, the cathode and anode are close to its upper potential limit (3.3 V vs. Li/Li+for e-MoO3, 5.3 V vs. Li/ Li+for graphite), respectively. The unexploited capacity (capacity
a
020
10 20
020 060
* from test cell
25 30
2θ (Degree) 2θ (Degree)
35
Potential (V) vs. Li/Li+ Potential (V) vs. Li/Li+
2θ (Degree) Potential (V) vs. Li/Li+
40 10 14 3 2 10 14 3 2 3 2 15 10 20 25 30 2θ (Degree) 35 Potential (V) vs. Li/Li+ 40 3 2 15 040 060 α-MoO 3 1st cycle α-MoO3 e-MoO3 e-MoO 3 1st cycle 030 060 090 0100 Intensity (a.u.) P eak intensity P eak intensity Intensity (a.u.) b c d
Fig. 3 In operando XRD study. In operando XRD measurements of a, cα-MoO3andb, d e-MoO3electrodes duringa, b thefirst galvanostatic
at a potential <1.8 V for e-MoO3 and <4.3 V for graphite) explains the lower capacity of the device compared with the theoretical values. Noteworthy is that the Coulombic efficiency of e-MoO3anode (85%) at thefirst cycle is close to that of graphite cathode (75%, Supplementary Fig. 27), so that the two electrodes in the full cell provide suitable buffers for each other during the initial polarization. Moreover, the anode potential is far above the Li plating potential, which can effectively prevent the safety issue associated with metal dendrite growth.
CV curves recorded from 0.2 to 100 mV s−1 (discharge time from 3.5 h to 25 s) present multi-pairs of redox peaks, corresponding to different steps of anion and cation intercala-tion/de-intercalation (Fig. 4c and Supplementary Fig. 28). To establish the rate-limiting step of the charge storage process, Fig.4d plots the specific capacity based on the total active mass as
a function of v−1/237. At a low scan rate of 0.2 mV s−1, the capacity is up to 222 C g−1. Along with the increasing scan rate, there are two distinct regions. At scan rates <2 mV s−1, the charge
storage is almost not limited by the solid-state ion diffusion, thus the capacity is mostly independent on the scan rate. The extrapolated y-intercept capacity, that is, the charge storage from capacitive processes at the infinite scan rate, reaches around 130 C g−1. The high kinetics of the device is also reflected by the slope of the plots of log (i) vs. log (v) for the main redox peaks (Supplementary Fig. 29 and Supplementary Note 10).
We further studied the rate performance of the DIES device from 100 mA g−1to 2 A g−1(Fig.4e). The capacity based on the total cell stack volume (illustrated in Supplementary Fig. 30 and Supplementary Note 11) reaches 49 C cm−3(200 C g−1, Supple-mentary Fig. 31) at 100 mA g−1, and 55% capacity was maintained when the current density increased to 2 A g−1 (a discharge time of 3.2 min). The Ragone plot shown in Fig. 4f compares the volumetric performance of the cell with the state of the art of electrochemical energy storage devices (Supple-mentary Fig. 32 shows the performance normalized to the active material weight). The present e-MoO3//graphite device could
6 b c d f g e a 4 2 1.0 180 240 100 80 60 120 100 80 Coulombic efficiency (%) 60 40 20 0 40 20 0 0 10 20 30 Cycle no. 40 120 60 0 60 40 20 0 0 Charge at 400 mA g–1 100 mA g–1 200 300 400 500 1000 100 2000 Charge at 1 A g–1 Discharge at 1 A g–1 Charge Discharge Discharge at 400 mA g–1 Cycle no. 200 100 300 0.0 0.6 1.2 (Scan rate (mV s−1))−1/2 1.8 2.4 0.2 mV s–1 > 2 mV s–1 Region 1 Region 1 < 2 mV s–1 0.4 mV s–1 0.6 mV s–1 0.8 mV s–1 1 mV s–1 2 mV s–1 4 mV s–1 6 mV s–1 8 mV s–1 10 mV s–1 0.5 0.0 –0.5 –1.0 100 10 Energy density (Wh L –1) Power density (Wh L–1) 1 0.1 0 10 100 1000 10,000 0 0 1 2 3 Voltage (V)
Lead acid batteries
(This work) 4V/500 μAh Li thin-film battery Na2Ti3O7//rGO MXenes (d-Ti3C2) Commercial AC-ECs e-MoO3//Graphite 4 5 Device Cathode Anode 20 40 Time (h) V oltage (V) Current density (A g –1 ) Specific capacity (C g –1) Specific capacity (C cm –3) Cell capacity (C cm –3 ) 60 80 P otential (V) vs . Li/Li + 2 0 4 6 Charging Li+intercalation /deintercalation PF6– intercalation /deintercalation MoO3 + xLi+ + xe– Li xMoO3 Cx + PF6 – C x[PF6] + e – Charging Discharging Discharging
Anode Cathode
e– e–
Fig. 4 e-MoO3//graphite DIES device. a Design of the dual-ion-intercalation MoO3//graphite cell. On the anode side, predominantly Li+is intercalated
and de-intercalated between [MoO6] layers of MoO3during charge/discharge. On the cathode side, graphite is used as a host for hexafluorophosphate
(PF6−) anion intercalation/de-intercalation.b The initial four galvanostatic charge/discharge cycles at 100 mA g−1and the corresponding potential
variation of the cathode and anode.c CV curves of the device at different scan rates. d Change of the gravimetric capacity based on the total active mass as a function ofv−1/2.e Rate performance of the e-MoO3//graphite device based on the volume of the whole device.f Ragone plots of e-MoO3//graphite
device in comparison with state-of-the-art electrochemical energy storage devices; the performance is normalized to the total cell volume, which includes the active materials, current collectors and separators.g Cycling performance of the e-MoO3//graphite device at 400 mA g−1and 1 A g−1.
deliver an energy density up to 44 Wh L−1, which outperforms those of Li thin-film micro-battery38, Na-ion capacitors39, activated carbon-40 and MXene-based41 supercapacitors, and is comparable to those of lead-acid batteries42. Meanwhile, a decent maximum power density of 600 W L−1 was achieved, close to supercapacitor-level power densities.
Finally, cycling stability was evaluated by galvanostatic charge/ discharge tests (Fig.4g). Impressive cycling stability with 90% and 97% capacity retention was observed over 300 cycles at 400 and 1000 mA g−1. Note that both the volumetric and gravimetric capacities of graphite are substantially lower than those of e-MoO3, which consequently limit the energy storage capability of the whole DIES device. Li-ion full cell was also assembled by e-MoO3anode and commercial LiCoO2 cathode (Supplementary Fig. 33 and Supplementary Note 12). Although the maximum energy density of e-MoO3//LiCoO2 device (146 Wh kg−1) is slightly higher than that of e-MoO3//graphite device (133 Wh kg−1), the power density of e-MoO3//LiCoO2is far below that of e-MoO3//graphite device. As a result, developing a new cation-intercalation cathode with comparable specific capacity with e-MoO3 anode would be beneficial for further boosting the energy and power densities of full devices.
Discussion
In summary, we demonstrated an efficient H2O-incorporation strategy for expanding the interlayer gaps ofα-MoO3, which trig-gers a robust Li+storage ability with significantly improved rate capability and prolonged cycling stability. There are three key advantages of our strategy. First, the incorporated H2O molecules function as effective spacers to stabilize the expanded interlayer gaps in e-MoO3, which provides efficient Li+ diffusion channels and avoid the irreversible phase transition of e-MoO3during the initial lithiation process. Second, the H2O molecules can shield electro-static interaction between Li+and e-MoO3lattice, thus alleviating the volume change of e-MoO3during repeated Li intercalation/de-intercalation and improving the cycling stability of e-MoO3. Third, since the incorporated H2O molecules take the place of lattice O and the molecular mass of H2O is very close to O, the improved rate capability and cycling stability of e-MoO3 come without the sacrifice of specific capacity. Moreover, a DIES device was assem-bled by coupling cation-intercalation e-MoO3 and anion-intercalation graphite. Such a device links the anion-intercalation-type charge storage with fast kinetics, which thus can bring together high power density (up to 600 W L−1) and energy density (up to 44 Wh L−1). This study offers insightful understanding of the interlayer gap-engineering strategy to improve the ion-intercalation chemistry of layered electrode materials, which opens opportunities for the next-generation energy storage technologies.
Methods
Materials. All chemicals were of analytical grade and used directly without any purification. Ammonium molybdate tetrahydrate ((NH4)6Mo7O24·4H2O), lithium
cobalt oxide (LiCoO2), concentrated HNO3(70 wt%), n-butyl lithium in hexane,
hexane, Li foil, graphiteflakes (average size 20 µm), sodium alginate, Super P carbon black, and 2 M LiPF6in ethyl methyl carbonate were purchased from
Sigma-Aldrich.
Material preparation.α-MoO3nanowires were prepared through a hydrothermal
method. In all, 6.5 g of (NH4)6Mo7O24·4H2O wasfirst dissolved into 180 mL of
distilled water. Then 30 mL concentrated HNO3(70 wt%) was added into the
solution, followed by vigorous stirring. The obtained solution was then transferred into a 250-mL Teflon-lined stainless autoclave and heated in an electric oven at 180 °C for 12 h. After naturally cooled down to room temperature, the obtained powder sample was washed thoroughly with distilled water and dried in a vacuum oven at 80 °C for 12 h.
e-MoO3was obtained by dispersing 500 mg ofα-MoO3nanowires in 16 mL of
0.8 M n-butyl lithium in hexane. The mixture was then stirred for 24 h at room temperature under the protection of inert argon atmosphere. The lithiated
compound was separated by vacuumfiltration and washed several times with hexane. Subsequently, the sample was placed in 100 mL of distilled water and stirred for half an hour. Finally, the sample was centrifuged and dried in a vacuum oven at 80 °C for 12 h.
Electrochemical measurements. All the half-cell tests were conducted in CR2032 coin-type cells. To prepare the electrodes, active materials (α-MoO3,
e-MoO3, and graphite), binder (sodium alginate), and Super P carbon black were
mixed with a weight ratio of 8:1:1. The mixture was dispersed in water and coated on a Cu foil (α-MoO3, e-MoO3) or an Al foil (graphite), followed by
drying at 80 °C for 12 h under vacuum. The loading mass ofα-MoO3and
e-MoO3is about 0.6 ± 0.1 mg cm−2, while the loading mass of graphite is 1.5 ±
0.1 mg cm−2. The coin cells were assembled using Li metal foil as a counter electrode, Celgard 2400 as the separator, and 2 M LiPF6dissolved in ethyl
methyl carbonate as the electrolyte.
The full-cell tests were performed with a three-electrode stainless steel Swagelok cell. e-MoO3coated on Cu foil and graphite coated on Al foil were used as anode
and cathode, respectively, with a mass ratio of 1:2.5. A Li metal foil was inserted as a reference electrode to monitor the potential variation of both anode and cathode. All cell assembly was carried out in an argon-filled glove box, and the
concentration of O2and H2O were kept <0.1 ppm.
The charge–discharge curves were collected from a Land battery test system (LAND CT2001A) at room temperature. GITT test was performed with a galvanostatic charge/discharge pulse of 50 mA g−1for 10 min, followed by an open circuit step for 3 h. Both CV and electrochemical impedance measurements were conducted on a VMP3 potentiostat (Biologic, USA). The electrochemical impedance measurements were carried out at a 10 mV ac oscillation amplitude over the frequency range of 100 kHz to 0.01 Hz.
Characterization. The microstructures and compositions of samples were ana-lyzed byfield-emission SEM (Carl Zeiss Gemini 500), TEM (FEI Tecnai G2F30),
XRD (Bruker D8) using Cu Kα radiation (λ = 0.154 nm), and TGA (Netzsch DSC-204 F1). Raman spectra were measured on a NTMDT confocal spectrometer with a 532-nm laser, and the spot size of the laser beam was ~0.5μm. Infrared spectra were recorded on a FT-IR Spectrometer Tensor II (Bruker) with an ATR unit. EPR measurement was performed in the X-band (9.32 GHz) with 1.0 G modulation amplitude and a magneticfield modulation of 100 kHz using a Bruker, A300-10-12 Bruker EPR spectrometer at 90 K.
XPS, near-edge X-ray absorptionfine structure (NEXAFS), and ultraviolet photoemission spectroscopy were measured at the Photoemission Endstation (BL10B beamline) of the National Synchrotron Radiation Laboratory (NSRL) in Hefei, China. Briefly, the beamline is connected to a bending magnet and equipped with three gratings that cover photon energies from 100 to 1000 eV with a typical photonflux of 1 × 10¹⁰photons/s and a resolution (E/ΔE) better than 1000 at 244
eV. XPS spectra were collected using monochromatic Mg-Kα X-ray (1254.6 eV) as the excitation source. NEXAFS spectra were recorded in the total electron yield mode using a sample current measurement.
To detect the conductivity, 10 mg sample wasfirst dispersed in ethanol and coated on a cellulose membrane (diameter of 4.5 cm) through vacuumfiltration. The membrane loaded with sample was cut into a size of 1 × 1 cm2, and then a
four-point contact was placed on the surface to define a square. The I–V curves were measured in van der Pauw geometry under vacuum at varied temperatures (from 100–400 K) using a commercial Lakeshore Hall System.
A two-electrode Swagelok cell was used for in operando XRD tests. Freestandingα-MoO3or e-MoO3film consisting of 90 wt% of active material, 5 wt
% of Super P, and 5 wt% of polytetrafluoroethylene was placed onto a beryllium foil acting as the current collector, and a Li foil was used as the counter electrode. XRD test was carried out on a Bruker D8 advance diffractometer in the 10–50° 2θ range with a step of 0.0152°, while the electrode was undergoing a galvanostatic charge/ discharge test at 50 mA g−1.
Computational details. All calculations were performed using the plane-wave DFT code available in the Vienna Ab initio Simulation Package (VASP) within the generalized gradient approximation, using the Perdew–Burke–Ernzerhof functional for the exchange and correlation potential. Spin polarized calculations were per-formed to account for orbit coupling. The electronic wave functions were described in the projected augmented wave formalism, and a real-space projection was fur-ther used for the total wavefunction analysis. The cutoff energy for plane-wave basis set was set to 400 eV. All atomic positions and lattice vectors were fully optimized using a conjugate gradient algorithm to obtain the unstrained con fig-uration. Atomic relaxation was performed until the change of total energy was <1 × 10⁻⁵eV, and all the forces on each atom were <0.01 eV Å−1. The orthor-hombic cell with space group Pbnm was used forα-MoO3. Supercells containing
2 × 1 × 2 conventional cells (16 formula units, Supplementary Figs. 7 and 8) were used to calculate energies and band structure, in which Monkhorst–Pack scheme k-point grid was set to 5 × 3 × 5.
References
1. Simon, P., Gogotsi, Y. & Dunn, B. Where do batteries end and supercapacitors begin? Science 343, 1210–1211 (2014).
2. Yu, M. H. & Feng, X. L. Thin-film electrode-based supercapacitors. Joule 3, 338–360 (2019).
3. Wang, X. et al. Influences from solvents on charge storage in titanium carbide MXenes. Nat. Energy 4, 241–248 (2019).
4. Chen, C. et al. Na+intercalation pseudocapacitance in graphene-coupled titanium oxide enabling ultra-fast sodium storage and long-term cycling. Nat. Commun. 6, 6929 (2015).
5. Grey, C. P. & Tarascon, J. M. Sustainability and in situ monitoring in battery development. Nat. Mater. 16, 45–56 (2016).
6. Salanne, M. et al. Efficient storage mechanisms for building better supercapacitors. Nat. Energy 1, 16070 (2016).
7. Yu, M. et al. Boosting the energy density of carbon-based aqueous supercapacitors by optimizing the surface charge. Angew. Chem. Int. Ed. 56, 5454–5459 (2017).
8. Wang, D. Y. et al. Advanced rechargeable aluminium ion battery with a high-quality natural graphite cathode. Nat. Commun. 8, 14283 (2017).
9. Chen, C.-C. & Maier, J. Decoupling electron and ion storage and the path from interfacial storage to artificial electrodes. Nat. Energy 3, 102–108 (2018).
10. Wang, M. & Tang, Y. A review on the features and progress of dual-ion batteries. Adv. Energy Mater. 8, 1870088 (2018).
11. Ji, B., Zhang, F., Song, X. & Tang, Y. A novel potassium-ion-based dual-ion battery. Adv. Mater. 29, 1700519 (2017).
12. Sheng, M. H., Zhang, F., Ji, B. F., Tong, X. F. & Tang, Y. B. A novel tin-graphite dual-ion battery based on sodium-ion electrolyte with high energy density. Adv. Energy Mater. 7, 1601963 (2017).
13. Kravchyk, K. V. et al. High-energy-density dual-ion battery for stationary storage of electricity using concentrated potassiumfluorosulfonylimide. Nat. Commun. 9, 4469 (2018).
14. Wang, G. et al. Self-activating, capacitive anion intercalation enables high-power graphite cathodes. Adv. Mater. 30, e1800533 (2018).
15. Wang, G. et al. Polarity-switchable symmetric graphite batteries with high energy and high power densities. Adv. Mater. 30, e1802949 (2018). 16. Lin, M. C. et al. An ultrafast rechargeable aluminium-ion battery. Nature 520,
325–328 (2015).
17. Wang, M. et al. Reversible calcium alloying enables a practical room-temperature rechargeable calcium-ion battery with a high discharge voltage. Nat. Chem. 10, 667–672 (2018).
18. Bellani, S. et al. WS2–graphite dual-ion batteries. Nano Lett. 18, 7155–7164
(2018).
19. Zhang, G. et al.α-MoO3-xby plasma etching with improved capacity and
stabilized structure for lithium storage. Nano Energy 49, 555–563 (2018). 20. Meduri, P. et al. MoO3-xnanowire arrays as stable and high-capacity anodes
for lithium ion batteries. Nano Lett. 12, 1784–1788 (2012).
21. Zhou, L. et al.α-MoO3nanobelts: a high performance cathode material for
lithium ion batteries. J. Phys. Chem. C 114, 21868–21872 (2010).
22. Mendoza-Sánchez, B. & Grant, P. S. Charge storage properties of aα-MoO3/
carboxyl-functionalized single-walled carbon nanotube composite electrode in a Li ion electrolyte. Electrochim. Acta 98, 294–302 (2013).
23. Wang, X.-J., Nesper, R., Villevieille, C. & Novák, P. Ammonolyzed MoO3
nanobelts as novel cathode material of rechargeable Li-ion batteries. Adv. Energy Mater. 3, 606–614 (2013).
24. Mai, L. Q. et al. Lithiated MoO3nanobelts with greatly improved performance
for lithium batteries. Adv. Mater. 19, 3712–3716 (2007).
25. Brezesinski, T., Wang, J., Tolbert, S. H. & Dunn, B. Ordered mesoporous alpha-MoO3 with iso-oriented nanocrystalline walls for thin-film pseudocapacitors. Nat. Mater. 9, 146–151 (2010).
26. Kim, H. S. et al. Oxygen vacancies enhance pseudocapacitive charge storage properties of MoO3-x. Nat. Mater. 16, 454–460 (2017).
27. Gogotsi, Y. & Simon, P. True performance metrics in electrochemical energy storage. Science 334, 917–918 (2011).
28. Xiong, R. et al. Infrared and EPR studies of the red potassium molybdenum bronze K0.33MoO3. J. Mater. Sci. 36, 5511–5514 (2001).
29. Dickens, P. G. & Neild, D. J. Some electronic properties of the molybdenum bronzes. Trans. Faraday Soc. 64, 13–18 (1968).
30. Dinh, C.-T. et al. Multi-site electrocatalysts for hydrogen evolution in neutral media by destabilization of water molecules. Nat. Energy 4, 107–114 (2018). 31. Yu, M. et al. Dual-doped molybdenum trioxide nanowires: a bifunctional
anode forfiber-shaped asymmetric supercapacitors and microbial fuel cells. Angew. Chem. Int. Ed. 55, 6762–6766 (2016).
32. Zhang, H. et al. Extracting oxygen anions from ZnMn2O4: robust cathode for
flexible all-solid-state Zn-ion batteries. Energy Storage Mater. 21, 154–161 (2019). 33. Mendoza-Sánchez, B. et al. An investigation of the energy storage properties of
a 2Dα-MoO3-SWCNTs compositefilms. 2D Mater. 4, 015005 (2016).
34. Lee, H. J., Shin, J. & Choi, J. W. Intercalated water and organic molecules for electrode materials of rechargeable batteries. Adv. Mater. 30, e1705851 (2018). 35. Kundu, D., Adams, B. D., Duffort, V., Vajargah, S. H. & Nazar, L. F. A high-capacity and long-life aqueous rechargeable zinc battery using a metal oxide intercalation cathode. Nat. Energy 1, 16119 (2016).
36. Tsumura, T. & Inagaki, M. Lithium insertion/extraction reaction on crystalline MoO3. Solid State Ion 104, 183–189 (1997).
37. Ardizzone, S., Fregonara, G. & Trasatti, S.“Inner” and “outer” active surface of RuO2electrodes. Electrochim. Acta 35, 263–267 (1990).
38. Pech, D. et al. Ultrahigh-power micrometre-sized supercapacitors based on onion-like carbon. Nat. Nanotechnol. 5, 651–654 (2010).
39. Dong, S. et al. Flexible sodium-ion pseudocapacitors based on 3D Na2Ti3O7
nanosheet arrays/carbon textiles anodes. Adv. Funct. Mater. 26, 3703–3710 (2016).
40. Simon, P. & Gogotsi, Y. Capacitive energy storage in nanostructured carbon-electrolyte systems. Acc. Chem. Res. 46, 1094–1103 (2013).
41. Lukatskaya, M. R. et al. Cation intercalation and high volumetric capacitance of two-dimensional titanium carbide. Science 341, 1502–1505 (2013). 42. Simon, P. & Gogotsi, Y. Materials for electrochemical capacitors. Nat. Mater.
7, 845–854 (2008).
Acknowledgements
This project has received funding from the European Research Council (ERC) under the European Union’s Horizon 2020 research and innovation program (grant agreement No 819698 and GrapheneCore2 785219), Deutsche Forschungsgemeinschaft (MX‐OSMOPED project), and German Research Foundation (DFG) within the Cluster of Excellence. H.S., P. R., and P.S. thank the Agence Nationale de la Recherche (Label STORE-EX) for financial support. M.Y. is grateful for a scholarship from the Alexander von Humboldt Foundation. H.S. is supported by a grant from the China Scholarship Council. C.Z.W. is supported by the U.S. Department of Energy, Office of Science, Basic Energy Sciences, Division of Materials Science and Engineering, including the computer time on National Energy Research Scientific Computing Center (NERSC), under Contract No. DE-AC02-07CH11358. The authors acknowledge the use of the facilities in the Dresden Center for Nanoanalysis at the Technische Universität Dresden and synchrotron experimental facilities of the National Synchrotron Radiation Laboratory (NSRL) in Hefei, China (BL10B beam-line). The authors also thank Dr. Jian Zhang (TU Dresden), Mingchao Wang (TU Dresden), Xue Bai (CIRIMAT), and Dr. Xusheng Zheng (NSRL) for helpful discussions.
Author contributions
X.F. and M.Y. conceived the project and designed materials and experiments. M.Y. conducted material preparation and most of characterization. P.S. supervised the elec-trochemical investigation that M.Y. and H.S. carried out. C.-Z.W. supervised the DFT calculation that F.Y. performed. P.R. supervised the Rietveld refinements of the X-ray diffraction results that H.S. carried out. C.L. performed transmission electron micro-scopic measurements. X.L. and G.W. contributed to the important discussion. All authors contributed to writing the manuscript under the supervision of X.F. and P.S.
Competing interests
The authors declare no competing interests.
Additional information
Supplementary information is available for this paper at https://doi.org/10.1038/s41467-020-15216-w.