This is an author-deposited version published in: http://oatao.univ-toulouse.fr/
Eprints ID: 17560
To cite this version:
Villar, Miguel and Chabert, France and Garnier, Christian and Nassiet,
Valérie and Diez, Juan Carlos and Sotelo, Andres and Madre, Maria A.
and Duchesne, Cyrille and Cussac, Philippe Laser transmission welding as
an assembling process for high temperature electronic packaging. (2016)
In: Electrical Systems for Aircraft, Railway, Ship Propulsion and Road
Vehicles & International Transportation Electrification Conference
(ESARS-ITEC), International Conference on, 2 November 2016 - 4
November 2016 (Toulouse, France).
O
pen
A
rchive
T
oulouse
A
rchive
O
uverte (
OATAO
)
OATAO is an open access repository that collects the work of Toulouse researchers and
makes it freely available over the web where possible.
Any correspondence concerning this service should be sent to the repository
administrator:
staff-oatao@listes-diff.inp-toulouse.fr
Laser transmission welding as an assembling process
for high temperature electronic packaging
M.Villar
1, F.Chabert
1, C.Garnier
1, V.Nassiet
1,
1
LGP-ENIT-INPT, University of Toulouse, Tarbes, France f.chabert@enit.fr
J.C.Diez
2, A.Sotelo
2, M.A.Madre
22 Institute of materials science of Aragon, CSIC-University of Zaragoza, Spain
C. Duchesne
3, P. Cussac
33 CIRTEM, Avenue l'Occitane, Labège, France
Abstract— Higher efficiency, power density, reliability and
longer lifetime of power electronic devices would stem from progresses in material science. In this work, we propose to use a high performance thermoplastic polymer PAEK as packaging box to extend the operating temperature above 200°C. More, the laser transmission welding process has been applied to PAEK to join the two-part module. In order to validate this assembling process, the temperature distribution inside the specimens was measured during laser transmission welding. The assembly consists of a quasi-amorphous sample as the upper part and a semi-crystalline sample as the lower part. The temperature fields were measured by infrared thermography with the camera sensor perpendicular to the welded interface. With an energy beam of 28 J.mm-2 and irradiation time of 15 s, we have noticed that the maximum temperature inside the sample is kept far from the PAEK degradation one. Moreover, the temperature at the interface reaches the melting temperature thus assuring enough mobility for polymeric chains to get adhesion at the interface. The location and size of the heat-affected zone has been determined. Finally, some frames were machined and successfully welded.
Keywords—packaging box; high operating temperature; assembling process, thermoplastics
I.! INTRODUCTION
The future of power electronic components, modules and systems in transportation relies heavily on the progresses in material science. Disruptive technologies and materials are required to improve efficiency, power density, reliability and lifetime of power electronic devices. Indeed, the role of packaging is to protect chips from water, dust and mechanical load. Because of the current limitation of the properties of polymers used for the packaging, the highest operating temperature is about 150°C. In order to extend the operating temperature, the whole system environment has to be reappraised. Firstly, the design must be changed to improve thermal management. Secondly, materials for encapsulating gels and boxes have to be replaced by multi-functional polymers with less sensitivity to thermo-oxidative ageing. Some recently developed materials demonstrate a huge potential for improvement in the power electronic packaging issues.
In this framework, the study hereby proposes a high performance polymer for the packaging box and a new assembling process. Keeping in mind environmental issues, a thermoplastic polymer was chosen because of the possibility of recycling. Among high performance thermoplastics, the polyaryletherketone (PAEK) family has demonstrated to be the most resistant to thermo-oxidative degradation [1]. More knowledge and know-how about forming processes of PAEK would seemingly lead to widespread industrial uses.
Adhesive bonding is the most widely used assembling process to join parts of electronic boxes. But adhesive bonding is a challenging process as it requires chemical or physical treatments to prepare the surfaces, and the adhesives have to be chemically compatible with the material of the box. Moreover, upon working cycles, the adhesives can be subjected to delamination, due to the propagation of cracks at the interfaces. Reducing the number of materials in the power system would decrease the number of interfaces and so, it would reduce the eventuality of failure.
Laser welding is an environmentally friendly and versatile process for assembling polymeric parts. Transmission welding requires the upper element to be transparent to the laser wavelength whereas the inferior part is absorbent to the same wavelength. Thus, the energy of the beam is concentrated at the interface, allowing both polymeric parts to be melted. Upon temperature, the interdiffusion of polymeric chains takes place at the interface, creating bridges between both parts, resulting in a strong assembly. Laser welding is in principle applicable to any thermoplastic, provided that it is transparent to the laser wavelength. This process is already applied in the industry with common polymers such as polycarbonate and PMMA [2].
Welding amorphous polymers is easier since the laser beam goes through the material without inducing major changes in the chemical structure and morphology of the material. From a theoretical point of view, the study of interdiffusion at the interface has been developed by the theory of reptation by De Gennes [3] and has been applied to the welding process in order to forecast the processing conditions [4], mainly temperature
and time. Welding a semi-crystalline polymer is a challenge, since the upper part has to be transparent to the laser beam. As soon as the crystalline rate increases, any semi-crystalline polymer turns transparent to semi-transparent to opaque for the highest degrees of crystallinity.
Measuring the temperatures involved during laser welding is of great importance for many reasons: (a) checking that the temperature inside the polymeric part stays low enough to avoid both cold-crystallization and degradation of the material, (b) controlling the temperature to reach the melting temperature at the interface thus assuring enough mobility for polymeric chains to get adhesion and (c) knowing the location of the heat-affected zone (HAZ), the latter has possibly undergone morphological changes and thus, modification of properties and dimensions. In-situ temperature measurements would allow getting insight the laser welding process to make it more reliable.
Measuring the temperature at the interface is not straight forward because both polymeric parts are in contact all along the process. So, contact-free temperature measurement techniques such as infrared thermography have been implemented to the laser welding process in some studies [5,6,7,8]. In parallel to the experimental work, these authors have developed a numerical simulation to predict the temperature at the interface. To validate their model, the materials chosen are either PMMA as semi-transparent element and ABS/PC as absorbent part or, in another study, polycarbonate based FRP (fiber reinforced polymer). Both are amorphous polymers, with well-known transmission, reflection and absorption factors at near- and medium-IR spectrum. Although IR thermography seems to be suited to the laser transmission welding process, no study uses it as a technique for controlling temperature distribution within the sample.
In the existing studies, measurements were performed with the camera sensor parallel to the welded interface. With such an experimental setup, the temperature is measured at the upper or
lower surface of the polymeric parts. These
calculated/experimental results were implemented to numerical simulation, using a hybrid code that combines Mie theory [9,10] and the Monte Carlo method [11] to quantify the scattering phenomena. The experimental and numerical results match for the temperatures measured at the upper and lower surfaces, nevertheless, the temperature at the interface is forecast from these measurements but not really measured.
In this work, the feasibility of welding PAEK is demonstrated and the temperature distribution at the interface within the sample during the welding process is measured. The temperature distribution is recorded by infrared thermography with the camera sensor perpendicular to the welded interface. Controlling the temperature distribution will allow to qualitatively predict the gradient of crystallization changes and so, potentially changes in mechanical properties.
II.! MATERIALS AND METHODS
A high performance semi-crystalline PEKK
(polyetherketoneketone), Kepstan 6002 from Arkema, was chosen for this study. Two kinds of specimens were used for the
welding test, an assembly made of a quasi-amorphous sample as the upper part and a semi-crystalline sample as the lower part. Their transmittance has been measured by spectrophotometry at the laser wavelength (808 nm): It is 60% for the quasi-amorphous sample, whereas the transmittance of the semi-crystalline PEKK is less than 3%. Based on these results, the name “semi-transparent” referred to the quasi-amorphous sample, and the name “opaque” referred to the semi-crystalline material in the following.
Both specimens were processed by compression molding from dried pellets. An 800 kN Pinette Emidecau LAB 800P hot plates press was used; with controlled heating and cooling rates from 2°C/min to 10°C/min. For tailoring the degree of crystallinity and dimensions, samples were made in two steps. In the first step, the pellets were melted at 340°C, slightly compressed and cooled down to room temperature. The cooling
rate was 2°C.min-1 for the crystallized sample; and liquid
nitrogen was used for a fast cooling rate to get the quasi-amorphous sample. In the second step, the sample were flattened
up to 2 mm thick while heating at 2°C.min-1 until glass transition
(160°C) in order to remove any residual stress. The compression molded specimens were dried during 24h at 140°C to remove water before testing.
DSC scan was performed with a DSC Q200 from TA Instruments, starting at room temperature up to 400°C with a ramp of 5°C/min. Only the quasi-amorphous compressed sample scan is shown. Glass transition temperature (Tg), cold crystallization temperature (Tcc) and melting temperature (Tm) were obtained.
Experimental near infrared laser device provides a continuous 808 nm beam, projecting a single 100 x 1 mm2 spot. This wavelength is recommended for welding of thermoplastics. Laser source is fed by 90 diodes branched on 6 stacks of 15 diodes. Laser power is set by diode feeding intensity, starting power emission at 13A and reaching 230W for 40A. Nonetheless, power is spread out all along the laser spot, so only actual irradiated zone must be considered in interaction for energy calculations. Even though laser welding is normally performed in dynamic setup, static tests were carried out for a more accurate interfacial measurement, and to suppress parasite accumulative thermal effects appearing for dynamic laser welding.
Fig. 1: Infrared area of interest of the samples: Only a part of the specimen is registered
Infrared temperature fields measurements were performed with an IR camera CEDIP© Jade III MWIR retrofitted FLIR© titanium SC 7200 with a thermal resolution of 20 mK at 30°C. The used detector is a mid-wave Indium Antimonide (InSb) one and the sensor is a close-up x1 covering a spectral range from 3.70 to 5.15 µm with a focal plane array (FPA) windowing of 7.6 x 9.9 mm². In this range, the transmission factor has been
!"#$%&'(&)*& "%+$&,-%,&#.& /+0%-%$0
measured by spectrophotometry: it is lower than 5% for both samples. Based on literature, we assume the reflectivity of our samples is much less than 1 [7] and so, their reflection factor is assumed to be less than 5%. The detector resolution is 320x256 pixels and the pitch of the sensor is 30 µm. So on, the pixel size on both directions is 0.03 mm. Calibration and data recording were managed by Altair software.
Specimens were laid out 300 mm far from the close up X1 sensor to have the best sharpness. In order to measure interfacial temperature and the distribution of thermal field along both directions (thickness and length of the sample), side-by recordings were performed scoping the region of interest, as shown in Fig. 1. The whole experiments were done in a 25°C thermoregulated dark room to reduce the effect of environment on IR measurement. With regard to measure the rapid temperature rise during laser irradiation, integration time was set up at 16 µs, obtaining a temperature range from 140°C to 300°C. Movies were recorded at 125 Hz with 5 images averaging conducive to minimizing the random noise. So on, the effective frequency was 25 Hz. The experimental set up is shown in Fig. 2.
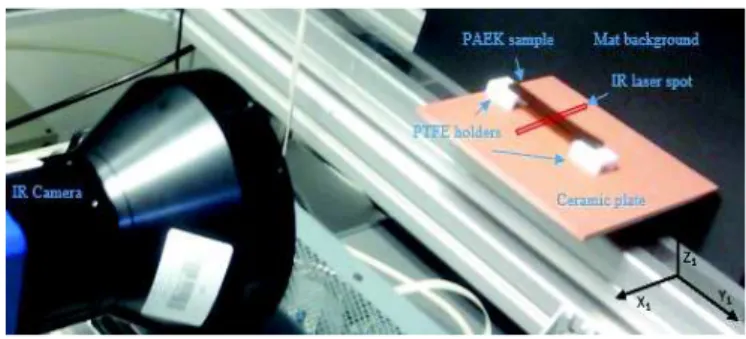
Fig. 2: Layout of infrared recording scene
Infrared measurements are sensitive to the emissivity of the samples. The emissivity was set up as 0.91 for the semi-transparent material and 0.96 for the opaque material; these values are in agreement with previous studies [12]. To estimate the impact of temperature variation due to the emissivity, a variability test was undertaken upon the samples. The emissivity factor varies from 0.8 and 0.98 for a sample irradiated at an energy density level of 22 J.mm-². The variation of the maximum temperature is plotted in Fig. 3.
The results are reported in Table 1, where ε=0.91 is chosen as a reference: Changes in the maximum temperature are within a range of -5.5°C to 9.9°C. Standard deviation σ and average µ of this data set are 6.44 °C and 223.46 °C.
TABLE 1: Impact of the emissivity variability on temperature measurements Emissivity ε 0.80 0.85 0.91 0.96 0.98 Max temperature (°C) 232.25 227.55 222.35 218.34 216.81 ΔT (°C) +9.9 +5.2 / -4.01 -5.54
With these data, the coefficient of variation Cv, calculated with Cv = (1+1/(4n)).σ/µ is 0.03, where n is the population, σ is the standard deviation and µ is the average.
Due to the very low value of Cv, the following emissivity coefficients are finally used: 0.91 for transparent material and 0.96 for opaque one.
Fig. 3: Impact of the emissivity variability on maximum temperature
III.! RESULTS AND DISCUSSION
The thermogram of PEKK in Fig.4 displays a glass transition at 160°C, followed by a low intensity peak due to water release just after the glass transition, when the macromolecular chains have gained enough mobility to move slightly. Then, a cold crystallization is observed with a maximum at 250°C followed by a melting temperature centered at 305°C. The enthalpy of
crystallization (∆Hc =14.9 J.g-1) is lower than the melting
enthalpy, (∆Hm = 33,7 J.g-1) indicating that the specimens were
slightly crystalline before testing, due to the compression molding process. The degree of crystallinity is usually given by:
∆Hm/∆H100%, but it cannot be calculated since the ∆H100% is not
known due to the novelty of this grade.
Fig. 4: DSC thermogram of PEKK for the quasi-amorphous specimen
In order to setup all the IR measurements, experiments were firstly performed on a single opaque sample. A power laser measured in Watt is set during a given time (s) upon the spotted
area (mm2) producing an energy density radiation in J.mm-2.
Energy density was 22 J.mm-2 for laser beam/specimen
interaction tests. An IR movie was recorded using the parameters defined in the previous section. All the images were processed seeking to match the measured area to the specimen size.
After laser beam/specimen interaction, IR measurements were performed during welding of a couple of 2 mm thick specimens. A semi-transparent PEKK sample was used as top part, while opaque PEKK was used as bottom one. The energy
density was previously determined and fixed at 28 J.mm-2 for
this test.
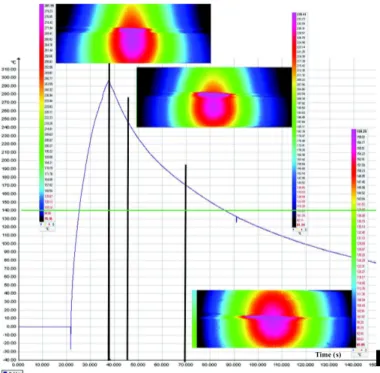
The maximum temperature evolution of the assembly was recorded during welding, with the camera sensor perpendicular to the laser beam direction. The results are plotted in Fig. 5, as well as images at different steps of the process to have a qualitative distribution of the thermal fields. Only temperature above 140°C is considered due to the integration time applied. This thermogram confirms that real irradiation time lasts about 15 s. The upper part is semi-transparent to the wavelength: a part of the energy is absorbed by the sample, a part is reflected and the major part of the energy goes through the upper sample to reach the lower part. As the lower part absorbs the laser beam, the energy is stopped at the interface.
Fig. 5: IR thermogram for welding test: during and after irradiation of the assembly: temperature (°C) versus time (s). The vertical bold black lines
indicate the time when the images were recorded.
As a consequence, the temperature at the interface increases
up to its maximum at 295 +/- 7°C for an irradiation at
28 J.mm-2. This temperature is about 130°C higher than the glass
transition, and reaches the melting temperature. The latter begins at about 275°C, as seen in Fig. 4. While the upper sample is
irradiated, the heat-affected zone is located in the lower sample. As seen in the first image of the temperature field distribution, on the left, the HAZ in the lower part is large and symmetrical. When the irradiation is stopped, the lower part is slightly affected, while the temperature field decreases in the upper part. Upon cooling, the HAZ in the upper part tremendously stretches out. In all, the temperature at the interface of both samples was higher than the glass transition during 50 s and higher than the melting temperature during 5 s for an irradiation of 15 s.
After validation of the welding process on specimens, some frames were machined from 4 mm thick injection molded plates, as seen in Fig.6. Then, the frames were welded two by two, in Fig.7.
Fig. 6: Photography of the machined frames Outer dimensions 56 x 51 x 4 mm3
Fig. 7: Photography of the welded frame Outer dimensions 56 x 51 x 8 mm3.
IV.! CONCLUSION
The use of high performance PEKK as material for packaging box has been investigated. Its glass transition temperature was measured at 160°C and its melting range between 275°C and 320°C, ensuring a stability of mechanical properties above 200°C. For the study, this thermoplastic was processed by compression molding to get semi-crystalline and quasi-amorphous samples.
For the welding test, an assembly made of a quasi-amorphous sample as the upper part and semi-crystalline sample as the lower part was used. The maximum temperature reached at the interface is about 295°C when the upper specimen is
irradiated for 15 s with an energy of 28 J.mm-2. The temperature
inside the sample stays above Tg during 50 s and above the melting temperature during 5 s. This time is obviously enough
to allow macromolecules to interdiffuse and create entanglements between them. Indeed, the obtained assembly looks strong, although no mechanical test has been performed until now. With the chosen energy beam and irradiation time, the maximum temperature inside the sample is kept far from the degradation of PEKK. Moreover, the temperature at the interface reaches the melting temperature thus assuring enough mobility for polymeric chains to get adhesion at the interface. Finally, the location and size of the heat-affected zone has been determined.
Some frames have been machined and successfully welded two by two to make electronic boxes. In future work, the welding parameters of specimens of PEKK filled with high thermal conductive fillers will be studied, in order to improve thermal management during operating cycles. More, power cycling ageing tests of SiC assemblies will be performed.
a.
!
ACKNOWLEDGMENT
The authors are grateful to the French Ministry of Higher Education and Research for financial support through the funding of a PhD thesis. This work was part of the Diamonix2 project, funded by FUI (French Interministry Fundings). The authors thank Dr Frederic Leonardi and the company Oudoul64 for the manufacturing of PEKK parts by injection molding.
REFERENCES
[1]! J.Tarrieu, Ph.D. thesis, Institut National Polytechnique de Toulouse, (2012) (in French)
[2]! R. Klein, Laser Welding of Plastics, Wiley VCH, (2012)
[3]! P. G. de Gennes, Comptes Rendus de l'Académie des Sciences, Paris, B291, (1980) (in French)
[4]! J.F.Lamethe, P.Beauchêne, L.Léger, Aerospace Science and Technology,
9 (2005)
[5]! M. Ilie, J-C. Kneip, S. Matteï, A. Nichici, C. Roze and T. Girasole, Inf. Phys. & Tech. 51, (2007)
[6]! M. Speka, S. Matteï, M. Pilloz and M. Ilie, NDT&E International 41 (2008)
[7]! G. Gouesbet and G. Gréhan, Atomic Sprays 10 (2000)
[8]! A.Chateau Akué Asséko, B.Cosson, F.Schmidt, Y.Le Maoult, E.Lafranche, Inf. Phys. & Tech. 72 (2015)
[9]! A.Chateau Akué Asséko, B.Cosson, F.Schmidt, Y. Le Maoult, R.Gilblas, E.Lafranche, Inf. Phys. & Tech. 73 (2015)
[10]! G. Gouesbet and G. Gréhan, J. of Optics 1 (1999).
[11]! C.M. Blanca and C. Saloma, Applied Optics, 37 (34) (1998).
[12]! B. Cosson, F. Schmidt, Y. Le Maoult, M. Bordival. Int J Mater Form 4:1– 10 (2011)