Science Arts & Métiers (SAM)
is an open access repository that collects the work of Arts et Métiers Institute of
Technology researchers and makes it freely available over the web where possible.
This is an author-deposited version published in: https://sam.ensam.eu
Handle ID: .http://hdl.handle.net/10985/18380
To cite this version :
Gabriel GUENOUN, Jean Yvon FAOU, Gilles RÉGNIER, Nicolas SCHMITT, Stéphane ROUX
PTFE crystallization mechanisms: Insight from calorimetric and dilatometric experiments
-Polymer - Vol. 193, p.1-8 - 2020
Any correspondence concerning this service should be sent to the repository
Administrator : [email protected]
PTFE crystallization mechanisms: Insight from calorimetric and dilatometric
experiments
Gabriel Guenoun
a,b,c,∗, Jean-Yvon Faou
b, Gilles Régnier
c, Nicolas Schmitt
a,d, Stéphane Roux
aaUniv. Paris-Saclay, ENS-Paris-Saclay, CNRS, Laboratoire de Mécanique et Technologie, 61 Avenue du Président Wilson, 94235 Cachan Cedex, France bSaint-Gobain Research Paris, 39 Quai Lucien Lefranc, 93303 Aubervilliers Cedex, France
cPIMM, Arts et Métiers, CNRS, CNAM, HESAM Université, 151 boulevard de l’Hôpital, 75013 Paris, France dINSPE, Univ. Paris-Est Créteil Val-de-Marne, Place du 8 mai, 1945 93203 Saint-Denis, France
A R T I C L E
I N F O
Keywords: PTFE Crystallization kinetics Thermal expansionA B S T R A C T
PTFE presents an original secondary crystallization that appears to be independent of the primary one. The conjunction of differential scanning calorimetry and dilatometry experiments has offered complementary data to study both crystallization melted compacted powder and of recrystallized samples. The primary crystallization is responsible for the crystallinity content variation with the cooling rate. It preserves the anisotropy induced by previous compaction that can be observed by dilatometry. Conversely, the secondary crystallization appears to be instantaneous, reversible, kinetic-free and isotropic. It occurs over a wide temperature range between 250◦C and 310◦C.
1. Introduction
Polytetrafluoroethylene (PTFE) is a semi-crystalline polymer offer-ing many attractive properties. Its very low coefficient of friction, high thermal stability, good electrical insulation properties, hydrophobicity and biocompatibility make PTFE a material of wide usage in numerous industrial applications [1–5].
Unlike other thermoplastics, it cannot be manufactured using con-ventional methods. Its high viscosity in the molten state precludes the use of injection molding process. Nascent PTFE powder can be either cold-pressed, extruded with an additional lubricant or via film casting [6]. After each of these processes, PTFE is generally sintered. Sintering consists in heating the part above its melting temperature before cooling it down to recrystallize the polymer. The sintering stage closes the initial porosity remaining after compaction and originat-ing from the powder state. The sintered parts exhibit a much higher cohesion as particles coalesce during the thermal treatment.
A sintering cycle generates important strains in PTFE. The concept of eigenstrain is very convenient to name the strain that would be mea-sured in a stress-free material if its microstructure and its temperature were spatially uniform [7]. For instance, in the case of a change of temperature, the eigenstrain is precisely the thermal expansion or contraction that a free solid with a uniform temperature would exhibit. PTFE overall eigenstrain originates from different physical mechanisms: thermal expansion, melting or crystallization, gas diffusion, porosity
∗ Corresponding author at: Univ. Paris-Saclay, ENS-Paris-Saclay, CNRS, Laboratoire de Mécanique et Technologie, 61 Avenue du Président Wilson, 94235 Cachan Cedex, France.
E-mail address: [email protected](G. Guenoun).
closure [8] and residual stress relaxation [9]. It was previously shown that the eigenstrain behavior of as-polymerized PTFE follows a specific behavior related to residual stress relaxation. The residual stresses are generated during the cold compaction stage. The relaxation leads to an anisotropic behavior as PTFE particles ‘‘recover’’ part of their initial configuration (before being pressed).
Among the mechanisms responsible for the eigenstrain, melting and crystallization have the largest part. Crystallization and melting generate large strain due to the density difference between crystalline and amorphous fraction [10]. In the case of cold-pressed PTFE sin-tering, large parts are subjected to thermal gradients. The coupling of the thermal inhomogeneity and large eigenstrain results in strain incompatibilities, and hence internal stresses, which may further lead to damage or cracking. Therefore understanding crystallization of PTFE and its kinetics is crucial to master internal stresses in a molded part during sintering.
Several authors have shown the influence of the thermal history on the crystallite size [11,12]. Crystal bands can be observed through scanning electron microscopy. Their thickness increases with crystal-lization temperature and with time due to the perfection of the crystals. Crystallization kinetics was shown to be a signature of one-dimensional growth [13–15]. PTFE was cooled at various cooling rates using ultra fast scanning calorimetry and it was shown that it crystallizes even at very high cooling rates (up to 800,000 ◦C/s) [16]. Therefore crystal
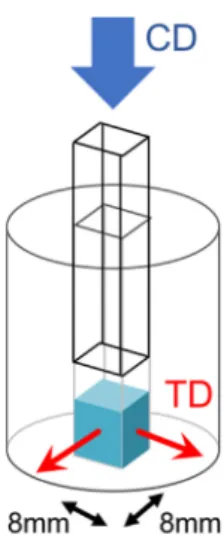
Fig. 1. Uniaxial compaction of PTFE powder inside a die to produce cubes of 8 mm edge length. The compaction direction (CD) and transverse directions (TD) are indicated.
nucleation can be considered as instantaneous. Another study, using temperature modulated calorimetry, showed an interesting ‘‘excess’’ of specific heat below its melting temperature [17]. Such anomaly could be associated to a reversible melting phenomenon.
This paper aims to address the original crystallization kinetic behav-ior for PTFE and its influence on the thermal eigenstrain of its melted state.
Calorimetric and dilatometric experiments are detailed in Section2. The two experiments bring complementary information on the crystal-lization mechanisms. In Section 3, calorimetric measurements reveal two distinctive crystallization mechanisms. Then dilatometric measure-ments indicate that the primary crystallization preserves a structural anisotropy whereas the secondary one presents a purely isotropic be-havior. Finally, a discussion is proposed to discriminate the observed secondary crystallization from a non linear specific heat.
2. Experimental 2.1. Material
A fine cut granular PTFE powder was used. Fine cut or low flow PTFE powder are usually manufactured by molding and sintering. The particle size ranges from 20 to 100 μm. Nascent PTFE crystallinity was evaluated at 90% via DSC considering a heat of fusion of 82 J g−1[10].
2.2. Sample preparation
Uniaxial compacted specimens were prepared. The powder was uniaxially pressed in a die at 50 MPa using a universal testing machine. Cubes of 8 mm edge length were obtained (seeFig. 1).
PTFE slices were obtained from the PTFE cubes using a microtome and then punched to fit inside a DSC pan. The slices thickness was chosen at 100 μm to make DSC samples of about 5 mg.
2.3. Calorimetric measurements
DSC experiments are performed to study the crystallization kinetics of PTFE. A heat flux DSC apparatus Q10 from TA instruments was used for the different calorimetric measurements. Nascent PTFE samples were first melted at 375◦C for 300 s and then cooled down at various
cooling rates.
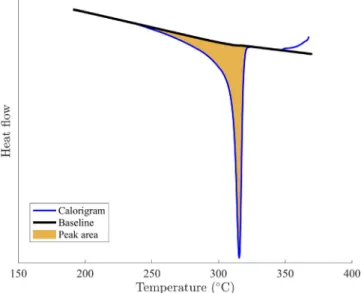
A calorigram is presented inFig. 2with heating and cooling rates of 10◦C/min.
Fig. 2. DSC calorigram obtained from green PTFE with heating/cooling rates of 10◦C/min. A second heating was performed to melt recrystallized PTFE. The first
heating stage is shown in dark red, first cooling in blue, second heating is light red. (For interpretation of the references to color in this figure legend, the reader is referred to the web version of this article.)
The first melting peak is quite narrow and occurs at a higher temperature than the second melting peak. This is attributable to the high crystallinity of nascent PTFE with large crystal lamellae. The nascent powder is crystallized upon polymerization which explains its perfection. The second melting peak is much smaller as recrystallized PTFE is usually around 30% to 50% crystalline.
The crystalization peak in blue can be integrated with respect to time to evaluate the latent heat due to crystallization. The final crystallinity content can be estimated and compared to the latent heat of fusion from the second melting peak. Both calculations lead to an evaluation of crystallinity close to 35%. The same integration method allows one to evaluate the crystallinity content as function of temper-ature. The crystalline fraction at a given temperature corresponds to the partial temporal integration of the crystallization peak between the start of the crystallization and the given temperature.
The specific heat of each phase, amorphous and crystalline, resp.
𝑐am𝑝 (𝑇 )and 𝑐cr
𝑝(𝑇 ), can be described as an affine variation with tempera-ture. However the overall specific heat 𝑐𝑝is not linear with temperature during the crystallization as it depends on the crystalline mass fraction
𝜒 ̃
𝑐𝑝(𝑇 , 𝜒) = 𝜒𝑐cr𝑝(𝑇 ) + (1 − 𝜒)𝑐𝑝am(𝑇 ) (1) As the crystallinity content 𝜒 obeys a kinetic law, it is not only dependent on temperature but also on thermal history, or during the DSC measurement performed at constant cooling rate, ̇𝑇 = 𝜙, on time and hence so does ̃𝑐𝑝.
Ideally, the specific heat flux ̇𝑞 extracted from a sample in a DSC cooling experiment obeys
̇𝑞= ̃𝑐𝑝𝑇̇ + 𝛥ℎam-cr𝜒̇ (2) where 𝛥ℎam-cris the specific heat of crystallization.
It is to be noted that both Eqs.(1)and(2)are non-linearly coupled, so that the evaluation of 𝜒 during a DSC measurement at fixed cooling rate, ̇𝑇 = 𝜙, cannot be directly obtained. It is proposed to estimate 𝜒 from an iterative process where the above equations are progressively made consistent with each other at convergence through a fixed-point algorithm.
To evaluate the crystallinity content as a function of time (or temperature using the prescribed (constant) cooling rate ̇𝑇 = 𝜙), a baseline heat flux only due to the temperature change at fixed phase
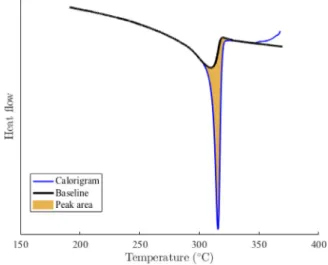
Fig. 3. Computed baseline to perform the crystallization peak integration for a molten PTFE sample cooled down at 10◦C/min.
mass fraction, ̇𝑞base(𝑡) = ̃𝑐𝑝𝑇̇, is introduced. However the measurement of 𝑐cr
𝑝 for purely crystalline is not directly available for the computation of ̃𝑐𝑝, so the asymptotic baseline of the recrystallized state ̇𝑞baserecr(𝑡)is
used instead. ̇𝑞base(𝑡) = 𝜒(𝑡) 𝜒∞ ̇𝑞 recr base(𝑡) + ( 1 −𝜒(𝑡) 𝜒∞ ) ̇𝑞baseam (𝑡) (3)
where 𝜒∞is the estimated asymptotic crystallinity at room temperature
evaluation of the recrystallized PTFE. ̇𝑞recr
base(𝑡)is related to ̃𝑐𝑝(𝑇 , 𝜒∞)at the end of the crystallization which is dependent on ̇𝑇 = 𝜙.
The integration of ̇𝑞exp(𝑡)from which the baseline ̇𝑞base(𝑡)has been
subtracted gives an evaluation of the crystallinity content 𝜒(𝑡) for a given cooling rate 𝜙
𝜒(𝑡) = 1 𝛥ℎam-cr∫ 𝑡 𝑡0 ( ̇𝑞exp(𝑡′) − ̇𝑞base(𝑡′) ) d𝑡′ (4)
where 𝑡0is the time of crystallization onset.
To initiate the determination of 𝜒(𝑡), a first evaluation is performed from the calorigram using a linear baseline for integration. Then, a new baseline is computed from Eq. (3), and from the latter, 𝜒(𝑡) is time integrated using Eq. (4). These two steps are repeated up to convergence to a fixed point, which requires typically no more than 2 to 3 iterations.Fig. 3shows the crystallization peak, the baseline at convergence and the integrated area.
2.4. Dilatometric measurements
The PTFE cubic specimens were placed inside a thermomechanical analyzer TMA/SDTA 840 from Mettler Toledo. The oven controls the temperature and a probe placed on top of the sample measures its dimension. The force exerted by the probe on the sample was set to 0.01 N. The true (or logarithmic) strain 𝜀𝑖𝑖 in direction 𝑖 can be estimated from the displacement 𝑢𝑖and the initial size 𝐿𝑖, as
𝜀𝑖𝑖≡ log ( 1 +𝑢𝑖 𝐿𝑖 ) (5) The temperature gradient was limited to a few degrees Celsius by choosing heating and cooling rates of 2 ◦C/min. The assumption of
an homogeneous temperature is essential to associate the true strain
𝜀𝑖𝑖to the ‘‘eigenstrain’’ of the material. Thermal computations showed that at this heating rate, the thermal gradient is less than 2◦C between
specimen core and skin.
The specimens were tested in the compaction direction (CD) and in the transverse direction (TD). The thermal history chosen for the dilatometry test is very similar to the one chosen for DSC. The sample was heated up from 30◦C to 375◦C and held at this temperature for
30 min. The sample is then cooled down back to 30◦C, held 30 min
and heated up again to 375◦C.
The volumetric strain is defined as
𝜀𝑣= log(𝑉
𝑉0
)
(6) with 𝑉 the total volume and 𝑉0 the reference total volume. The crys-talline mass fraction 𝜒 is also involved in 𝜀𝑣 as 𝑉 = (𝜒
𝜌cr +
1−𝜒
𝜌am )
𝑀
with 𝜌cr the density of the crystalline phase, 𝜌am the density of the amorphous phase and 𝑀 the sample mass.
It can be shown that d𝜀𝑣 d𝑇 = d𝜒 d𝑇 𝛥𝜀 am-cr 𝑣 + 𝑓 𝛽cr+ (1 − 𝑓 ) 𝛽am (7) where 𝛥𝜀am-cr
𝑣 is the volumetric strain induced by a crystallization, 𝑓 is the crystalline volume fraction related to 𝜒 via 𝑓 = 𝜒(𝜌∕𝜌cr
) with
𝜌the current density of the sample. 𝛽crand 𝛽am are the volumetric
thermal expansion coefficient of respectively the crystalline and the amorphous phase. The dilatometric experiments allows one to measure the displacements in the compaction and transverse directions. Due to the uniaxial compaction, the properties of the PTFE part can be con-sidered as transverse isotropic. The volumetric strain can be computed via the strain in CD and TD:
𝜀𝑣= 𝜀𝐶𝐷+ 2𝜀𝑇 𝐷 (8)
In addition to containing information on the crystallinity evolu-tion, dilatometric tests provide information on the strain anisotropy. Confronting results from DSC and dilatometry allows the consolidation of the observations [18] and to better understand the crystallization process of PTFE.
3. Results and discussion
3.1. Crystallization dependence with cooling rate
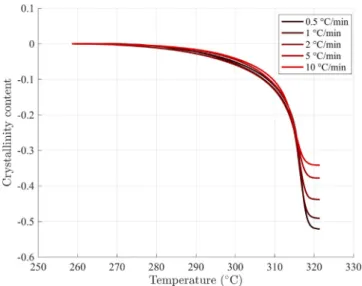
The crystallinity content 𝜒 evolution with temperature was obtained for various cooling rates thanks to the DSC experiments (Fig. 4). As already noted in previous works [8,19], the final crystallinity content is dependent on the cooling rate. The crystallization temperature onset is estimated to be 318◦C almost independently on the cooling rate.
The crystallinity increases very rapidly over 5–10◦C. Basset
ob-served growth of the lamellae with time spent in the similar tem-perature range [11]. At lower temtem-peratures, the crystallinity content continues to step up, but much slower over a range of 50◦C. The
marked difference between those two stages suggests that a secondary crystallization mechanism takes place.
Secondary crystallization mechanisms are usually encountered as a different mechanism driven by the primary crystallization [20–22]. However, surprisingly, PTFE’s secondary crystallization seems to be independent of the primary crystallization as its contribution to crys-tallinity is observed not to depend on the cooling rate as shown in Fig. 5. It appears that a mere shift of the crystallinity versus tem-perature curves, measured for the different cooling rates, so that the same final crystallinity is reached, appears to collapse all data onto a single master curve with a very good (although imperfect) accuracy. The curves appear to slightly fan out around 300◦C, however there is
no systematic trend of the deviation with the cooling rates. Moreover, this difference may be due to imperfect baseline corrections, and thus no interpretation of this minute data dispersion is proposed. Rather, the good quality of the collapse is considered meaningful as the main evolution of the crystallinity content is extremely similar below 310◦C
for all cooling rates. This figure further suggests that this secondary stage (between 315 and 260◦C) is identical for all rates.
Fig. 4. Crystallinity content 𝜒 evolution during crystallization for various cooling rates.
Hence, the primary crystallization is responsible for the final crys-tallinity content variations obtained after different thermal histories.
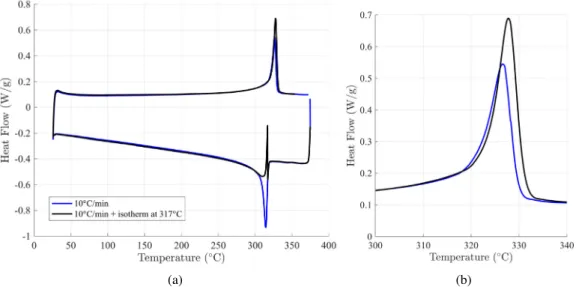
Two DSC experiments were designed to secure the previous conclu-sions. To confirm that the secondary crystallization is independent on the cooling rate, a DSC was performed at a different cooling rate only in the temperature region of the secondary crystallization (Fig. 6). To confirm that the primary crystallization is dependent on the time spent between 320 and 310◦C), an isotherm is added at 317◦C (Fig. 7). The
obtained results are compared to a control experiment.
Fig. 6shows a DSC experiment on a melted PTFE sample cooled down to ambient temperature. The initial cooling rate is 10 ◦C/min
and is turned down to 5◦C/min below 310◦C. Then the crystallized
PTFE sample is heated above its melting temperature. The melting peak can be compared to the one of the control experiment where a PTFE sample was integrally cooled down at 10◦C. It appears that the
melting peaks are superimposed (Fig. 6b) which means that the final crystallinity contents are the same. This observation tends to confirm that the secondary crystallization is not dependent on the cooling rate and that the final crystallinity is due to the thermal history in the primary crystallization temperature region.
Fig. 5. Crystallinity content 𝜒 evolution for various cooling rates shifted to reach the same final level. It appears that the measurements between 315 and 260◦C for all
cooling rates are almost coincident.
The difference between the heat flow ̇𝑞 of the experiment and the reference below 310◦C is caused by the dependence of ̇𝑞 on ̇𝑇 . Ideally,
the DSC signals ̇𝑞 obtained at cooling divided by ̇𝑇 (see Eq.(2)) should be identical if the secondary crystallization is the same. However, in practice, this validation is not feasible as an additional offset coming from the DSC setup affects the measurement and cannot be simply canceled.
Similarly, the two signals at heating appear to be slightly different at low temperature. One could assume that the modified cooling below 310◦C is at the origin of this difference. Nevertheless, the behavior at
melting above this temperature is exactly the same which means that the crystallized fraction obtained below 310◦C is not related to what
crystallized at higher temperatures. It supports the assumption of two separate crystallization mechanisms. However such difference would mean that the specific capacity at low temperature has consequently changed which is not likely to happen (as the crystallinity content is not drastically modified). This difference is most probably due to the additional offsets present in the two measurements. These offsets could
Fig. 6. DSC experiment to test the secondary crystallization mechanism. A molten PTFE sample is cooled down at 10◦C/min until 310◦C and then cooled down at 5◦C. The
sample is then heated up at 10◦C/min and its melting peak is compared to the reference sample exclusively cooled down at 10◦C/min (a). A zoom is made on the melting peaks
Fig. 7. DSC experiment to test the primary crystallization mechanism. A molten PTFE sample is cooled down at 10◦C/min until 317◦C, is held at this temperature for 2 h and
then is cooled down at 10◦C/min. The sample is then heated up at 10◦C/min up to its melting peak and is compared to the reference sample merely cooled down at 10◦C/min
(a). A zoom is made on the melting peaks (b).
come from the different thermal contacts. The heating signals can then be treated to remove the baseline (as mentioned for crystallization) in order to extract the melting peaks for both experiments. This post-treatment confirms that the two peaks are similar and that secondary crystallization does not seem to depend on cooling rate.
Fig. 7 shows a DSC experiment where a melted PTFE sample is cooled down to 317◦C at 10◦C/min, held for two hours at 317◦C and
then cooled down at 10◦C/min to ambient temperature. Further on, the
crystallized PTFE sample is heated back above its melting temperature. The melting peak is compared to the same control experiment where a PTFE sample was cooled down at 10◦C without interruption. This
comparison (Fig. 7b) suggests that the hold time increased the final crystallinity content and consequently affected the overall crystallinity content.
As observed from the previous experiment (Fig. 6), the modification of the melting peak at high temperatures is related to the crystallization that occurred above 310 ◦C and that is most likely related to the
so-calledprimary crystallization. Therefore primary crystallization appears to be kinetic dependent in contrast to the secondary crystallization. From a structural point of view, the increase of the melting peak to-wards high temperatures implies a crystalline lamellae thickening [19]. The broad region of the melting peak at lower temperatures which seems to be related to the secondary crystallization would therefore indicate much smaller crystallites.
3.2. Anisotropic thermal expansion
Overall thermal eigenstrain measurements also provide information on the phase change due to the density variation. At 25◦C, the density
of the PTFE crystal is 2.302 g/cm3and the density of the amorphous
phase is about 2.0 g/cm3[10]. Therefore large variations of the sample
dimensions are measured at melting and crystallization via TMA. The same type of thermal cycle as in DSC was performed on a PTFE sample in a TMA instrument: a first heating, a plateau, a cooling and then a second heating. The heating and cooling rates were set to 2 ◦C/min to limit the thermal gradients from the skin to the core
of PTFE sample. The PTFE sample was melted a first time and held at 375 ◦C for 100 min (Fig. 8a). Further, the melted sample was
cooled down at ambient temperature and then heated up again. The displacement in the compaction direction (CD) and in the transverse di-rection (TD) were measured on two different samples as a transversally isotropic behavior is expected due to the uniaxial compaction process.
Fig. 8. (a) Thermal cycle imposed for the TMA experiment. (b) Measured true strain of the PTFE samples (50 MPa-pressed) during the thermal cycle in CD and TD. The reference state for strain evaluation is chosen at the end of the sintering period (at 250 min).
Fig. 8shows the measured true strains (in CD and TD) as functions of time. The strain reference has been set at the end of the cooling. It can be set by a mere translation along the strain axis thanks to the choice of logarithmic (Hencky) strains. The first striking feature observed in Fig. 8b is the symmetry between the cooling and the second heating. The anisotropy of the first heating was studied in an earlier study and was shown to be related to residual stress relaxation originating from cold compaction [8,9].
Fig. 9. (a) Measured strain (CD and TD) as function of temperature, for the cooling and the second heating (of a melted PTFE sample uniaxially compacted at 50 MPa); (b) Strain in CD as function of strain in TD compared to line 𝑦 = 𝑥 representing an isotropic behavior. (For interpretation of the references to color in this figure legend, the reader is referred to the web version of this article.)
This symmetry can be highlighted more quantitatively by plotting the strains measured in the cooling and the second heating stages as a function of temperature (seeFig. 9a). Below 300◦C, the cooling strain
and the second heating strain are almost perfectly superimposed. In this temperature range, the overlap means that the crystallization is reversible and shows no hysteresis. This result is consistent with earlier observations [17].
Plotting the CD and TD curves (resp. shown in blue and red) one against the other, inFig. 9b, provides information on the anisotropy. The slope of the curve quantifies the anisotropy of the strain. Therefore, the strain at cooling and at the second heating are isotropic below respectively 310◦C and 325◦C. Above this temperature, the curve can no more be superimposed with the line 𝑦 = 𝑥 that characterizes an isotropic behavior. It shows that the secondary crystallization induces an isotropic behavior which is reversible meaning it is the same at cooling and heating. Conversely, the primary crystallization appears to lead to an anisotropic behavior similarly to melting, reminiscent of the initial crystalline orientation. The observed hysteresis is related to the primary crystallization, which is not reversible.
Furthermore,Fig. 9balso reveals that the thermal expansion of the amorphous phase is anisotropic whereas the thermal expansion of the recrystallized PTFE is isotropic. This is a surprising paradox for PTFE. In most cases, polymer melts have a completely isotropic behavior and once recrystallized, an orientation may be generated and induce an anisotropic behavior. In the case of uniaxially compacted PTFE, the opposite occurs. The exact reason for this behavior is not completely understood. It is almost certain that PTFE melt is still orientated due to the low mobility of the molecular chains however the reason for an isotropic behavior after crystallization is unclear.
Based on previously published results [11,12,19], and on the above reported experiments, it may be concluded that the primary crystal-lization consists in the formation of large crystal bands that thickens with time as temperature decreases between 320 and 310 ◦C. This
first phase transformation is rate limited and exhibits the large scale anisotropy induced by the initial cold compaction, which does not com-pletely vanish after melting. In contrast, the secondary crystallization displays no hysteresis, so that it depends only (and instantaneously) on temperature. Thus it can be considered as an equilibrium reversible process. It is thus plausible that it consists in the nucleation-free [17] formation of many small crystals certainly of random orientation (as it induces an isotropic behavior), and hence not related to the primary crystals.
3.3. Secondary crystallization as non linear heat capacity
Because the secondary crystallization appears to be an equilibrium phenomenon, with no history (or time) dependence, it could be in-cluded into a non-linear dependence of the heat capacity of the crystal
Fig. 10. Modified baseline from DSC experiment with a non linear shape at lower temperature to fit the lower part of the crystallization peak. Such baseline enables the measurement of the primary crystallization only through the peak integration (to be compared withFig. 3).
phase with temperature. Thereby, its calorimetric contribution was included into an effective 𝑐𝑝so as to define another baseline ̇𝑞basein DSC analyses as illustrated inFig. 10. From the DSC data, from whatever prescribed temperature–time evolution, there is no way to distinguish this analysis from the earlier one (shown inFig. 3).
Likewise, the eigenstrain component imposed by the secondary crystallization could be replaced by an isotropic thermal expansion coefficient 𝛽(𝑇 ) depending on the temperature instead of a constant one (see Eq.(7)).
By construction, both descriptions give equivalent results to predict calorimetric and dilatometric experiments with PTFE.
The only way to assess that the alleged variations of 𝑐𝑝 or of
𝛽 with 𝑇 are due to a secondary crystallization is to measure the final crystallinity content. Crystallinity measurements on PTFE are not considered as very accurate [23] but trends are consistent.
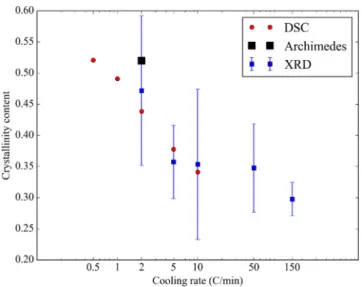
Different measurements of the final crystallinity content are gath-ered inFig. 11as a function of the cooling rate. Some measurements are coming from the DSC peak integration taking into account the secondary crystallization (first procedure). In addition, data from wide angle X-ray scattering (WAXS) performed at the European synchrotron radiation facility (ESRF), are presented. The crystalline peak and the amorphous halo are integrated on the diffractogram, providing respec-tively 𝐼crand 𝐼am. The ratio 𝐼cr∕(𝐼cr+𝐼am)gives a second estimate of the
Fig. 11. Final crystallinity content measured via DSC, XRD and Archimedes density measurement for different cooling rates.
crystallinity content. On those WAXS measurements, the uncertainty is quite high due to the choice of the baseline. For each cooling rate, two measurements were performed and the crystallinity content was evaluated with a lower and a higher value from the choice of the baseline. A consistent methodology was applied and the observed trend is coherent with the DSC measurements. A third evaluation was obtained after sintering on the TMA machine by density measurements using Archimedes’ principle. The crystallinity is evaluated from the value of the density knowing the density of the amorphous and the crystalline phase. The result was averaged over three experiments. All resulting data are consistent with the other measurements.
The crystallinity results confirm that the values obtained by DSC taking into account the secondary crystallization give the correct crys-tallinity content. Without the secondary crystallization, the DSC values would drop by 25%, reaching a value too small to be consistent with the other measurements.
To further investigate the existence of a secondary crystallization mechanism, X-ray diffraction experiments were performed during the cooling of molten PTFE.Fig. 12provides the value of the integration of the crystalline peak observed on the measured X-ray diffractogram as function of temperature during cooling stage. This scalar is a good in-dicator of the evolution of the crystallinity content. It reveals that new crystals are still being formed below 310◦C. This result again seems to
confirm that the reversible phenomenon observed using DSC and TMA experiments is an original secondary crystallization mechanism.
The X-ray diffraction experiment performed during cooling at ESRF synchrotron facility also provides information on the crystalline orien-tation during crystallization. The methodology of determination of the crystalline orientation from 2D X-ray snapshots will be presented in a forthcoming publication.
4. Conclusion
As previously noticed, PTFE exhibits a very large excess heat ca-pacity over a large temperature range [17]. It has been argued in the present study that this apparent excess heat capacity actually originates from a reversible latent heat instead of a plain specific heat. The latent heat is associated to an original crystallization mechanism termed secondary crystallization as opposed to the primary one that occurs at high temperature and that is kinetic dependent. Secondary crystallization appears to be surprisingly reversible, which means that no hysteresis is observed between its melting and crystallization. This is to be contrasted with usual polymer phenomenology (such as the
Fig. 12. Evolution of the integrated X-ray diffracted crystalline peak as function of temperature at cooling.
primary mechanism), as no dependence on temperature history nor on temperature rate has been observed. Thus no high activation barrier, no nucleation process and no rate-limited transition appear to be at play. The primary crystallization is responsible for an eigenstrain that keeps (at least) part of the crystalline orientation induced by the initial compaction. As PTFE molar mass is very high, it is expected that the macromolecules keep their large scale orientation even in the molten state. Primary crystals could be originating from the polymer chains whose large scale orientation is inherited from the preparation stage (cold pressing) to form crystalline bands. Those bands would thicken due to crystal perfection with time as temperature is lowered. The high molar mass also causes preferential orientation at a lower scale as the chain mobility is extremely low. This preferential orientation is remnant from the nascent crystals and it most certainly explains the fast crystallization kinetics similar to the one observed in the case of flow-induced crystallization. On the contrary, the secondary crystallization induces an isotropic eigenstrain. It could be related to small crystals independent from the primary crystals that are at thermal equilibrium. Observing PTFE crystallization via in-situ test using scanning elec-tron microscopy would be very interesting. The thickening of the primary crystals could be observed and the secondary crystals would probably be too small to be seen. However, the absence of visual change in the secondary crystallization temperature range would support this hypothesis.
The eigenstrain behavior is very different between as-polymerized PTFE (first heating) and melted PTFE (cooling and second heating). For as-polymerized PTFE, the eigenstrain is affected by the residual stress relaxation due to the compaction stage. This leads to very anisotropic eigenstrains. For melted PTFE, the eigenstrain is only anisotropic in the molten state and in the first part of the crystallization (or melting of the primary crystals). At lower temperature, either secondary crystal-lization and melting or thermal expansion are isotropic and reversible. It would be interesting to understand why recrystallized PTFE thermal expansion seems isotropic while that of molten PTFE is anisotropic.
Declaration of competing interest
The authors declare that they have no known competing finan-cial interests or personal relationships that could have appeared to influence the work reported in this paper.
CRediT authorship contribution statement
Gabriel Guenoun: Investigation, Writing - original draft. Jean-Yvon Faou: Supervision, Project administration. Gilles Régnier:
Su-pervision, Writing - review & editing.Nicolas Schmitt: Supervision,
Writing - review & editing. Stéphane Roux: Supervision, Writing
-review & editing.
Acknowledgments
The authors would like to thank Saint-Gobain for sponsoring this work and especially Xavier Brajer, Monika Brodesser, François Creuzet, René Gy, Ansgar Haeger and Georges Moineau for their implication in the project. The support of the ANRT through the CIFRE PhD grant of G.G. is gratefully acknowledged. The X-ray diffraction experiments were performed on beamline D2AM BM02 at the European Synchrotron Radiation Facility (ESRF), Grenoble, France. We are grateful to Nathalie Boudet and Nils Blanc at the ESRF for providing assistance in using beamline D2AM BM02.
References
[1] S. Biswas, K. Vijayan, Friction and wear of PTFE—a review, Wear 158 (1–2) (1992) 193–211.
[2] J.M. Cox, B.A. Wright, W.W. Wright, Thermal degradation of fluorine-containing polymers. Part I. Degradation in vacuum, J. Appl. Polym. Sci. 8 (6) (1964) 2935–2950.
[3] E. Giannetti, Semi-crystalline fluorinated polymers, Polym. Int. 50 (1) (2001) 10–26.
[4] J. Zhang, J. Li, Y. Han, Superhydrophobic PTFE surfaces by extension, Macromol. Rapid Commun. 25 (11) (2004) 1105–1108.
[5] M.A. Golub, T. Wydeven, Reactions of atomic oxygen (O(3p)) with various polymer films, Polym. Degrad. Stab. 22 (4) (1988) 325–338.
[6] S. Ebnesajjad, Fluoroplastics, Volume 1: Non-melt Processible Fluoropolymers: The Definitive User’s Guide and Data Book Plastics Design Library, Elsevier, 2014.
[7] T. Mura, General theory of eigenstrains, in: Micromechanics of Defects in Solids, Springer, 1987, pp. 1–73.
[8] R.B. Canto, N. Schmitt, J. De Carvalho, R. Billardon, Experimental identi-fication of the deformation mechanisms during sintering of cold compacted polytetrafluoroethylene powders, Polym. Eng. Sci. 51 (11) (2011) 2220–2235.
[9] G. Guenoun, J.-Y. Faou, G. Régnier, N. Schmitt, S. Roux, Thermal cycling of cold-pressed PTFE compacts: Reversible and irreversible behavior, Polym. Test. (2019).
[10] D. Kerbow, C. Sperati, in: J. Brandrup, E.H. Immergut, E.A. Grulke (Eds.), In Polymer Handbook, Wiley, New York, 1999.
[11] D. Bassett, R. Davitt, On crystallization phenomena in polytetrafluoroethylene, Polymer 15 (11) (1974) 721–728.
[12] J. Yang, K. Petersen, R. Williams, P. Geil, T. Long, P. Xu, Morphology evolution in PTFE as a function of melt time and temperature I: High molecular weight single-and multi-molecule folded chain single crystals and band structures, Chin. J. Polym. Sci. 23 (02) (2005) 123–135.
[13] T. Ozawa, Nonisothermal crystallization of poly(tetrafluoroethylene), Bull. Chem. Soc. Japan 57 (4) (1984) 952–955.
[14] Y. Seo, Nonisothermal crystallization kinetics of polytetrafluoroethylene, Polym. Eng. Sci. 40 (6) (2000) 1293–1297.
[15] X.Q. Wang, D.R. Chen, J.C. Han, S.Y. Du, Crystallization behavior of polytetrafluoroethylene (PTFE), J. Appl. Polym. Sci. 83 (5) (2002) 990–996.
[16] N. Bosq, N. Guigo, E. Zhuravlev, N. Sbirrazzuoli, Nonisothermal crystallization of polytetrafluoroethylene in a wide range of cooling rates, J. Phys. Chem. B 117 (12) (2013) 3407–3415.
[17] R. Androsch, B. Wunderlich, H.-J. Radusch, Analysis of reversible melting in polytetrafluoroethylene, J. Therm. Anal. Calorim. 79 (3) (2005) 615–621.
[18] A. Greco, A. Maffezzoli, Polymer melting and polymer powder sintering by thermal analysis, J. Therm. Anal. Calorim. 72 (3) (2003) 1167–1174.
[19] L. Ferry, G. Vigier, R. Vassoille, J. Bessede, Study of polytetrafluoroethylene crystallization, Acta Polym. 46 (4) (1995) 300–306.
[20] I.H. Hillier, Modified avrami equation for the bulk crystallization kinetics of spherulitic polymers, J. Polym. Sci. A 3 (9) (1965) 3067–3078.
[21] R. Kolb, C. Wutz, N. Stribeck, G. von Krosigk, C. Riekel, Investigation of secondary crystallization of polymers by means of microbeam X-ray scattering, Polymer 42 (12) (2001) 5257–5266.
[22] M.J. Jenkins, K.L. Harrison, The effect of molecular weight on the crystallization kinetics of polycaprolactone, Polym. Adv. Technol. 17 (6) (2006) 474–478.
[23] R. Lehnert, P. Hendra, N. Everall, N. Clayden, Comparative quantitative study on the crystallinity of poly(tetrafluoroethylene) including Raman, infra-red and 19f nuclear magnetic resonance spectroscopy, Polymer 38 (7) (1997) 1521–1535.