Pulse pressure and cardiovascular autonomic neuropathy according to
duration of type 1 diabetes
J. C. Philips M. Marchand A. J. Scheen*
Division of Diabetes, Nutrition and Metabolic Disorders, Department of Medicine, CHU Sart Tilman, B-4000 Liège, Belgium
Abstract
Background To evaluate changes in pulse pressure (PP) and markers of cardiovascular autonomic neuropathy
(CAN) according to duration of type 1 diabetes mellitus (T1DM).
Methods This cross-sectional controlled study evaluated 159 diabetic patients during a 3-min posture test
(standing-squatting-standing) with continuous measurement of systolic (SBP), diastolic (DBP) and mean (MBP) blood pressure by a Finapres device. Arterial stiffness was indirectly assessed by PP and the slope of PP as a function of MBP calculated during the whole 3-min test. CAN was assessed by the expiration/inspiration pulse interval ratio (E/I R-R ratio) during deep breathing and by three indices measured during the squatting test. Patients were divided into four groups according to diabetes duration (<10 years, 11-20 years, 21-30 years and >30 years from group 1 to group 4, respectively) and compared with age-matched non-diabetic subjects.
Results PP progressively increased (p < 0.0001) and PP/MBP decreased (p < 0.0005) according to T1DM
duration, whereas these parameters remained almost unchanged in age-matched control subjects. E/I ratio (p < 0.0001) and baroreflex gain (p < 0.0005) progressively decreased with T1DM duration. The
parasympathetic index (squatting test vagal ratio - SqTv) significantly increased (p < 0.0001), whereas the sympathetic index (squatting test sympathetic ratio - SqTs) only tended to decrease (p = 0.12) according to diabetes duration. No such changes in CAN indices were observed in the non-diabetic population.
Conclusions PP increased according to T1DM duration in an age range where PP remained almost stable in
controls, in agreement with accelerated arterial stiffening due to chronic hyperglycaemia. The baroreflex gain decreased and other indices of CAN also deteriorated with diabetes duration, more so indices reflecting parasympathetic rather than sympathetic dysfunction.
Keywords arterial stiffness; cardiovascular autonomic neuropathy; pulse pressure; squatting; finapres; type 1
diabetes
Introduction
Arterial pulse pressure (PP) is a surrogate marker of large artery stiffness and is considered as an independent cardiovascular disease (CVD) risk factor in the general population [1], as shown in two epidemiological studies, the Framingham study [2] and the PROCAM study [3]. Increased PP as a marker of CVD risk has been shown to be present in both normotensive and hypertensive individuals [4]. Similar observations have also been reported in three large longitudinal studies of patients with type 2 diabetes mellitus (T2DM), a population with a well-known high CVD risk [5-7].
The concept of a more pronounced increase in arterial stiffness and the reality of an early vascular ageing in type 1 diabetes mellitus (T1DM) were evoked one more time [8,9]. However, studies regarding PP are rather scarce in patients with T1DM. In the Finnish Diabetic Nephropathy (FinnDiane) study [10], a higher systolic blood pressure (BP) and an earlier decrease in diastolic BP resulted in a higher and more rapidly increasing PP in T1DM patients as compared with non-diabetic control subjects. In the EURODIAB study [11,12], PP was a risk factor for CVD and total mortality in T1DM patients. Taking together, these two large studies suggest that accelerated arterial aging may contribute to the higher CVD morbidity and mortality in patients with T1DM. Cardiovascular autonomic neuropathy (CAN) is an underestimated complication of diabetes [13-15]. It is usually detected by the assessment of changes in heart rate (HR) and/or BP during various dynamic tests [13,15]. It has been shown to be associated with an increased mortality in a meta-analysis of available studies in patients with
T1DM [16]. CAN was also associated with increased cardiovascular risk factors and increased mortality in the EURODIAB IDDM Complications Study [12,17].
The aim of the present study was to investigate the influence of the duration of T1DM on PP, as indirect marker of arterial stiffness and primary endpoint, and on markers of CAN, as secondary endpoints, in patients who were evaluated during an original squatting test with continuous monitoring of arterial BP and HR. The results were compared with a non-diabetic population matched for age to discriminate between the effect of diabetes duration and normal aging [18].
Methods Patients
A total of 159 T1DM patients were evaluated. Patients have been recruited among the patients followed in our department. Inclusion criteria were the following: T1DM patients between 20 and 60 years, male and female, body mass index < 30 kg/m2, duration of diabetes > 1 year and HbA
1c < 12%. Exclusion criteria were the
following: history of CVD, including hypertension; any severe illness during the previous 3 months; renal insufficiency defined as an estimated creatinine clearance below 45 mL/min; medications that may significantly influence cardiovascular reflexes (for instance, tricyclic antidepressants, antipsychotics, etc.). Thirty patients were treated with an angiotensin converting enzyme inhibitor (ACEI) or an angiotensin AT1 receptor blocker (ARB), as monotherapy. Such pharmacological treatment was initiated since at least 3 months, at a stable dose, because of the presence of microalbuminuria, in absence of hypertension. It has been shown that monotherapy with inhibitors of the renin-angiotensin system only modestly affects arterial stiffness [19]. Furthermore, in a pilot study, we showed that such treatment does not significantly influence CAN indices measured during a squatting test (unpublished; data not shown). Microalbuminuria was present in 23 patients (being treated or not with an inhibitor of the renin-angiotensin system; see further details below). Insulin therapy systematically consisted in a basal-prandial regimen, with multiple daily injections in 135 patients and a continuous subcutaneous insulin infusion with a portable pump in 24 patients.
Subjects were retrospectively separated according to diabetes duration: group 1: ≤10 years (G1; n = 39); group 2: 11-20 years (G2; n = 45); group 3: 21-30 years (G3; n = 57); and group 4: > 30 years (G4; n = 18).
To differentiate the effects of duration of T1DM from the effect of normal aging [18], healthy subjects were used as controls and matched for age, sex and body mass index (n = 28-30 in each subgroup; Table 1). The study was accepted by the ethical committee of our institution.
Orthostatic test
The squatting test (successively 1 min standing, 1 min squatting, 1 min standing in our in-house protocol) is an original active orthostatic test that leads to the most important and fast variations of the hydrostatic level with posture, and consequently, most strongly stimulates the homeostatic loop to maintain BP [20,21]. Squatting produces a prompt increase in cardiac output and arterial BP, essentially attributed to augmented venous return from compression of leg veins. These changes are accompanied by an immediate decrease in HR and forearm vascular resistance, probably due to activation of cardiopulmonary and arterial baroreflexes [22]. We recently reported, using the same diabetic population as in the present study, that squatting amplifies PP increase with diabetes duration [23]. Interestingly, the same squatting test has also been used with success in patients with T1DM or T2DM to derive various vagal and sympathetic indices able to detect CAN (see below) [24,25].
BP and HR monitoring
Changes in systolic and diastolic BP, and thus mean BP (MBP), and in HR were measured continuously with a Finapres (from FINger Arterial PRESsure) instrument (Ohmeda, USA) that allows to carefully study
cardiovascular reflexes [26-28]. The Finapres is based on servoplethysmomanometry, employing the volume clamp technique at the finger level. PP was automatically calculated by the difference between systolic BP and diastolic BP.
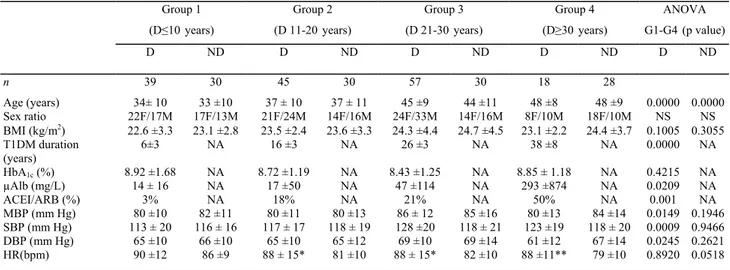
Table 1. Characteristics of the diabetic patients (D) with type 1 diabetes (T1DM) and non-diabetic subjects (ND) used as controls in the four subgroups divided according to diabetes duration and age matching, respectively, and average mean blood pressure (MBP), systolic blood pressure (SBP), diastolic blood pressure (DBP) and heart rate (HR) values recorded during the 3-min squatting test
Group 1 Group 2 Group 3 Group 4 ANOVA
(D≤10years) (D 11-20years) (D 21-30years) (D≥30years) G1-G4(p value)
D ND D ND D ND D ND D ND n 39 30 45 30 57 30 18 28 Age (years) 34± 10 33 ±10 37 ± 10 37 ± 11 45 ±9 44 ±11 48 ±8 48 ±9 0.0000 0.0000 Sex ratio 22F/17M 17F/13M 21F/24M 14F/16M 24F/33M 14F/16M 8F/10M 18F/10M NS NS BMI (kg/m2) 22.6 ± .33 23.1 ± .82 23.5 ±2.4 23.6 ± .33 24.3 ±4.4 24.7 ± .54 23.1 ±2.2 24.4 ±3.7 0.1005 0.3055 T1DM duration (years) 6±3 NA 16 ±3 NA 26 ±3 NA 38 ±8 NA 0.0000 NA HbA1c (%) 8.92 ±1.68 NA 8.72 ±1.19 NA 8.43 ±1.25 NA 8.85 ± 1.18 NA 0.4215 NA µAlb (mg/L) 14 ± 16 NA 17 ±50 NA 47 ±114 NA 293 ±8 47 NA 0.0209 NA ACEI/ARB (%) 3% NA 18% NA 21% NA 50% NA 0.001 NA MBP (mm Hg) 80 ±10 82 ±11 80 ±11 80 ±13 86 ± 12 85 ±16 80 ±13 84 ±14 0.0149 0.1946 SBP (mm Hg) 113 ± 20 116 ± 16 117 ± 17 118 ± 19 128 ±20 118 ± 21 123 ±19 118 ± 20 0.0009 0.9466 DBP (mm Hg) 65 ±10 66 ±10 65 ±10 65 ±12 69 ±10 69 ±14 61 ±12 67 ±14 0.0245 0.2621 HR(bpm) 90 ±12 86 ±9 88 ± 15* 81 ±10 88 ± 15* 82 ±10 88 ±11** 79 ±10 0.8920 0.0518
Results are expressed as mean ± SD. BMI, body mass index; NS, non-significant; NA, not applicable; ACEI, angiotensin converting enzyme inhibitor; ARB, angiotensin AT1 receptor blocker; µAlb, microalbuminuria; HbA1c, glycated
haemoglobin. Unpaired t test D versus ND: *ρ < 0.05; **ρ < 0.01. Assessment of arterial stiffness
Arterial stiffness was indirectly estimated from PP values [1,29]. Average values of PP were calculated for each subject throughout the three phases of the squatting test. Separate values in either the squatting position or in the standing position were reported elsewhere [23]. Here, only overall PP, i.e. PP calculated during the 3-min test while standing-squatting-standing, after exclusion of the transition phases, was used in the analysis. The percentages of subjects with PP > 60 mm Hg, a threshold associated with higher CVD risk in T2DM [6], were calculated in each subgroup of subjects. We also measured the slope of PP as a function of MBP (PP/MBP) obtained from the 3-min BP recordings. This slope reflects the damping capacity of the large arteries that transform the discontinuous flow generated by the left ventricle into a continuous flow [30].
Detection of CAN
Numerous methods have been proposed to detect CAN in diabetic patients [31,32]. The deep-breathing test (6 cycles per minute, in sitting position) allows the calculation of maximum pulse (R-R) interval duration (during expiration = E) and minimum R-R interval duration (during inspiration = I): the so-called E/I R-R ratio is decreasing with CAN (thus being used as a marker of CAN in clinical practice), but also with age (thus imposing the use of a reference age-matched control group) [31,32]. CAN was also defined as HR change during deep breathing <10 bpm, i.e. a E/I R-R ratio <1.10, which was proposed as abnormal by Ewing et al. [31]. Another marker of CAN could be derived from the measurement of the baroreflex sensitivity [33]. We previously reported that the baroreflex gain can be calculated during the transition phase from squatting to standing [14,34]. The abrupt drop in MBP is associated with a reflex tachycardia, which is followed by a return to baseline values of both parameters (MBP increase and HR decrease). Such haemodynamic changes are similar to those seen when using a vasodilating drug (hypotension with reflex tachycardia) and a vasoconstricting agent (hypertension associated with bradycardia) [33]. The baroreflex gain was calculated by plotting the pulse intervals (R-R) against MBP during the transition phase from squatting to standing. The slope represents the baroreflex sensitivity and corresponds to changes in pulse intervals per millimetre change in arterial BP. In a pilot study [34], we were able to demonstrate that the reduction of baroreflex gain during the squatting test is a sensitive marker of CAN in patients with T1DM.
Finally, we also measured two autonomic indices based on the HR changes during the squatting test [24,25]. Indeed, HR responses observed during squatting and after standing may be useful to assess the functional integrity of cardiovascular autonomic nerves. The bradycardia during squatting is under vagal control, whereas tachycardia after standing from squatting is secondary to sympathetic stimulation [25]. The squatting-induced response was expressed by SqT vagal ratio (SqTv), which is the ratio between the baseline R-R interval (mean of
10 beats just before squatting) and the longest R-R interval in the first 15 s of squatting, and SqT sympathetic ratio (SqTs), which is the ratio between the baseline R-R interval and the shortest R-R interval in the first 10-20 s of standing after squatting, as previously described [24,25].
Other measurements
Blood glucose control was assessed by concomitant HbA1c levels (normal values 4-6%) to have an idea of the
recent blood glucose control in the diabetic patients participating to the study.
Incipiens nephropathy was defined as the presence of increased albumin excretion rate, either microalbuminuria (30-300 mg/L) or mild proteinuria (300-600 mg/L), measured by standard methods on one single overnight urine sample (data available in 125 out of 159 patients).
Statistical analysis
The required sample size to have an 80% chance of detecting as significant (at the two sided 5% level), a 10 mm Hg difference in PP between two different subgroups, with an assumed standard deviation of PP of 14 mm Hg, was 16 patients in each subgroup. A difference of 10 mm Hg was chosen as clinically significant because it has been shown to be associated with increased CVD (i.e. R-R of 1.11-95% CI 1.01-1.21-per 10mm Hg increase in PP) [5] and a higher mortality [12] in the large EURODIAB cohort of T1DM patients. Diabetes duration-related (in the diabetic population) and age-related (in the non-diabetic population) changes in parameters were compared between groups with two-way analysis of variance (ANOVA) and, where overall differences existed, post hoc analyses were conducted with the Bonferroni correction for multiple unpaired t tests. Results were expressed as mean ± SD values for continuous variables. Comparisons of prevalence of categorical variables (E/I R-R ratio < 1.10, baroreflex gain < 2.5 and PP> 60 mm Hg) used χ2 tests both for comparing two
corresponding subgroups and for evaluating a significant trend from Gl to G4. A p value of less than 0.05 was considered significant.
Results
BP continuous monitoring during the squatting test
HR was significantly higher in diabetic than in non-diabetic patients (Figure 1, Table 1). This difference tended to be greater from Gl to G4. Especially, the relative bradycardia in the squatting position, observed in all subgroups of non-diabetic subjects, progressively vanished in diabetic patients from Gl to G4 (Figure 1, left panels). Furthermore, the overall reflex tachycardia accompanying the transition from squatting to standing position tended to be progressively dampened from Gl to G4 in the T1DM population.
Almost similar changes in MBP were observed in diabetic and non-diabetic subjects as far as the first three groups G1-G3 were concerned (Figure 1, middle panels). In contrast, G4 including patients with longer T1DM duration was characterized by lower MBP in the initial standing position, a quite similar MBP rise during squatting, a marked and almost comparable early MBP drop during the active transition phase from squatting to standing, but a delayed return to baseline values in theorthostatic position (a marker of the presence of CAN, as previously reported) [27].
PP (Figure 1, right panels) was almost stable during the initial 1 min standing position. Whereas it was similar in diabetic and non-diabetic patients in Gl and G2, it was higher in diabetic than in non-diabetic subjects in G3 and G4. This difference appeared even more marked in the squatting position during which a significant PP increase was observed in all groups but of greater amplitude in patients with diabetes duration more than 20 years (G3 and G4) [23]. After the transition from squatting to standing, the PP return to baseline initial values was quite similar in all groups.
Effects of diabetes duration on arterial stiffness markers
MBP remained almost stable across the four diabetic G1-G4 groups. Indeed, the progressive increase in systolic BP was compensated by a graduate concomitant decrease in diastolic BP (Table 1). This resulted in a
progressive increase in overall PP according to diabetes duration (p < 0.0001; Table 2). There was a marked difference between G1-G2 and G3-G4 in the diabetic population (49 ± 14 vs 59 ± 14 mm Hg; p < 0.00002), but not in the control group matched for age (51 ± 12 vs 50 ± 15 mm Hg; NS). Percentages of subjects with PP > 60 mm Hg steadily increased in the diabetic population (21% vs 24% vs 37% vs 61% from Gl to G4, respectively;
p = 0.046), but not in non-diabetic subjects (p = 0.3191; Figure 2).
The slope of PP as a function of MBP (PP/MBP) progressively increased from Gl to G4 in the diabetic
population (p < 0.0005), whereas it did not change significantly across the four subgroups of control individuals (ρ = 0.3954; Table 2).
Effects of diabetes duration on CAN markers
The E/I R-R ratio progressively decreased with the duration of T1DM (ρ < 0.0001; Table 2). No significant differences were observed neither between Gl and G2 nor between G3 and G4. In contrast, the differences were highly significant between pooled G1-G2 values and pooled G3-G4 values: 1.32 ±0.17 versus 1.19 ±0.13; p < 0.0001. The proportion of diabetic patients with E/I R-R ratio < 1.10 increased gradually from Gl to G4 (p = 0.006), whereas no such increase was observed in non-diabetic individuals (Figure 2).
The baroreflex gain progressively decreased from Gl to G4 in diabetic patients (p = 0.0005), but not in control subjects (p = 0.1747; Table 2). The proportion of subjects with a baroreflex gain < 2.5 increased from Gl to G4 in diabetic patients (p = 0.0149), whereas it did not change significantly across the four subgroups of control subjects (ρ = 0.2933; Figure 2).
Figure 1. Changes in heart rate (HR), mean arterial blood pressure (MBP) and pulse pressure (PP) during the orthostatic test (1-min standing ST - 1-min squatting (SQ) - 1-min ST] in the four groups of diabetic (open circles) versus non-diabetic (full circles) subjects. Results correspond to mean values (18 to 57 subjects in diabetic patients and 28 to 30 subjects in non-diabetic subjects). This figure is available in colour online at www.interscience.wiley.com/journal/dmrr
Finally, the HR-derived indices during squatting and post-squatting standing showed a progressive increase in SqTv from Gl to G4 in patients with T1DM (p = 0.0001), reflecting the dampened bradycardia during squatting (see above; Figure 1), but not in controls (p = 0.1507). In contrast, SqTs did not change significantly across the four subgroups, neither in diabetic (p = 0.1218) nor in non-diabetic (p = 0.4099) subjects (Table 2).
Effects of the presence of microalbuminuria or inhibitors of the renin-angiotensin system
Diabetic patients with microalbuminuria had a longer duration of T1DM and a higher HbA1c level as compared with patients
without microalbuminuria (Table 3). PP was only slightly (NS) higher in T1DM patients with microalbuminuria, whereas PP/MBP was significantly increased (p = 0.05) compared with the corresponding value in patients without microalbuminuria. Patients with microalbuminuria had a significantly lower E/I R-R ratio and a trend to a lower baroreflex gain. SqTv and SqTs were similar in both subgroups. However, the significance of the difference regarding PP/MBP disappeared and that regarding E/I R-R ratio became borderline (p = 0.049) after adjusting for diabetes duration.
Patients receiving an inhibitor of the renin-angiotensin system were significantly older and with a longer duration of T1DM than patients not receiving such therapy (Table 3). Again, PP/MP, but not PP, was significantly increased in patients treated with ACEI/ARB. These patients had also positive indices of CAN, i.e. lower E/I R-R ratio, decreased baroreflex gain and increased SqTv index. However, the statistical significance of between-group differences vanished and was not significant anymore after adjustment for diabetes duration.
Table 2. Markers of arterial stiffness (upper part) and of cardiovascular autonomic neuropathy (CAN, lower part) in the diabetic patients (D) with type 1 diabetes and non-diabetic subjects (ND) used as controls in the four subgroups divided according to diabetes duration and age matching, respectively. Results are expressed as mean ± SD
Group 1 Group 2 Group3 Group 4 ANOVA
(D ≤ 10years) (D 11-20 years) (D 21-30 years) (D ≥ 30years) G1-G4(p value)
D ND D ND D ND D ND D ND n 39 30 45 30 57 30 18 28 Arterial stiffness
PP (mm g)H 48 ±16 49 ±11 52 ±13 53 ±13 59 ± 14*** 49 ±14 62 ±12** 51 ±15 0.0001 0.3783 PP/MBP 0.45 ±0.25 0.42 ±0.28 0.51 ±0.38* 0.35 ±0.24 0.63 ±0.28** 0.42 ± 0.30 0.80 ±0.35** 0.47 ±0.28 0.0005 0.3954 CAN E/l R-R ratio 1.34 ±0. 51 1.39 ±0. 91 1.30± 0.18 1.36 ± 0 5.1 1.19 ± 0.13* 1.42 ±0. 92 1.17 ± 0. 31 1.36 ±0. 92 0.0000 0.6378
Baror flex gaine 4.1 ±2.4 4.3 ±2.9 3.9 ± 3.1 3.9 ±2.4 2.2 ±1.9 5.2 ±4.5 2.5 ±1.6 3.3 ±2.8 0.0005 0.1747
SqTv 0.79 ±0.11 0.80 ±0.10 0.82 ±0.12 0.83 ±0.12 0.88 ±0.10 0.85 ± 0.11 0.80 ±0.08 0.85 ±0.10 0.0001 0.1507
SqTs 1.20 ±0.15 1.28 ±0.18 1.17 ± 0.23 1.24 ± 0.13 1.11 ±0.13*** 1.25 ± 0.17 1.16 ± 0.18 1.21 ±0.14 0.1218 0.4099
PP, pulse pressure; MBP, mean blood pressure; E/l R-R, expiration/inspiration pulse interval ratio; SqTv, squatting test vagal ratio; SqTs, sympathetic index. Unpaired t test D versus ND: *ρ < 0.05; **ρ < 0.01; ***ρ < 0.001.
Discussion
The main findings of the present study are the following: (1) the demonstration of a progressive PP increase in T1DM patients according to disease duration, especially after 20 years of diabetes, in an age range (<50 years) where such a PP rise was not observed in non-diabetic individuals; (2) the validation of the squatting test to dynamically measure PP and assess CAN, particularly by the calculation of a baroreflex gain, which
progressively increased and decreased, respectively, according to diabetes duration; and (3) the more pronounced perturbation of CAN indices of parasympathetic rather than of sympathetic function with T1DM duration. In the cross-sectional case-control FinnDiane study, comparing 2988 consecutively selected T1DM patients and 5486 control subjects, PP was higher in diabetic patients of all age categories, including in patients less than 45 years. Multiple regression analysis indicated that disease duration per se has a considerable impact on PP, independent of age and renal involvement [10]. Other observations from several more limited studies showed no [35] or only marginally increased PP values (<5 mm Hg) in T1DM patients aged around 25-30 years as
compared with corresponding PP values recorded in age-matched non-diabetic individuals [8,36-38]. Similarly, only modest PP increases were observed in the present study in patients with <20 years T1DM duration. In contrast, a marked PP increase (difference of almost 10 mm Hg) was observed in diabetic patients aged >40 years with disease duration more than 20 years compared with age-matched non-diabetic individuals. In the EURODIAB Prospective Complications Study, a 12 mm Hg higher PP was observed in T1DM patients who died as compared with that of those who survived, and PP was significantly associated with all-cause mortality [12]. In our subgroup of patients with long-duration T1DM, almost twofold more subjects had PP >60 mm Hg, a threshold associated with a higher cardiovascular risk in T2DM [6]. In a recent study, the PP difference compared with non-diabetic age-matched controls was more marked in T1DM patients with microvascular complications (+14 mm Hg) than in those without complications (+5 mm Hg), but the former had a 10-year longer diabetes duration than the latter (29 vs 19 years) [38]. In our diabetic population, PP increase occurred
earlier as compared with the non-diabetic control group, in agreement with the FinnDiane study results that showed PP changes shifted to a 15- to 20-year younger age in T1DM subjects [10]. These PP results are in agreement with accelerated vascular aging in the T1DM population [39], confirming previous observations obtained with various other methods [9,35,36,40,41]. The earlier stiffening of arterial wall appeared to be more marked in women with T1DM than in men [10,42,43]. This was confirmed in the present cohort where we previously reported that the amplification of PP increase with squatting according to diabetes duration was more pronounced in women than in men with T1DM [23]. This may be of importance for the increased susceptibility to cardiovascular complications in diabetic women.
Figure 2. Percentages of subjects with pulse pressure (PP) >60 mm Hg, E/I R-Rratio <1.10 and baroreflex gain <2.5 in the four groups of diabetic (black bars) versus non-diabetic (white bars) individuals. Statistical analysis used chi-square tests for trends in each population. This figure is available in colour online at
www.interscience.wiley.com/journal/dmrr
Table 3. Clinical characteristics, markers of arterial stiffness and indices of cardiovascular autonomic neuropathy (CAN) in type 1 diabetic patients (T1DM) without or with microalbuminuria and in T1DM without or with an inhibitor of the renin-angiotensin system. Results are expressed as mean ± SD
Microalbuminuria ACEI/ARB therapy
N Without {η =102) With (n = 23) p Without {η =129) With (n = 30) p
Characteristics
Age (years) 40 ±11 42 ±10 NS 39 ± 11 45 ±9 0.007
Sex ratio 54F/48M 8F/15M NS 59F/70M 9F/14M NS
BMI (kg/m2
) 23.7 ±3.8 23.1 ±2.9 NS 23.6 ±2.9 24.2 ±2.9 NS
T1DM dur tion (years)a 19 ± 10 26 ± 12 0.019 18 ± 10 27 ± 11 <0.001
HbA1c (%) 8.5 ±1.2 9.3 ±1.6 0.037 8.7 ±1.3 8.6 ±1.3 NS MBP<mm Hg) 82 ±11 81 ±11 NS 82 ±11 81 ±12 NS SBP (mm Hg) 120 ± 19 122 ± 21 NS 120 ±20 120 ±20 NS DBP<mm Hg) 66 ±10 64 ±10 NS 66 ±10 63 ±11 NS HR(bpm) 87 ±13 88 ±12 NS 89 ±14 87 ±11 NS Arterial stiffness PP (mm Hg) 54 ±14 58 ±16 NS 54 ±15 56± 14 NS PP/MBP 0.54 ±0.35 0.70 ±0.34 0.050 0.54 ±0.32 0.72 ±0.33 0.008 CAN E/l R-R ratio 1.28 ±0.17 1.16 ± 0.13 0.001 1.27 ± 0.17 1.20 ±0.14 0.017
Baror flex gaine 3.4 ±2.7 2.6 ±2.7 NS 3.4 ±2.71 2.2 ±1.4 0.001
SqTv 0.79 ±0.11 0.80 ±0.10 NS 0.83 ±0.12 0.89 ±0.09 0.002
SqTs 1.20 ± 0.15 1.28 ±0.18 NS 1.16 ± 0.18 1.12 ± 0.11 NS
Note: ACEI, angiotensin converting enzyme inhibitor; ARB, angiotensin AT1 receptor blocker; NS, non-significant; BMI, body mass index; HbAic, glycated haemoglobin; MBP, mean blood pressure; SBP, systolic blood pressure; DBP, diastolic blood pressure; HR, heart rate; PP,
The present study confirms the validity of the use of the index PP/MBP previously proposed as a surrogate marker of arterial stiffness [30]. Indeed, we demonstrated that this index prematurely increased in patients with T1DM according to disease duration, in contrast to what was observed in an age-matched control population. However, the add-on value of this index, as compared with crude PP values, does not appear clearly in our study and further studies would probably be necessary to support the extensive use of this index [30].
All together, our findings and those from the literature are in agreement with earlier increased arterial stiffness in not well-controlled patients with T1DM. In the diabetic population, both in T2DM [5-7] and in T1DM [11,12], higher brachial PP is associated with complications and PP is an independent marker of cardiovascular mortality. However, although some drug therapies may prove useful in the treatment of patients with altered arterial mechanics [29], the therapeutic implications of PP measurement remain poorly documented in diabetes [39]. Nevertheless, a recent study showed that lowering of brachial PP in more than 9000 hypertensive patients with T2DM was associated with a significant reduction of CV events [7].
The present data were obtained in patients with a rather poor glucose control as mean HbA1c value was around
8.5%. We were not able to show differences between patients with HbA1c < or > 8% (data not shown). However,
as in most previous studies, we had only access to the last HbA1c values and not to repeated measurements from
the diagnosis of T1DM, which would provide a much better picture of the overall exposure to hyperglycaemia in diabetic patients. Nevertheless, in a recent study in hypertensive patients with T2DM, multivariate analysis of the determinants of PP reduction with BP-lowering therapy showed a negative association with HbA1c [7]. In
T1DM patients, it has been shown that HbA1c does not correlate with vascular compliance [35,37]. In the
FinnDiane, the ambient level of glycaemic control was not associated with increased PP, but the time of
exposure to hyperglycaemia appeared to play a fundamental role in the process of premature arterial stiffening in T1DM [10]. In the EURODIAB Prospective Complications Study in patients with T1DM, again PP was not associated with HbA1c [41]. However, it was strongly associated with the advanced glycation end products
N*-(carboxymethyl)lysine and N*-(carboxyethyl)lysine [44], suggesting that the formation of advanced glycation
end products is an important pathway in the development of arterial stiffness in young T1DM individuals [9]. CAN incidence increases with diabetes duration, especially in T1DM [31,45]. Classically, parasympathetic dysfunction precedes sympathetic dysfunction [15,31,32].
When evaluating HR variations during the squatting test, and calculating indices reflecting mainly
parasympathetic activity (SqTv) and sympathetic activity separately (SqTs) [24,25], we showed that SqTv index was markedly and significantly affected by diabetes duration, whereas changes in SqTs did not reach the level of statistical significance in our population with T1DM. CAN may be found early in the course of diabetes and might be considered as a prognostic marker of microangiopathic complications [14,15,45,46]. Increased systolic BP (but not diastolic BP, thus presumably higher PP, but not mentioned in the article) was identified as a factor associated with an increased risk of developing CAN in a multivariate regression model applied to the cohort of T1DM patients of the EURODIAB Prospective Complications Study [47]. In normoalbuminuric patients with T1DM, deterioration of autonomic nervous function (E/I R-R ratio and lying-to-standing test) was associated with an increase in arterial stiffness, assessed by aortic pulse wave velocity, which, in turn, was associated with, and may cause, increased SBP and PP [48]. In patients with T1DM, there was a correlation between increased aortic stiffness and parasympathetic dysfunction, and this relationship persisted when taking into account for diabetes duration. However, this was observed only in women and not in men, a finding that might be of importance for the increased susceptibility to cardiovascular complications in diabetic women [43]. In the present study, the differences in PP/MBP (increased level, marker of arterial stiffness), E/I R-R ratio (decreased level, marker of CAN) and baroreflex gain (trend to lower value) in patients with microalbuminuria were mostly explained by the greater duration of diabetes as compared with T1DM patients without
microalbuminuria. In the FinnDiane study [10], T1DM patients with macro albuminuria had the highest PP. Higher PP values were also observed in microalbuminuric than in normoalbuminuric T1DM patients, but only in limited age categories. In contrast, control subjects had significantly lower PP than normoalbuminuric diabetic subjects in all age categories. The authors concluded that even if the premature rise in PP is strongly related to the development of diabetic kidney disease, it also characterizes T1DM patients with a persistently normal urinary albumin excretion rate. In another study, baroreflex sensitivity (defined as the mean gain between BP variability and HR variability) was shown to be depressed in microalbuminuric T1DM patients (but without CAN) at rest and during sympathetic manoeuvres [49].
There are some limitations in our study. First, the cross-sectional design did not allow following patients prospectively. However, it is almost impossible to perform such a longitudinal study that should last several
decades to detect the trend observed here as most important changes in PP occurred after more than 20 years of diabetes duration. Second, glucose control of T1DM patients evaluated in the present study was not optimal, despite intensified insulin therapy, so that results could not be necessarily extrapolated to patients with near normoglycaemia for many years. In addition, the quality of previous glucose control should be better assessed than by using only concomitant HbAic levels as already mentioned. Third, finger is an unusual site to measure
PP, and different from the brachial site used in the FinnDiane study [9], for instance. Several studies have demonstrated that absolute brachial and finger PP measurements are not identical with larger differences in systolic BP. However, the differences were generally small as compared with the magnitude of the responses during dynamic tests and therefore not considered of clinical relevance [50]. Most importantly, in a study comparing PP in radial artery and finger, changes in PP were almost similar during a head-up tilt in young healthy volunteers [51]. Finally, it is not clear whether PP should be seen as an independent risk factor requiring correction or simply as a marker to be taken into account when evaluating overall vascular risk [39]. Direct measures of arterial stiffness are likely to be better candidates than indirect ones for refining interventions to improve outcomes in diabetes [52].
In conclusion, the original squatting test with continuous monitoring of BP and HR allows simultaneous evaluation of PP, an indirect measure of arterial stiffness, and baroreflex gain, a marker of CAN. T1DM was associated with a progressive increase in PP according to the duration of the disease, in an age range where no significant influence of age was observed in a non-diabetic population. This is suggestive of accelerated arterial stiffening. Markers of CAN, especially those of parasympathetic dysfunction, also steadily progressed according to the duration of T1DM. The combination of both haemodynamic (increased PP) and autonomic disturbances may explain the higher cardiovascular risk and the increased total mortality of patients with T1DM of long duration, as recently shown in the EURODIAB Prospective Complications Study [12].
Conflict of interest
None declared.
References
1. de Simone G, Roman MJ, Alderman M H, Galderisi M, de Divitiis O, Devereux RB. Is high pulse pressure a marker of preclinical cardiovascular disease? Hypertension 2005; 45: 575-579.
2. Franklin SS, Khan SA, Wong ND, Larson MG, Levy D. Is pulse pressure useful in predicting risk for coronary heart disease? The Framingham Heart Study. Circulation 1999; 100: 354-360.
3. Assmann G, Cullen P, Evers T, Petzinna D, Schulte H. Importance of arterial pulse pressure as a predictor of coronary heart disease risk in PROCAM. Eur Heart J 2005; 26: 2120-2126.
4. Benetos A, Rudnichi A, Safar M, Guize L. Pulse pressure and cardiovascular mortality in normotensive and hypertensive subjects. Hypertension 1998; 32: 560-564.
5. Schram MT, Kostense PJ, Van Dijk RA, etal. Diabetes, pulse pressure and cardiovascular mortality: the Hoorn Study.
J Hypertens 2002; 20: 1743-1751.
6. Cockcroft JR, Wilkinson IB, Evans M, et al. Pulse pressure predicts cardiovascular risk in patients with type 2 diabetes mellitus. Am J Hypertens 2005; 18: 1463-1467; Discussion 1468-1469.
7. Tropeano AI, Katsahian S, Molle D, Grimaldi A, Laurent S. Lowering of brachial pulse pressure in 9379 hypertensives with type 2 diabetes and reduction of cardiovascular events. Blood Press 2008; 17: 26-33.
8. Retnakaran R, Zinman B. Type 1 diabetes, hyperglycaemia, and the heart. Lancet 2008; 371: 1790-1799. 9. Benetos A. Pulse pressure and arterial stiffness in type 1 diabetic patients. J Hypertens 2003; 21: 2005-2007.
10. Ronnback M, Fagerudd J, Forsblom C, Pettersson-Fernholm K, Reunanen A, Groop PH, Finnish Diabetic Nephropathy (FinnDiane) Study Group. Altered age-related blood pressure pattern in type 1 diabetes. Circulation 2004; 110: 1076-1082. 11. Schram MT, Chaturvedi N, Fuller JH, Stehouwer CD, EURODIAB Prospective Complications Study Group. Pulse pressure is associated with age and cardiovascular disease in type 1 diabetes: the Eurodiab Prospective Complications Study.
J Hypertens 2003; 21: 2035-2044.
12. Soedamah-Muthu SS, Chaturvedi N, Witte DR, Stevens LK, Porta M, Fuller JH, EURODIAB Prospective Complications Study Group. Relationship between risk factors and mortality in type 1 diabetic patients in Europe. The EURODIAB Prospective Complications Study (PCS). Diabetes Care 2008; 31: 1360-1366.
13. Geronooz I, Philips JC, Marchand M, Scheen AJ. Cardiovascular autonomic neuropathy: An underestimated
complication. In Clinical Implications of Belgian Diabetologkal Research, De Leeuw I, Lefèbvre P. Belgian Diabetes Study Group: 2004; 69-81.
14. Maser RE, Lenhard MJ. Review: Cardiovascular autonomic neuropathy due to diabetes mellitus: clinical manifestations, consequences and treatment. J Clin Endocrinol Metab 2005; 90: 5896-5903.
15. Vinik AI, Ziegler D. Diabetic cardiovascular autonomic neuropathy. Circulation 2007; 115: 387-397.
16. Maser RE, Mitchell BD, Vinik AI, Freeman R. The association between cardiovascular autonomic neuropathy and mortality in individuals with diabetes: a meta-analysis. Diabetes Care 2003; 26: 1895-1901.
17. Kempler P, Tesfaye S, Chaturvedi N, etal. EURODIAB IDDM Complications Study Group. Autonomic neuropathy is associated with increased cardiovascular risk factors: the EURODIAB IDDM Complications Study. Diabet Med 2002; 19: 900-909.
18. McEniery CM, Yasmin , Hall IR, Qasem A, Wilkinson IB, Cockcroft JR, ACCT Investigators. Normal vascular aging: differential effects on wave reflection and aortic pulse wave velocity: the Anglo-Cardiff Collaborative Trial (ACCT).
J Am Coll Cardiol 2005; 46: 1753-1760.
19. Mallareddy M, Parikh CR, Peixoto AJ. Effect of angiotensin-converting enzyme inhibitors on arterial stiffness in hypertension: systematic review and meta-analysis. J Clin Hypertens 2006; 8: 398-403.
20. O'Donnell TV, Mcllroy MB. The circulatory effects of squatting. Am Heart J 1962; 64: 347-356.
21. Rossberg F, Penaz J. Initial cardiovascular response on change of posture from squatting to standing. Eur J Appl Physiol 1988; 57: 93-97.
22. Hanson P, Slane PR, Tueckert PA, Clark SV. Squatting revisited: Comparison of haemodynamic responses in normal individuals and heart transplantation recipients. Br Heart J 1995; 74: 154-158.
23. Philips JC, Marchand M, Scheen AJ. Squatting amplifies pulse pressure increase according to duration of type 1 diabetes. Diabetes Care 2008; 31: 322-324.
24. Marfella R, Giugliano D, Di Maro G, Acampora R, Giunta R, D'Onofrio F. The squatting test: A useful tool to assess both parasympathetic and sympathetic involvement of the cardiovascular autonomic neuropathy in diabetes. Diabetes 1994; 43: 607-612.
25. Marfella R, Salvatore T, Giugliano D, etal. Detection of early sympathetic cardiovascular neuropathy by squatting test in NIDDM. Diabetes Care 1994; 17: 149-151.
26. Netten PM, Boots JM, Bredie SJ, et al. An automated computerized method using Finapres for measuring cardiovascular reflexes. Clin Sci 1992; 83: 157-163.
27. Scheen AJ, Juchmes J, Pochet Th. Non invasive, beat-to-beat, investigation of the effects of posture on arterial blood pressure in diabetic neuropathy. Diab Metab 1990; 16: 382-384.
28. Rickards CA, Newman DG. A comparative assessment of two techniques for investigating initial cardiovascular reflexes under acute orthostatic stress. Eur J Appl Physiol 2003; 90: 449-457.
29. Hamilton PK, Lockhart CJ, Quinn CE, McVeigh GE. Arterial stiffness: clinical relevance, measurement and treatment.
Clin Sci (Lond) 2007; 113: 157-170.
30. Gosse Ph, Papaioanou G, Coulon P, Reuter S, Lemetayer Ph, Safar M. Can ambulatory blood-pressure monitoring provide reliable indices of arterial stiffness? Am J Hypertens 2007; 20: 831-838.
31. Ewing DJ, Martin CN, Young RJ, Clarke BF. The value of cardiovascular autonomic function tests: 10 years experience in diabetes. Diabetes Care 1985; 8: 491-498.
32. Vinik AI, Maser RE, Mitchell BD, Freeman R. Diabetic autonomic neuropathy. Diabetes Care 2003; 26: 1553-1579. 33. Parati G, Di Rienzo M, Mancia G. How to measure baroreflex sensitivity: from the cardiovascular laboratory to daily life. J Hypertens 2000; 18: 7-19.
34. Di Maro G, Juchmes J, Fossion A, Scheen AJ, Lefèbvre PJ. Study of the baroreflex by beat-to-beat changes in finger arterial pressure during squatting in diabetic patients (Abstract). Diabetologia 1991; 34(Suppl. 2): A158.
35. Kool M J, Lambert J, Stehouwer CD, Hoeks AP, Struijker Boudier HA, Van Bortel LM. Vessel wall properties of large arteries in uncomplicated IDDM. Diabetes Care 1995; 18: 618-624.
36. Wilkinson IB, MacCallum H, Rooijmans DF, et al. Increased augmentation index and systolic stress in type 1 diabetes mellitus. Q J Med 2000; 93: 441-448.
37. Berry KL, Skyrme-Jones RA, Cameron JD, O'Brien RC, Meredith IT. Systemic arterial compliance is reduced in young patients with IDDM. Am J Physiol 1999; 276: 1839-1845.
38. Jenkins AJ, Zhang SX, Rowley KG, et al. Increased serum pigment epithelium-derived factor is associated with microvascular complications, vascular stiffness and inflammation in Type 1 diabetes. Diabetic Med 2007; 24: 1345-1351. 39. Bouhanick B, Chamontin B. Should pulse pressure and day/night variations in blood pressure be seen as independent risk factors requiring correction or simply as markers to be taken into account when evaluating overall vascular risk?
40. Brooks B, Molyneaux L, Yue DK. Augmentation of central arterial pressure in type 1 diabetes. Diabetes Care 1999; 22: 1722-1727.
41. Sommerfield AJ, Wilkinson I, Webb D, Frier B. Vessel wall stiffness in type 1 diabetes, and the central hemodynamic effects of acute hypoglycaemia. Am J Physiol Endocrinol Metab 2007; 293: E1274-E1279.
42. Scurrah KJ, Byrnes GB, Hopper JL, Harrap SB. Sex differences in genetic and environmental determinants of pulse pressure. Genet Epidemiol 2006; 30: 397-408.
43. Ahlgren AR, Sundkvist G, Wollmer P, Sonesson B, Länne T. Increased aortic stiffness in women with type 1 diabetes mellitus is associated with diabetes duration and autonomic nerve function. Diabet Med 1999; 16: 291-297.
44. Schram MT, Schalkwijk CG, Bootsma AH, Fuller JH, Chaturvedi N, Stehouwer CD, EURODIAB Prospective Complications Study Group. Advanced glycation end products are associated with pulse pressure in type 1 diabetes: the EURODIAB Prospective Complications Study. Hypertension 2005; 46: 232-237.
45. Valensi P, Pariès J, Attali JR. Cardiac autonomic neuropathy in diabetic patients: Influence of diabetes duration, obesity, and microangiopathic complications - The French Multicenter Study. Metabolism 2003; 52: 815-820.
46. Valensi P, Huard J-P, Giroux C, Attali J-R. Factors involved in cardiac autonomic neuropathy in diabetic patients. J
Diabetes Complic 1997; 11: 180-187.
47. Witte DR, Tesfaye S, Chaturvedi N, Eaton SE, Kempler P, Fuller JH, EURODIAB Prospective Complications Study Group. Risk factors for cardiac autonomic neuropathy in type 1 diabetes mellitus. Diabetologia 2005; 48: 164-171. 48. van Ittersum FJ, Schram MT, van der Heijden-Spek JJ, et al. Autonomic nervous function, arterial stiffness and blood pressure in patients with type I diabetes mellitus and normal urinary albumin excretion. J Hum Hypertens 2004; 18: 761-768. 49. Lefrandt JD, Hoogenberg K, van Roon AM, Dullaart RP, Gans RO, Smit AJ. Baroreflex sensitivity is depressed in microalbuminuric type 1 diabetic patients at rest and during sympathetic manoeuvres. Diabetologia 1999; 42: 1345-1349. 50. Imholz BP, Wieling W, van Montfrans GA, Wesseling KH. Fifteen years experience with finger arterial pressure monitoring: assessment of the technology. Cardiovasc Res 1998; 38: 605-616.
51. Steinback CD, O'Leary DD, Wang SS, Shoemaker JK. Peripheral pulse pressure responses to postural stress do not reflect those at the carotid artery. Clin Physiol Funct Imaging 2004; 24: 40-45.
52. Cameron JD, Cruickshank JK. Glucose, insulin, diabetes and mechanisms of arterial dysfunction. Clin Exp Pharmacol
![Figure 1. Changes in heart rate (HR), mean arterial blood pressure (MBP) and pulse pressure (PP) during the orthostatic test (1-min standing ST - 1-min squatting (SQ) - 1-min ST] in the four groups of diabetic (open circles) versus non-diabetic (full cir](https://thumb-eu.123doks.com/thumbv2/123doknet/6628871.180694/5.892.108.481.547.1036/changes-arterial-pressure-pressure-orthostatic-standing-squatting-diabetic.webp)


![[PDF] Support de Cours Ajax gratuit | Cours informatique](data:image/gif;base64,R0lGODlhAQABAIAAAP///wAAACH5BAEAAAAALAAAAAABAAEAAAICRAEAOw==)