Decoding entangled transitions: Polyamorphism and stressed rigidity
Can Yildirim, Jean-Yves Raty, and Matthieu Micoulaut
Citation: The Journal of Chemical Physics 148, 244505 (2018); doi: 10.1063/1.5034500 View online: https://doi.org/10.1063/1.5034500
View Table of Contents: http://aip.scitation.org/toc/jcp/148/24 Published by the American Institute of Physics
Decoding entangled transitions: Polyamorphism and stressed rigidity
Can Yildirim,1,2,3Jean-Yves Raty,2and Matthieu Micoulaut1,a)
1Laboratoire de Physique Th´eorique de la Mati`ere Condens´ee, Sorbonne Universit´e, 4 Place Jussieu, 75252 Paris Cedex 05, France
2Physique de la Mati`ere Condens´ee, B5, Universit´e de Li`ege, B4000 Sart-Tilman, Belgium
3European Synchrotron Radiation Facility, 71, Avenue des Martyrs, CS 40220, 38043 Grenoble Cedex 9, France
(Received 12 April 2018; accepted 5 June 2018; published online 26 June 2018)
There is much to learn from simulation studies of polyamorphism achieved for systems with different bonding environments. Chalcogenide glasses such as Ge–Se glasses undergo an elastic phase tran-sition involving important changes in network connectivity. Stimulated by recent developments of topological constraint theory, we show that the concept of rigidity can be extended to a broader range of thermodynamic conditions including densified glasses. After having validated our structural first principles molecular dynamics models with experimental data over a broad pressure range for GeSe4, we show that the onset of polyamorphism is strongly related to the constraint density measuring the degree of rigidity of the network backbone, while voids and cavities in the structure collapse at very small pressures. This leads to the identification that the progressive onset of higher coordinated species typical of high pressure phases is responsible for the onset of stressed rigidity, although the constraint analysis also indicates progressive stiffening of bonding angles. Results are compared to stoichiomet-ric and stressed rigid GeSe2and to isostatic As2Se3and then generalized to other compositions in the Ge–Se binary under pressure. Published by AIP Publishing.https://doi.org/10.1063/1.5034500
I. INTRODUCTION
Although they differ from crystals due to a lack of trans-lational periodicity and long-range order at the atomic scale, amorphous materials bear with crystals the ability to exist in different forms, a feature known as polyamorphism.1 It is now widely recognized that the manifestation of such basic phenomena, driven by applied pressure, results from different atomic coordinations and structures that can lead to amorphous phases of the same chemical composition but with differ-ent physical properties. The question whether polyamorphism involves a phase transition between two distinct metastable amorphous states remains an actively debated topic,2and it is still not clear if the observed low temperature polyamorphic transition is an extension of the reported liquid-liquid transition between two stable liquid states.
Besides the archetypal example of amorphous ice3which can be found in at least two amorphous phases, low den-sity (LDA) and high denden-sity (HDA), a certain number of other materials have been found to display such transfor-mations including carbon, silicon, germanium,4 or yttria-alumina alloys.2 Oxide glasses such as silica5 or germania6 have been also investigated in this context, and both simu-lation and diffraction results have shown that the application of pressure transforms the basic tetrahedral structure into a network of predominantly octahedral nature, typical of high pressure crystalline polymorphs, as, e.g., stishovite. To our knowledge, the same aspects in corresponding chalcogenides
a)Author to whom correspondence should be addressed: mmi@lptmc.
jussieu.fr
have received much less attention,7 although very recent studies have emphasized that these tetrahedral to octahedral conversions occur as well.8–10 However, the transformations appear to be more complicated due to the covalent nature of the bonding and to a more complex network connectiv-ity made of both corner-sharing (CS) and edge-sharing (ES) tetrahedra.11
Here we decode the intrinsic connection between polyamorphism and molecular rigidity, the latter capturing the aspects of topology which contribute to the stiffening of an atomic network, identified as a mechanical truss and character-ized by a constraint density (nc) due to molecular interactions. This approach shows that an elastic rigidity transition can be achieved between a flexible phase with low connectivity (nc< 3) and a stressed rigid phase which is overconstrained11 (nc> 3).
Using First Principles Molecular Dynamics (FPMD) sim-ulations and topological constraint algorithms,12 we show, indeed, that as pressure is applied to GeSe4, a clear thresh-old at '10 GPa separating LDA and HDA phases is obtained in agreement with reported experiments8but within a pressure range (0–50 GPa) that now permits a full characterization of the HDA phase and a neat detection of the pressure range at which the network structure evolves markedly between LDA and HDA. The reasons for choosing GeSe4are motivated by (i) an abundant experimental database allowing for multiple val-idations of the pressurized structural models and (ii) the fact that the glass is isostatic and fulfills exactly nc= 3. The detailed atomic scale and the topological constraint analyses then show that a substantial increase of the constraint density ncoccurs in the vicinity of the LDA-HDA transformation, the increase of topological constraints being identified with the onset of
244505-2 Yildirim, Raty, and Micoulaut J. Chem. Phys. 148, 244505 (2018)
stressed rigidity, once a dramatic reduction of voids and cavi-ties at small pressures has been achieved. A comparison with other simulated systems permits us to consider the effect of pressure on a stressed rigid glass (GeSe2) and another isostatic one (As2Se3). A general increase of topological constraints is acknowledged for all the considered systems, the effect of pres-sure on stressed rigid networks leading to exceptionally large rigidity levels at moderate pressures (20 GPa). The transforma-tion is also characterized by a rapid evolutransforma-tion of the Se–Se and Ge–Se bond statistics with pressure. While previous connec-tions have been made between rigidity and pressure induced transformations in oxides,13here it is the first time that such transformations, polyamorphic or stiffness, are investigated simultaneously, fully characterized, and contrasted. While the LDA-HDA transformation is obviously correlated with a coor-dination number increase r(P) as previously reported,5,8 the present results provide a more complex picture in which a pres-sure induced stiffening of angular motion is also evidenced. Having such detailed information in hand, we finally gener-alize the findings and provide a link between the LDA-HDA transformation pressures and network connectivity in densified Ge–Se glasses and in other glass-forming systems.
II. NUMERICAL METHODS
We used ab initio molecular dynamics (AIMD) to model the structural modifications in GeSe4for various pressures. As embedded in the Car-Parrinello molecular dynamics (CPMD) code, we have utilized a density functional theory (DFT) scheme to describe the electronic structure that evolves self-consistently with time. For exchange correlation energies, the Becke, Lee, Yang, and Parr approach11in conjunction with a generalized gradient approximation was used. The Troullier-Martins type pseudopotential approximation was adopted. Our simulations were carried out in an NVT ensemble, i.e., the number of atoms, volume, and temperature of the sys-tem were kept constant with a total of 250 atoms. The cell dimensions were determined according to the experimental densities available in the literature14 or to their extrapola-tions.15 The initial positions of the atoms were taken from the GeSe crystal, and Ge atoms are replaced with Se atoms to reach the target composition. The wavefunctions have been expanded at the Γ point of the supercell on a plane-wave basis set having a cut-off energy of 20 Ry. A time step of ∆t = 0.1 fs was used to the integrate equations of motion using the Verlet algorithm. The fictitious electron mass was selected as 200 a.u. The initial zero pressure GeSe4was heated to 2000 K and kept there for 22 ps to lose the memory of initial positions. Subsequently, a number of different temper-atures were visited before thermalizing the glassy structure at 300 K.11Three independent quenches with 1050 K being the starting temperature were performed in order to have a statis-tical average of the 300 K trajectories. The most energestatis-tically stable structures among the individual quenches were used to apply compression.
In order to apply pressure to the GeSe4structural model, the cell sizes were decreased under NVT conditions and the cell pressures were calculated from the average of the stress tensors over the useful parts of the trajectories (i.e., first 4 ps
of 300 K trajectories were removed). We adopted a cold compression approach which signifies that the reduction of the cell volumes was performed at 300 K and pressure was successively increased using the last configurations of the subsequent trajectory.
We have simulated a certain number of thermodynamic data points (11) of amorphous GeSe4. The former system is known to be isostatic (nc= 3)11and located at the mean-field flexible/stressed rigid phase transition which is fulfilled when nc= 2 + 5x = 3 or, alternatively, when the network mean coordi-nation number ¯r = 2 + 2x reaches the value of ¯r = 2.4. GeSe211 is the stressed rigid (nc= 3.67). The calculated residual pres-sure after melt quench is rather small (e.g., 0.35 GPa at 300 K for GeSe4). A reduction (cold compression) of the cell size was then applied to increase the pressure up to 49.4 GPa (19.9 GPa for GeSe2). The general methodology is the same as the one used for the recent investigations of a low pressurized GeSe4 glass, and results are found to be comparable, while also agree-ing with (i) thermal measurements and the equation of state8,16 (see below) and (ii) the pair correlation g(r) and the struc-ture factor S(k) obtained from neutron diffraction (ND) at low pressure (LP) (P < 14.4 GPa,16) and X-ray at higher pressures (HP),8as discussed in the following.
III. VALIDATION OF THE STRUCTURAL MODELS
Prior to the analysis of the effect of pressure on the rigidity of GeSe4glasses, we have indeed validated the reliability of our structural models of GeSe4by comparing our results with the available experimental data. A detailed comparison of our simulations to the experimentally measured quantities by neu-tron diffraction (ND) and x-ray diffraction (XRD) showed a good level of reproduction.
A. Reciprocal space properties
Figure1shows the AIMD calculated total structure factors for GeSe4 during compression compared to neutron (SN(k)) (Bouzid et al.16) and X-ray (SX(k)) (Kalkan et al.8) diffrac-tion experiments. The calculated structure factors show good agreement with experimental findings over the entire pressure range. One notices that the amorphous nature of the system is preserved until 49.2 GPa from the simulation results, in agree-ment with the experiagree-mental results shown for Ge18Se82in our recent study,17indicating no crystallization up to 42 GPa. The typical ambient pressure features of the reciprocal space [the first sharp diffraction peak (FSDP) at k ∼ 1.15 Å−1, the prin-cipal peak (PP) at k ∼ 2.05 Å−1, and the secondary principal peak (PP2) at ∼3.62 Å−1] are well reproduced along with the oscillation in higher k vectors (8–12 Å−1) when compared to neutron diffraction results. The FSDP broadens and loses intensity as the pressure is increased and completely vanishes at around 7 GPa, as reported earlier for other chalcogenide systems under pressure.16Meanwhile the PP shifts to higher k values and a peak sharpening is observed which is cou-pled with an intensity increase. Similar observations can be made for the PP2. It is worth noting that the X-ray results show a more pronounced sharpening effect upon compres-sion which was argued to be related to the higher resolution function used as compared to the neutron diffraction results
FIG. 1. Pressure dependence of the total structure factor S(k) for GeSe4. AIMD computed results (black curves) are compared to neutron diffraction (red curves)16and X-ray8diffraction (blue diamonds, digitized) results. Here, the first pressure value indicated corresponds to the simulations, while the second is for the experimental pressure points.
(Ref.16and the references therein). At higher pressures start-ing from 20 GPa, a peak located around k ∼ 5 Å−1builds up and becomes more pronounced as the pressure is increased. At pressures above 32 GPa, this peak is well separated from the PP2. The main contribution to the appearance of this peak is provided by the Se–Se partial structure factors, and also its feature is enhanced by the drop in the intensity of the Ge–Se partial structure factor around k ∼ 4.6 Å−1which are not shown here.
B. Real space properties
Turning to the real space properties, Fig.2shows the evo-lution of the computed total pair distribution function (PDF) g(r) under pressure for GeSe4 compared to ND results.16 It appears that there is very good agreement between our sim-ulations and the ND measurements at ambient pressure, as already acknowledged elsewhere.16The first peak located at ∼2.36 Å and the second peak at ∼3.85 Å are well reproduced. It should be noted that the intensity of the first peak at ambi-ent pressure is slightly overestimated in simulations compared to the experiment. An overall agreement between ND and AIMD results can be observed for the pressure behavior of the PDF. Upon compression, the first peak loses intensity and shows a peak broadening. The position of this peak follows a similar trend with what is observed in Ge–Se bond length under pressure, as also shown experimentally.17The changes in this peak are directly reflected on the total coordination num-bers (Fig.3). The second peak continuously shifts to lower r values while losing its intensity along with a similar peak broadening.
Figure 4 shows the evolution of the partial PDF under pressure calculated with AIMD simulations. At ambient pres-sure, one notices absence of Ge–Ge homopolar bonds. This agrees with calculated coordination numbers (Fig.3) where
FIG. 2. Pressure dependence of computed (black curves) total pair distribu-tion funcdistribu-tion for GeSe4is compared to neutron diffraction experiments16(red curves).
¯n= 2.4 at ambient pressure with ¯nGe= 4 and ¯nSe= 2, indicating predominant Ge(Se1/2)4units in the structure. The homopolar Ge–Ge bonds appear with increasing pressure, and the corre-sponding peak reaches a maximum intensity at around 15 GPa. Above this value, a decrease in the intensity is observed which is reflected to the Ge–Ge homopolar fraction. It can be seen that the peak corresponding to the Ge–Ge inter-atomic dis-tance forming the edge-sharing (ES) tetrahedral connection (at around 3 Å) loses intensity and completely vanishes at
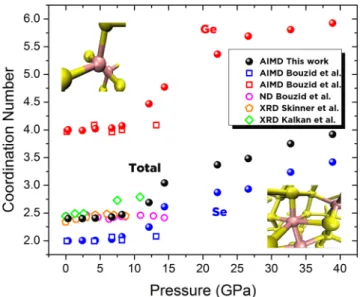
FIG. 3. Computed pressure dependence of computed coordination number ¯n (black), ¯nGe(red), and ¯nSe(blue) for GeSe4(filled spheres) is compared to the AIMD and ND work of Bouzid et al.16(open squares and magenta
open circles, respectively), the XRD work of Skinner et al.18(orange open
pentagons), and the XRD work of Kalkan et al.8(green open diamonds). On the
top left and bottom right, snapshots of typical structural units are represented for LDA and HDA phases.
244505-4 Yildirim, Raty, and Micoulaut J. Chem. Phys. 148, 244505 (2018)
FIG. 4. The calculated pressure dependence of partial pair distribution functions for GeSe4[from upper panel to lower: gGeGe(r), gGeSe(r), and
gSeSe(r)].
12.1 GPa while the peak corresponding to corner-sharing (CS) tetrahedra broadens as the pressure is increased. Turning to gGeSe(r), one can notice that the position of the first peak located at ∼2.35 Å behaves similar to what is observed for Ge18Se82under pressure.17The second peak located at around ∼3.66 Å at ambient pressure agrees well with the previous AIMD results,11which can be attributed to the distances of a cross-linking Ge atom with a Se chain. The intensity of this peak was reported to increase with increasing Ge content,11 an indication that the increasing network connectivity yields
an increase in the intensity of the secondary peak in gGeSe(r). Our simulations agree with a previous study16 in the sense that for P > 7 GPa, the secondary peak gains intensity which is in line with the increased network rigidity. Finally, exam-ining gSeSe(r) shows that the first peak associated with the homopolar Se–Se bonds is located at 2.36 Å, consistent with previous simulation7,16and diffraction work.16With increas-ing pressure, this peak loses intensity and broadens. The sec-ondary peak that is located at 3.85 Å again shifts to smaller r values as the pressure is increased, eventually merging with the Se–Se homopolar peak at high pressure. This indicates that at high pressures, there is a high structural variety for the Se–Se type of bonding including motifs such as edge correla-tions of octahedral units, homopolar bonds, and conneccorrela-tions with the next nearest neighbor as the fifth and sixth neighbors approaching the first shell.
Figure3shows the coordination numbers as a function of pressure for GeSe4. Our AIMD results are compared to exper-imental and simulation studies available in the literature for this particular composition. The ambient pressure values for ¯n, ¯nGe, and ¯nSeare in line with the mean field calculations (i.e., ¯n= 2 + 2x, where x is the Ge mole fraction) and also consis-tent with previous contributions.8,11,16The rate of increase in coordination numbers is smaller at P > 22 GPa in such a way that ¯nGeand ¯nSealmost linearly approach 6 and 4 at elevated pressures, respectively.
The slight discrepancies between the AIMD results in the work by Bouzid et al.16 that an identical DFT scheme may be due to the different glass production prior to the cold com-pression in the simulations. Furthermore, there are differences in the total average coordination number ¯n between XRD and ND measurements. The XRD work by Kalkan et al.8 shows an increase in ¯n at around ∼P = 7.5 GPa, reaching a simi-lar value with our simulations at around 12 GPa while the coordination numbers found by ND measurements are almost constant up to ∼P = 15 GPa. It should be also noted that our simulation results shown in Fig. 3 are consistent with the work of Skinner et al.18 indicating that there is no sig-nificant change in the coordination number at pressures up to 8.6 GPa.
C. Void structures
We extracted the total void volumes in GeSe4under pres-sure by calculating Voronoi volumes of each atom in our trajectories, similar to cavity characterizations.19The cut-off distances used as Voronoi parameters were taken from the minima of the first peak of the partial pair distribution func-tion of the corresponding structure [e.g., at 4.2 GPa gGeGe(r) 2.69 Å, gGeSe(r) 2.73 Å, and gSeSe(r) 2.70 Å]. These anal-yses were carried out for the second half of the trajectories so that the void structures can become more stabilized after the dramatic squeezing effect of the exerted pressure at early times.
Figure 5 represents typical snapshots of GeSe4 at dif-ferent pressures with the void structure being represented in blue. Results indicate a rapid collapse of such voids given that for P = 2.3 GPa, the structure has densified to leave only minimal void fragments left. Such a void collapse manifests in GeSe2 by the rapid conversion in the pressure
FIG. 5. Snapshots representing the change of the void structure (blue) at different pressures in GeSe4. Note that voids completely disappear at 8.3 GPa.
range 0 ≤ P ≤ 3 GPa of edge-sharing structures into corner-sharing tetrahedral connections,20 an evolution that is com-patible with the reduction of the amplitude of the ES peak in the present Ge–Ge pair correlation function (Fig.4). Our corresponding void evolution can be tracked with pressure, as discussed below.
IV. EVIDENCE OF A LDA-HDA THRESHOLD
A certain number of calculated quantities exhibit a clear threshold located around Pc= 10 GPa, and this has been identified in the literature as the LDA-HDA transformation,8 as also observed for other compositions (e.g., Ge17Se83, Pc'15 GPa17). The evolution of the calculated PP position of the total structure factor S(k) of GeSe4 (Fig.1) is seen to be sensitive to the applied pressure [Fig.6(a)] and reproduces the experimental trend measured at low P. The position of the PP increases, indeed, with pressure but clearly two differ-ent trends can be acknowledged, which indicate a rather fast increase of the PP position at low pressure (LP), i.e., a slope of 0.0267 Å−1Pa−1followed by a somewhat more reduced evo-lution at higher pressure (HP), i.e., '0.0098 Å−1 Pa−1 after 10 GPa. This change in slope, obviously, must indicate the exis-tence of a pressure induced transformation for structural cor-relations in reciprocal space, whose location can be estimated at Pc= 10.1 GPa, i.e., quite close to the experimental estimate8 (9.6 GPa). Following the work of Jeanloz,21the equation of state [the inset of Fig.6(a)] can be linearized to yield a nor-malized stress G = P/(3(1 + 2g)3/2) and an effective strain g = 12[(V0/V)2/3−1] that are expressed as a function of the calculated pressure P and the volumes V = V (P) and V0= V (0). The corresponding behavior is shown in a G(g) plot [Fig.6(b)] that also indicates a transition point at '10 GPa which is found from the crossover between the high- and low-pressure behavior.
The advantage of such G(g) plots is that a certain num-ber of features of the transformation and the HDA phase
FIG. 6. (a) Principal peak (PP) position (filled circles) of the total structure factor S(k) of GeSe4as a function of applied pressure P, compared to the results of Kalkan et al.8for compression (open red diamonds) and decompression (filled red diamonds). The inset shows the calculated equation of state ∆V /V0 of GeSe4that is compared to experimental measurements from Skinner et al.18 and Kalkan et al.8(b) Calculated normalized stress G as a function of strain g
(black filled circles), compared to experimental values (red open diamonds,8 green circles18). The indicated pressures Pccorrespond to the experimental (red) and theoretical (black) polyamorphic threshold pressures. Solid lines are linear fits to the results in the LDA and HDA phases.
can be characterized, the present MD simulations allow-ing also to go to much higher pressures (49.4 GPa) than the experimental ones (32 GPa8). First, the slope difference between the LP and HP behavior implies a discontinuity of the compressibility κT given that dG/dg ∝ (κT + P) with corre-sponding compressibilities equal to 0.10(4) × 10−9 Pa and 0.005 × 10⁻⁹ Pa for the LDA and HDA phases, respectively. These values are rather consistent with those obtained experi-mentally; i.e., κTof the LDA phase has been found in the range 0.05–0.10 × 10⁻⁹Pa−1,4,8,22whereas the HDA compressibility has been determined to be of about 2 times smaller.8 Sec-ond, the extrapolation of the HP behavior permits one to have a measure of the zero pressure volume of the HDA phase. By extrapolating the linear fits of the HP behavior to G = 0, we find a molar volume of V /V0= 0.79(8) which is substan-tially smaller than the initial one characteristic of the LDA phase.
V. DISCUSSION
Our key result is that the observed transformation between a LDA and a HDA phase is linked with the features of rigid-ity, rigidity transitions, and topological constraints. This leads
244505-6 Yildirim, Raty, and Micoulaut J. Chem. Phys. 148, 244505 (2018)
to the emergence of a more complex picture which may not entirely be based on coordination changes with pres-sure.2,5,9 To apply such an analysis to the densified GeSe
4, we have evaluated the density nc of constraints per atom [Fig. 7(a)] between pairs or triplet of atoms, based from the MD atomic configurations. This enumeration is directly inspired by the classical mechanics view25 of mechanical constraints associating large/small radial or angular motion with the absence/presence of corresponding bond-stretching (BS) and bond-bending (BB) restoring forces. In practice, one calculates the atomic radial and angular excursions around average values from the MD trajectories, and active topo-logical constraints are then identified from their small radial and/or angular variances induced by the constraining inter-actions.12,26,27Previous applications on GexSe1−x glasses at P = 012have shown that the mean field Phillips-Thorpe con-straint count nc= 2 + 5x11is exactly recovered for composi-tions ranging from x = 0% to 33% Ge, providing confidence that such calculations are accurate.
Here, it is found that for GeSe4, nc first remains con-stant with applied pressure and then starts to increase at a pressure (8.3 GPa) somewhat below Pc [Fig. 7(a)]. Given the isostatic and adaptive nature28of GeSe4 at ambient con-ditions (nc ' 3), the application of pressure does not mod-ify the rigidity status in the range 0 < P < 8 GPa, and nc remains constant as long as voids or cavities are present in the structure [Fig.7(a), right axis]. These voids tend to collapse
FIG. 7. (a) Calculated total number of constraints ncas a function of pressure
P for GeSe4(filled squares), GeSe2(open squares), and As2Se3(green filled squares23,24). Right axis: Void volume (red curve) as a function of P. (b)
Bond-stretching (BS) contribution of Ge (black) and Se (red) in GeSe4(filled symbols) and GeSe2(open symbols). (c) Corresponding bond-bending (BB) constraints. The LDA-HDA threshold pressure determined from Fig.6for GeSe4is signaled in all panels (blue broken line).
dramatically in the pressure range 0 < P < 6.6 GPa (Fig.7). Close to the LDA to HDA threshold however and because there are no more voids left to accommodate further densification, ncnow evolves rapidly with pressure to reach nc= 8.29 for 49.2 GPa. This signals a network of extreme stiffness while also indicating a substantial growth of Ge and Se coordination numbers and, incidentally, BS and BB constraints. The obvi-ous difference between the reduction of void at low pressure and the short-range evolution at larger pressure that also results in the constraint variation is actually compatible with results obtained for densified borosilicate glasses29which show that there is a decoupling between void collapse at low pressure and the short-range collapse at elevated pressures, a situation that is also met in pressurized zeolithes.30,31
A detailed analysis of the constraints [Figs.7(b)and7(c)] shows that the increase in rigidity is strongly driven by Ge atoms, and nBSc increases indeed to about 3 which can be asso-ciated with a nearly octahedral environment (rGe= 2nBSc = 6). This is linked with the usual picture of pressure-induced coor-dination increase given that nBS
c scales as ri/2 (i = Ge, Se). However, it is also reflected by the growth of the number of stiffer angles as shown from the important increase of nBB
c for P > 10 GPa. Note that the transformation is also driven by the progressive loss of tetrahedral character which involves more and more p-bonded non-directional electronic states,16typical of an octahedral geometry and increased metallic character.7 The location of the threshold Pcobtained from the evolution of the PP position and the stress-strain curve (Fig.6) is, thus, found to be correlated with the pressure at which the iso-static nature of the network is lost (nc , 3) and voids have collapsed.
These features actually induce a cascade of other impor-tant structural changes (Fig. 8). It is seen, indeed, that the bond statistics also evolves when moving from the LDA to the HDA phase, the former being characterized by a rather important fraction of Ge–Se (67%) bonds (see also Ref.11), whereas the latter contains a substantially reduced population (55%). Note that the fraction of Ge–Ge bonds never exceeds 2.0% given the Ge-deficient stoichiometry of GeSe4.11 Con-versely, the population of Se–Se bonds grows substantially over the same pressure interval and leads to a nearly constant value of 45% for P > 22 GPa. The HDA phase, furthermore, shows a continuous distribution of Se–Se correlations between 2.2 and 3.4 Å, a quite unusual feature which signals that the Se-related structuration of the glass made of a well-defined first and second neighbouring shell at ambient conditions has been completely lost. The partial pair correlation function gSeSe(r) displays, indeed, a nearly constant (plateau) value for r < 3.4 Å (Fig.4), indicative of a variety of structural motifs and chemical bondings (atomic configuration, Fig. 8): edge correlations on a GeSe6/2 octahedra ('3.1 Å), homopolar Se–Se bondings (2.4–2.6 Å), correlations between the octa-hedra vertex, and the next-nearest neighbours that become very close due to the pressure induced buckling of the struc-ture (2.7–3.0 Å). All these observations lead to the conclusion that a pressure induced stressed rigid transition parallels the LDA-HDA transformation, as nc> 3.
A natural question that emerges at this stage is the degree of generality of these results for other compositions,
FIG. 8. Calculated fraction of Ge–Se and Se–Se bonds in GeSe4(filled sym-bols) and GeSe2(open symbols) as a function of pressure. A cut-off distance of 2.8 Å has been used (minimum of the total pair correlation function). On the top is represented a typical fragment of the HDA atomic structure at 39 GPa in GeSe4.
and, particularly, how the LDA-HDA transformation behaves with the Ge content x in GexSe1−x that covers the flexi-ble, the intermediate, and the stressed rigid phase.11 The same analysis performed on the stressed rigid GeSe2 shows that the detailed constraint count leads to an identical trend with pressure [Figs.7(b)and7(c)] and a threshold pressure Pc'10 GPa, consistently with Ref.32, whereas the total nc(P) is only shifted by a value nc(0) − 3 = 0.67 due to the increased concentration of Ge atoms [Fig.7(a)]. These results are also consistent with densified As2Se3(green symbols) which is iso-static23at zero pressure, and a nearly perfect overlap with the isostatic GeSe4result is obtained across the LDA-HDA transi-tion. Similarly, the strong increase obtained for the constraint density across the threshold Pcfor GeSe2is found parallel to the important changes in bonding population. In fact, Fig.8 indicates that the fraction of Ge–Se and Se–Se bonds in GeSe2 also undergo a rapid change as P increases.
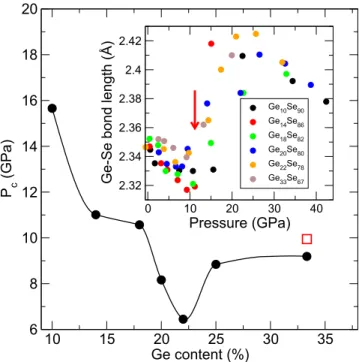
An account of coupled effects on pressure-induced amor-phous phases and rigidity can now be sketched. Previous numerical and experimental investigation of a series of com-positions in moderately densified Ge–Se glasses17show that under pressure the Ge–Se bond distance first reduces prior to an important increase at the LDA-HDA threshold located at P = Pc, resulting in a typical elongation of about 0.09 Å. These numerical trends (the inset of Fig.9) are globally consis-tent with x-ray absorption spectroscopy17and neutron diffrac-tion.16 The pressure Pc at which this abrupt change occurs obviously depends on the composition, and when represented as a function of Ge content (Fig.9), one realizes that Pcdoes not evolve monotonically and contains an anomaly that reveals fingerprints of the underlying rigidity status of the network11
FIG. 9. LDA-HDA transition pressure Pc as a function of Ge content x in GexSe1−xglasses, determined from the pressure evolution of simulated Ge–Se bond distances at select compositions (the inset of Ref.17). The pres-sure Pc has been chosen at the bond distance value closest to the marked jump (arrow for, e.g., Ge14Se86). The open red square corresponds to an experimental data point from Properzi et al.32
(flexible, intermediate, stressed). In both the chalcogen-rich flexible and the Ge-rich stressed rigid domains (e.g., Ge10Se90 and Ge33Se67, respectively), glasses are characterized by rather large molar volumes,34larger bulk moduli,33and reduced elas-tic recovery under load.35There is, therefore, the need of larger pressures in order to switch from LDA to HDA and induce coordination changes because there is also available free vol-ume, a situation that is particularly met for weakly cross-linked selenium chains (e.g., Ge10Se90). On the contrary, for Ge–Se glasses that belong to the so-called Boolchand intermediate phase (20%–25% Ge), it is well known that the absence of stress (isostaticity) leads to space-filling tendencies,36and, in fact, the molar volume is minimum between 20% and 25% Ge,34as also recently found in the As–Se binary.37Sensitivity to polyamorphism is, thus, enhanced for glasses with a higher density, and Pcis shifted to lower pressures for such almost isostatic compositions having also a reduced relaxation kinet-ics37,38due to their strong glass-forming character. A similar sensitivity to pressure has been acknowledged for interme-diate Ge–Se compositions in Raman studies.28 One might, therefore, expect to have LDA-HDA transformations at lower pressures for glasses displaying space-filling tendencies as in AsSe337or Ge8Si8Te84.39
VI. CONCLUSION
Here, we have used AIMD simulations to investigate the pressure effect of amorphous GeSe4, a material of fundamental interest given its particular isostatic nature, at the edge of flex-ible to rigid transitions. With pressure, a signature of a LDA to HDA threshold is detected from structural changes and from stress-strain representations. The substantial increase of the
244505-8 Yildirim, Raty, and Micoulaut J. Chem. Phys. 148, 244505 (2018)
constraint density appears to occur in the same pressure range as the LDA-HDA transformation.
Given that both LDA-HDA transformations and flexible to rigid transitions are found in a variety of glassy materi-als and given that pressure-induced rigidity is one efficient numerical alternative to stiffen network structures,12it would be certainly of great interest to investigate other potential model systems in order to contrast such transitions in other typical chalcogenides with changing connectedness (e.g., GexS1−x). Similarly, there are a certain number of archety-pal isostatic compounds (GeS4, SiO2, As2S3, . . .) that may well be investigated experimentally both from the viewpoint of rigidity and polyamorphism. Finally, it is also well known that molecular systems can undergo LDA-HDA transforma-tions as exemplified by metal-organic glasses40or amorphous water,3this transformation being now also observed in meso-porous materials31 which associate the pressure-driven void collapse with a non-trivial decelerated melting kinetics. A neat definition of network connectedness might be particu-larly difficult to establish for certain of these systems but it is important to emphasize that the MD based constraint count has a general basis and can here be applied as well.27 A direct application of such methods to structural models of amorphous water41 leads to nc = 1.67 at ambient pres-sure and to nc = 3.67 at 0.5 GPa, the LDA-HDA transition being approximatively found at 0.2 GPa;3i.e., flexible water at P = 0 becomes stressed rigid as pressure is applied. In this context, recent attempts42to capture the effects of weak (van der Waals) interactions on the relationship between rigidity and physico-chemical properties might be particularly helpful, and, e.g., shell models of amorphous water appear to be attrac-tive systems to further decode coupled effects of rigidity and polyamorphism.
ACKNOWLEDGMENTS
C.Y. acknowledges IDS FunMat (Project No. 2013-05-EM) and Onderzoeks Centrum voor de Aanwending van Staal (OCAS) for the financial support of his Ph.D. and post-doctoral projects, respectively. C.Y. and J.Y.R. gratefully acknowledge the computational resources provided by the Consortium des
´
Equipements de Calcul Intensif (C ´ECI), funded by the Fonds de la Recherche Scientifique de Belgique (F.R.S.-FNRS) under Grant No. 2.5020.11, and the Tier-1 supercomputer of the F´ed´eration Wallonie-Bruxelles, infrastructure funded by the Walloon Region under the Grant Agreement No. 1117545. M.M. acknowlegdes computational resources from Plateforme Romeo de l’Universit´e de Reims Champagne-Ardenne.
1P. H. Poole,Science275, 322 (1997).
2A. C. Barnes, L. B. Skinner, P. S. Salmon, and A. Bytchkov,Phys. Rev. Lett.103, 225702 (2009).
3O. Mishima, L. Calvert, and E. Whalley,Nature314, 76 (1985). 4L. B. Skinner, A. C. Barnes, P. S. Salmon, and W. A. Crichton,J. Phys.:
Condens. Matter20, 205103 (2008).
5A. Zeidler et al.,Phys. Rev. Lett.113, 135501 (2014).
6F. Pacaud and M. Micoulaut,J. Chem. Phys.143, 064502 (2015). 7M. Durandurdu and D. A. Drabold,Phys. Rev. B65, 104208 (2002). 8B. Kalkan, R. P. Dias, C.-S. Yoo, S. M. Clark, and S. Sen,J. Phys. Chem. C
118, 5110 (2014).
9K. Wezka, A. Bouzid, K. J. Pizzey, P. S. Salmon, A. Zeidler, S. Klotz, H. E. Fischer, C. L. Bull, M. G. Tucker, M. Boero, S. Le Roux, C. Tug`ene, and C. Massobrio,Phys. Rev. B90, 054206 (2014).
10V. V. Brazhkin, E. Bychkov, and O. B. Tsiok,J. Phys. Chem. B120, 358 (2016).
11M. Micoulaut, A. Kachmar, M. Bauchy, S. Le Roux, and C. Massobrio, Phys. Rev. B88, 054203 (2013).
12C. Yildirim, J.-Y. Raty, and M. Micoulaut, Nat. Commun. 7, 11086 (2016).
13K. Trachenko, M. T. Dove, V. Brazhkin, and F. S. El’kin,Phys. Rev. Lett.
93, 135502 (2004).
14S. Bhosle, K. Gunasekera, P. Boolchand, and M. Micoulaut,Int. J. Appl. Glass Sci.3, 205 (2012).
15J. Ruska and H. Thurn,J. Non-Cryst. Solids22, 277 (1976).
16A. Bouzid, K. Pizzey, A. Zeidler, G. Ori, M. Boero, C. Massobrio, S. Klotz, H. Fischer, C. L. Bull, and P. S. Salmon, Phys. Rev. B 93, 014202 (2016).
17C. Yildirim, M. Micoulaut, P. Boolchand, I. Kantor, O. Mathon, J.-P. Gaspard, T. Irifune, and J.-Y. Raty,Sci. Rep.6, 27317 (2016). 18L. B. Skinner, C. J. Benmore, S. Antao, E. Soignard, S. A. Amin, E. Bychkov,
E. Rissi, J. B. Parise, and J. L. Yarger,J. Phys. Chem. C 116, 2212 (2011).
19J. Akola and R. O. Jones,Phys. Rev. Lett.100, 205502 (2008).
20S. M. Antao, C. J. Benmore, B. Li, L. Wang, E. Bychkov, and J. B. Parise, Phys. Rev. Lett.100, 115501 (2008).
21R. Jeanloz, Geophys. Res. Lett. 8, 1219, https://doi.org/10.1029/ gl008i012p01219 (1981).
22J. P. Guin, T. Rouxel, J. C. Sangleboeuf, I. Melsco¨et, and J. Lucas,J. Am. Ceram. Soc.85, 1545 (2002).
23M. Bauchy, A. Kachmar, and M. Micoulaut,J. Chem. Phys.141, 194506 (2014).
24M. Micoulaut, unpublished results. 25F. Wilcek,Phys. Today57(10), 11 (2004).
26M. Bauchy and M. Micoulaut,J. Non-Cryst. Solids377, 34 (2013). 27M. Bauchy and M. Micoulaut,Phys. Rev. Lett.110, 095501 (2013). 28F. Wang, S. Mamedov, P. Boolchand, B. Goodman, and M. Chandrasekhar,
Phys. Rev. B71, 174201 (2005).
29B. Mantisi, S. Adichtchev, S. Sirotkin, L. Rafaelly, L. Wondraczek, H. Behrens, C. Marcenat, N. V. Surovtsev, A. Pillonnet, and E. Duval,J. Phys.: Condens. Matter22, 025402 (2010).
30J. Haines, C. Levelut, A. Isambert, P. H´ebert, S. Kohara, D. A. Keen, T. Hammouda, and D. Andrault, J. Am. Chem. Soc. 131, 12333 (2009).
31L. Wondraczek, Z. Pan, T. Palenta, A. Erlebach, S. T. Misture, M. Sierka, M. Micoulaut, U. Hoppe, J. Deubener, and G. N. Greaves,Adv. Sci.5, 1700850 (2018).
32L. Properzi, A. Di Cicco, L. Nataf, F. Baudelet, and T. Irifune,Sci. Rep.5, 11088 (2015).
33V. V. Brazhkin, E. Bychkov, and O. B. Tsiok,J. Exp. Theor. Phys.123, 308 (2016).
34S. Bhosle, P. Boolchand, M. Micoulaut, and C. Massobrio,Solid State Commun.151, 1851 (2011).
35J. C. Mauro and A. K. Varshneya,J. Am. Ceram. Soc.90, 192 (2007). 36C. Bourgel, M. Micoulaut, M. Malki, and P. Simon,Phys. Rev. B79, 024201
(2009).
37S. Ravindren, K. Gunasekera, Z. Tucker, A. Diebold, P. Boolchand, and M. Micoulaut,J. Chem. Phys.140, 134501 (2014).
38K. Gunasekara, S. Bhosle, P. Boolchand, and M. Micoulaut,J. Chem. Phys.
139, 164511 (2013).
39K. Gunasekera, P. Boolchand, and M. Micoulaut,J. Appl. Phys.115, 164905 (2014).
40T. D. Bennett et al.,Nat. Commun.6, 8079 (2015).
41N. Giovambattista, C. A. Angell, F. Sciortino, and H. E. Stanley,Phys. Rev. Lett.93, 047801 (2004).
![FIG. 4. The calculated pressure dependence of partial pair distribution functions for GeSe 4 [from upper panel to lower: g GeGe (r), g GeSe (r), and g SeSe (r)].](https://thumb-eu.123doks.com/thumbv2/123doknet/6581478.178360/5.891.77.429.77.857/calculated-pressure-dependence-partial-distribution-functions-gese-upper.webp)