Experimentation of mitigation techniques to reduce the
effects of permafrost degradation on transportation
infrastructures at Beaver Creek experimental road site
Alaska Highway, Yukon
Mémoire
Julie Malenfant Lepage
Maîtrise en génie civil
Maître ès sciences (M. Sc.)
Québec, Canada
iii
Résumé
Les méthodes de design et de construction des routes développés dans le sud canadien ont maintenant besoin d’être adaptés aux environnements nordiques du pays afin de prévenir le dégel dramatique du pergélisol lors de la construction d’une nouvelle route. De plus, le réchauffement climatique occasionne présentement d’importants problèmes de stabilité des sols dans le nord canadien. Ces facteurs causent des pertes importantes au niveau des capacités fonctionnelles et structurales de l’Alaska Highway au Yukon sur un segment de plus de 200 km situé entre le village de Destruction Bay et la frontière de l’Alaska. Afin de trouver des solutions rentables à long terme, le ministère du transport du Yukon (en collaboration avec le Federal Highway Administration du gouvernement américain, Transports Canada, l’Université Laval, l’Université de Montréal et l’Alaska University transportation Center) a mis en place 12 sections d’essais de 50 mètres de longueur sur l’autoroute de l’Alaska près de Beaver Creek en 2008. Ces différentes sections d’essais ont été conçues pour évaluer une ou plusieurs méthodes combinées de stabilisation thermique telles que le drain thermique, le remblai à convection d’air, le pare-neige / pare-soleil, le remblai couvert de matières organiques, les drains longitudinaux, le déblaiement de la neige sur les pentes et la surface réfléchissante. Les objectifs spécifiques de la recherche sont 1) d’établir les régimes thermiques et les flux de chaleur dans chacune des sections pour les 3 premières années de fonctionnement ; 2) de documenter les facteurs pouvant favoriser ou nuire à l’efficacité des systèmes de protection et ; 3) de déterminer le rapport coûts/bénéfices à long terme pour chacune des techniques utilisées. Pour ce faire, une nouvelle méthode d’analyse, basée sur la mesure de flux d’extraction de chaleur Hx et d’induction Hi à l’interface entre le remblai et le sol naturel, a été utilisée dans cette étude. Certaines techniques de protection du pergélisol démontrent un bon potentiel durant leurs 3 premières années de fonctionnement. C’est le cas pour le remblai à convection d’air non-couvert, le remblai à convection d’air pleine largeur, les drains longitudinaux, le pare-soleil / pare-neige et la surface réfléchissante. Malheureusement, des problèmes dans l'installation des drains thermiques ont empêché une évaluation complète de leur efficacité.
v
Abstract
Road design and construction techniques developed in southern Canada definitely need to be adapted to northern environment to prevent dramatic permafrost thawing after new road construction. Furthermore, climate warming causes now important soil stability problems in the Canadian far north. All these factors lead to a loss of the functional and structural capacities of the Alaska Highway over a 200-km section mainly from Destruction Bay to the Alaska border. To find long term and cost-effective solutions, Yukon Highways and Public Works (in collaboration with the Alaska University Transportation Center, Transport Canada, le U.S. Federal Highways Administration, l’Université de Montréal and l’Université Laval) constructed 12 instrumented sections on the Alaska Highway near Beaver Creek (Yukon) in 2008. These sections experiment one or several combined methods of thermal stabilization such as convection air embankment, heat drains, snow/sun shed, grass-covered embankment, longitudinal culverts, reflecting surfaces and snow clearing on embankment slopes. The main objectives of this project are 1) to analyze the ground thermal regime and the heat fluxes for each of the 12 sections during their first three years in service; 2) to document all factors which can facilitate or disrupt the efficiency of the protection systems and; 3) to determine the long term costs / benefits ratio for every technique tested. In order to do this, a new method based on the calculation of heat extraction Hx and heat induction
Hi index at the interface between the embankment and the natural ground has been used in
this study. The permafrost mitigation techniques that showed good potential for cooling by reducing active layer thicknesses were the ACE uncovered, the longitudinal culverts, the snow/sun shed and the light-coloured aggregate BST (although this was only effective along the central part of the highway). Unfortunately, problems in the installation of the heat drain techniques prevented a full assessment of their effectiveness. The durability of the sections as well as their long-term cooling potential must also be assessed to complete the economic analysis provided in this study.
vii
Table of Contents
Résumé ... iii
Abstract ... v
Table of Contents ... vii
List of Tables ... xiii
List of Figures ... xvii
List of Symbols and Abbreviations ... xliii Acknowledgements ... xlv INTRODUCTION ... 1
Research Objectives ... 2
Document Organization ... 3
CHAPTER 1 ... 5
Permafrost Issues from the past to the present ... 5
1.1 History of the Alaska Highway ... 5
1.2 Issues related to the road construction in 1942 ... 6
1.3 Present Day Issues and road distresses ... 8
1.3.1 Typical pavement structure for the Alaska Highway ... 8
1.3.2 Evidence of permafrost degradation under the Alaska Highway ... 10
The main evidence of permafrost degradation under the Alaska Highway is described in more details below. ... 12
ISSUE 1: Differential settlement and sinkholes ... 12
ISSUE 2: Longitudinal cracking ... 14
ISSUE 3: Guardrails « sinking » into the road embankment and poor bridge connexion to the road ... 16
ISSUE 4: Creep of the road embankment ... 17
ISSUE 5: Retrogressive thaw slumps along the highway leading to embankment failures ... 18
ISSUE 6: Melting of ice wedges, buried massive ice and development of thermokarsts having severe effects on engineering structures ... 20
ISSUE 8: Drainage system failure ... 22
ISSUE 9: Ponding and moving water along the embankment causing thermal erosion ... 24
ISSUE 10: Cut slopes stabilization ... 25
ISSUE 11: Icing ... 26
1.3 Conclusion ... 27
CHAPTER 2 ... 29
Identification, description and classification of existing permafrost protections techniques ... 29
2.1 Methods preventing heat intake underneath the embankment ... 29
2.1.1 Embankment thickening ... 30
2.1.2 Embankment insulation with polystyrene and polyurethane ... 30
2.1.3 Peat Insulation ... 33
2.1.4 Reflective surfaces ... 35
2.1.5 Snow/Sun sheds ... 38
viii
2.2.1 Air ducts ... 40
2.2.2 Thermosyphons ... 43
2.2.3 Air convection embankment ... 45
2.2.4 Heat drain (HD) ... 49
2.3 Methods based on the reinforcement of the embankment ... 51
2.3.1 Geogrids and geotextiles ... 51
2.3.2 Berms and gentle slope ... 53
2.4 Other methods ... 55
2.4.1 Pre-thawing ... 55
2.4.2 Excavation and replacement ... 56
2.4.3 Build and maintain ... 56
2.4.4 Snow removal ... 57
2.5 Conclusion ... 58
CHAPTER 3 ... 61
Beaver Creek experimental road site ... 61
3.1 Experimental site description ... 61
3.2 Construction of the permafrost protection techniques ... 64
3.2.1 Section 1: Air convection on full embankment ... 64
3.2.2 Section 3: Air convection embankment, slopes covered ... 65
3.2.3 Section 9: Air convection embankment, slopes uncovered ... 66
3.2.4 Construction challenges related to ACE sections ... 67
3.2.5 Section 2: Heat drains on full embankment ... 67
3.2.6 Section 4: Heat drains on side slopes ... 69
3.2.7 Section 8: Heat drains with insulation ... 70
3.2.8 Construction challenges related to the heat drain mitigation technique ... 71
3.2.9 Section 5: Control section ... 72
3.2.10 Section 6: Snow/sun shed ... 72
3.2.11 Section 7: Longitudinal Culverts ... 73
3.2.12 Section 10: Snow clearing technique ... 75
3.2.13 Section 11: Grass covered embankment ... 76
3.2.14 Section 12: Light-colored bituminous surface treatment ... 77
3.3 Instrumentation ... 78
3.4 Beaver Creek climate ... 81
3.4 Permafrost ... 82
3.6 Winter field investigations ... 84
5.6.1 Snow cover ... 84
3.7 Wind speed and direction ... 87
3.8 Drainage ... 89
3.9 Road surface profiler survey ... 90
CHAPTER 4 ... 95
Thermal regime ... 95
4.1 Control section (section 5) ... 98
4.1.1 Road side slope (control section) ... 98
4.1.2 Embankment toe (control section) ... 101
4.1.2 Road centerline (control section) ... 102
4.2 Air convection on full embankment ... 104
ix
4.2.2 Embankment toe (ACE full embankment) ... 106
4.2.3 Road centerline (ACE full embankment) ... 107
4.3 Air convection embankment slopes covered ... 108
4.3.1 Road side slope (ACE slopes covered) ... 108
4.3.2 Road centerline (ACE slopes covered) ... 110
4.4 Air convection embankment slopes uncovered ... 111
4.4.1 Road side slope (ACE uncovered) ... 111
4.4.2 Road centerline (ACE slopes uncovered) ... 113
4.5 Thermal regime comparison of the ACE sections ... 113
4.5.1 Thermal regime comparison between the side slopes with different ACE techniques ... 113
6.5.2 Thermal regime comparison in the road centerline with different ACE techniques ... 116
4.6 Heat drain on full embankment ... 117
4.6.1 Road side slope (heat drain on full embankment) ... 117
4.6.2 Embankment toe (heat drain on full embankment) ... 120
4.6.3 Road centerline (heat drain on full embankment) ... 122
4.7 Heat drain on side slopes ... 123
4.7.1 Road side slope (heat drain on side slopes) ... 123
4.7.2 Road centerline (heat drain on side slopes) ... 126
4.8 Heat drain on side slopes with insulation ... 128
4.8.1 Road side slope (heat drain with insulation) ... 128
4.9 Field investigation of the heat drains ... 131
4.10 Snow/sun shed (road side slope) ... 132
4.11 Longitudinal culverts (road side slope) ... 136
4.12 Snow clearing technique (road side slope) ... 140
4.13 Grass-covered embankment (road side slope) ... 144
4.14 Light colored aggregate bituminous surface treatment (BST) ... 147
4.14.1 Road side slope (Light colored aggregate BST) ... 147
4.14.2 Road centerline (section 12) ... 149
4.15 Summary ... 154
CHAPTER 5 ... 157
Thermal gradient and heat balance analysis ... 157
5.1 Thermal gradient analysis ... 157
5.1.1 Thermal gradient in the embankment side slope ... 157
5.1.2 Thermal gradients in the middle of the embankment ... 160
5.2 Heat balance analysis ... 162
5.2.1 Methodology ... 162
5.2.2 Results ... 164
5.2.2.1 Heat balance from the embankment slopes ... 164
5.2.2.2 Heat balance under the centerline of the road ... 167
5.3 Correlation with Batenipour method ... 168
CHAPTER 6 ... 171
Economic Analysis ... 171
CHAPTER 7 ... 175
Summary of analysis ... 175
x
7.2 ACE sections ... 175
7.2.1 ACE on full embankment ... 175
7.2.2 ACE slopes covered ... 177
7.2.3 ACE slopes uncovered ... 178
7.3 Heat Drain sections ... 180
9.3.1 HD on full embankment ... 180
7.3.2 HD on side slopes ... 181
7.3.4 HD with insulation ... 182
7.4 Snow/sun shed ... 182
7.5 Longitudinal culverts ... 183
7.6 Snow clearing technique ... 184
7.7 Grass-covered embankment ... 185
7.8 Light-colored aggregate BST ... 186
7.8 Discussion on the result’s validity ... 187
CHAPTER 8 ... 191
Discussion on climate change for the Beaver Creek region and its impacts on civil infrastructure ... 191
8.1 Past climate ... 191
8.2 Future Climate Projections for the Beaver Creek Area ... 193
8.2.1 Air temperature ... 193
8.2.2 Precipitations ... 196
8.3 Consequences of climate change on transportation infrastructure ... 197
8.4 Conclusion ... 199
CONCLUSION ... 201
Bibliography ... 203
APPENDIX A ... 215
Thermal and mechanical properties of permafrost ... 215
A1 - Thermal Definition ... 215
A2 - Ground ice ... 220
A2.1 - Pore ice ... 220
A2.2 - Ice lenses ... 220
A2.3 - Ice veins ... 222
A2.4 - Massive ice ... 222
A3 - Mechanical properties of permafrost ... 224
A3.1 - Shear Strength ... 225
A3.2 - Stiffness ... 226
A3.3 - Volume Change ... 226
A4 - Soil states: from frozen to thawed permafrost ... 227
A4.1 - Frozen layer ... 228
A4.2 - Marginally frozen layer ... 228
A4.3 - Thawing / thawed layer ... 231
A5 - Thaw settlement and consolidation ... 232
APPENDIX B ... 237
Additional tables and figures... 237
B1 - Depth of the thermistors relative to the embankment surface and the natural ground surface ... 237
xi B2 - Mean daily ground temperature recorded by every thermistor between 2009 and 2011 ... 247 B3 - 2009, 2010 and 2011 trumpet curves ... 258 B4 – Mean daily temperature at 0, -1 and -2 m depth between 2009 and 2011 ... 268 B5 – Bi-monthly thermal regimes of every test section compared with the control section ... 277
B5.1 Thermal profiles of the ACE full embankment and the HD full embankment compared with the control section at the embankment toe ... 277 B5.2 – Thermal profiles of the ACE full embankment, the ACE covered and the ACE uncovered compared with the control section in the embankment side slope ... 316 B5.3 – Thermal profiles of the HD full embankment, HD on sides slopes and HD with insulation compared with the control section in the embankment side slope . 355 B5.4 – Thermal profiles of the snow/sun shed compared with the control section in the embankment side slope ... 394 B5.5 – Thermal profiles of the longitudinal culvert and the snow clearing technique compared with the control section in the embankment side slope ... 433 B5.6 – Thermal profiles of the grass-covered embankment and the light colored aggregates BST compared with the control section in the embankment side slope ... 472 B5.6 – Thermal profiles of the grass-covered embankment and the light colored aggregates BST compared with the control section in the embankment side slope ... 513 B5.7 – Thermal profiles of the ACE full embankment, the ACE slopes covered and the ACE slopes uncovered compared with the control section in the road middle 552 B5.8 – Thermal profiles of the HD full embankment, the HD on side slopes and the light colored aggregates BST compared with the control section in the middle of the road ... 591
xiii
List of Tables
Table 1 : Summary description of typical materials used for road construction in permafrost regions. ... 9 Table 2 : Description of the mitigation techniques tested. ... 63 Table 3 : Localization of boreholes along the experimental test site ... 79 Table 4 : Mean annual air temperature recorded from 2009 to 2011 for the Beaver Creek
test site. ... 81 Table 5 : Comparison between the freezing and thawing indices (°C) calculated from the
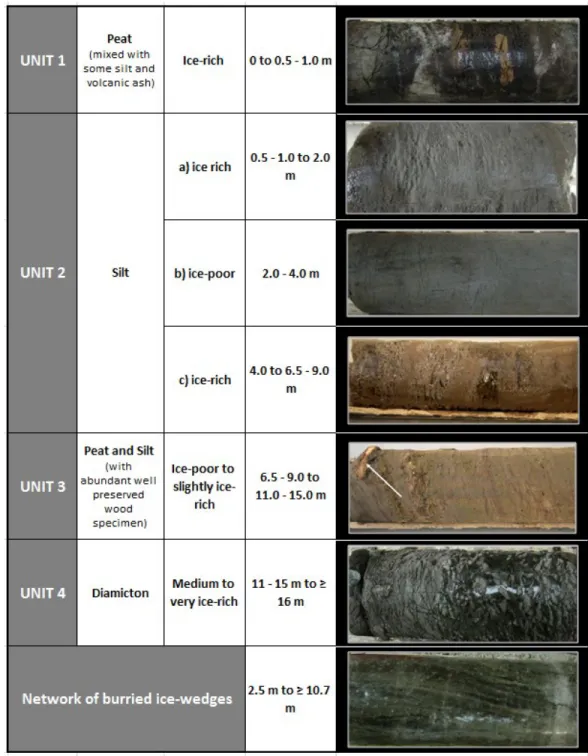
weather station at section 11 of the Beaver Creek experimental test site and climate normal (1971-2000) data (Environment Canada, 2011). The difference indicates departure of each index from climate normal conditions. ... 82 Table 6 : Soil units and their depths at the Beaver Creek test site (adapted from Stephani
(2013)). ... 83 Table 7 : Average snow thicknesses and limit of plowed snow cover on the west slope of
the experimental embankment on March 29 and 30, 2011. ... 85 Table 8 : Depth of differential settlement and international roughness index (IRI) measured in July 2010. ... 92 Table 9 : Mean annual temperature registered by every thermistor in the control section side
slope. ... 99 Table 10: Mean annual ground temperature recorded by every thermistor in the
embankment toe of the control section. ... 101 Table 11: Mean annual temperature recorded by every thermistor under the centerline of
the control section. ... 103 Tableau 12 : Mean annual temperature recorded by every thermistor in the side slope of the ACE full embankment. ... 105 Table 13 : Mean annual temperature registered by every thermistor in the side slope toe of
the ACE full embankment. ... 106 Table 14 : Mean annual ground temperature registered by every thermistor under the
centerline of the ACE full embankment. ... 108 Table 15 : Mean annual ground temperature recorded by every thermistor in the side slope
of the ACE slopes covered. ... 109 Table 16: Mean annual ground temperature recorded by every thermistor under the road
centerline of the ACE slopes covered. ... 110 Table 17 : Mean annual ground temperature recorded by every thermistor in the side slope
of the ACE slopes uncovered. ... 112 Table 18 : Mean annual ground temperature recorded by every thermistor in the side slope
of the heat drain full embankment. ... 118 Table 19 : Mean annual ground temperature recorded by every thermistor underneath the
embankment toe of the heat drain on full embankment. ... 120 Tableau 20 : Mean annual ground temperature recorded by every thermistor underneath the road centerline of the heat drain on full embankment. ... 123 Table 21: Mean annual ground temperature recorded by every thermistor in the slope of the heat drain on side slopes. ... 124 Table 22: Mean annual ground temperature recorded by every thermistor in the road center
xiv
Table 23: Mean annual ground temperature recorded by every thermistor in the slope of the heat drain with insulation. ... 129 Table 24: Mean annual ground temperatures recorded by every thermistor in the side slope
below the snow/sun shed. ... 133 Table 25: Mean annual ground temperatures recorded by every thermistor in the road side
slope of the longitudinal culvert section. ... 137 Table 26: Mean annual ground temperatures recorded by every thermistor in the road side
slope of the snow clearing section. ... 140 Table 27: Mean annual ground temperature recorded by every thermistor in the side slope
of the grass-covered embankment. ... 145 Table 28: Mean annual ground temperatures recorded by every thermistor in in the side
slope of the light colored BST test section. ... 148 Table 29: Mean annual ground temperature recorded by every thermistor under the
centreline of the light-colored aggregate BST section. ... 151 Table 30: Synthesis of the results ... 154 Table 31: Annual heat induction index, extraction index and heat balance for the three
monitoring years in the embankment side slope. ... 166 Table 32: Annual heat induction index, extraction index and heat balance for the three
monitoring years under the road centreline. ... 168 Table 33: Results of the average temperature profile, calculated based on the approach
described by Batenipour et al. (2010). When the slope of the average profile between 0 and -2 m depth in the natural ground was negative (net outflow) the blue colour was attributed to the section, if not for the positive slopes (net inflow) the red color was attributed. In few cases, the orange coloured was used when the slope of the average profile was equal to 0°C/m. ... 170 Table 34 : Costs related to test section design and construction, maintenance operations,
and road users (adapted from Reimchen et al. 2009). ... 174 Table 35: Increases in temperature (°C) on a seasonal basis from the time period 1969-2005
at the Beaver Creek A climatic station (Environment Canada, 2011). ... 192 Table 36 : Projected monthly temperature values (expressed as °C) for the Beaver Creek
area based on the A1B mid-range emission scenario (SNAP, 2012). Baseline climate normal values for 1961-1991 (Environment Canada, 2013) are use as comparison. Values in brackets indicate direction and amount of projected change form baseline conditions. ... 195 Table 37 : Projected yearly and seasonal temperature changes (expressed as °C) for the
Beaver Creek area based on the A1B mid-range emission scenario (SNAP, 2012). Baseline climate normal values for 1961-1991 (Environment Canada, 2013) are use as comparison. Values in brackets indicate direction and amount of projected change form baseline conditions. The season periods have been analyzed as follow: spring (March to May), summer (June to August), fall (September to November) and winter (December to January). ... 196 Table 38 : Projected yearly and seasonal precipitation changes (expressed as mm total
precipitation and % of increase compared to the baseline) for the Beaver Creek area based on the A1B mid-range emission scenario (SNAP, 2012). Baseline climate normal values for 1961-1991 (Environment Canada, 2013) are use as comparison. The season periods have been analyzed as follow: spring (March to May), summer (June to
xv August), fall (September to November) and winter (December to January). Snowfall has
been converted to snow water equivalent and is also expressed in mm. ... 197
Table A.1: Bearing capacity loss during spring thaw, according to various authors (Doré and Zubeck, 2009). ... 232
Table B.1 : Thermistor depth relative to the embankment surface and the ground surface for the ACE full embankment (Location: side slope and road center). ... 237 Table B.2 : Thermistor depth relative to the embankment surface and the ground surface
for the HD full embankment (Location: side slope and road center). ... 238 Table B.3 : Thermistor depth relative to the embankment surface and the ground surface for
the ACE slopes covered (Location: side slope and road center). ... 239 Table B. 4 : Thermistor depth relative to the embankment surface and the ground surface
for the HD on side slopes (Location: side slope and road center). ... 240 Table B. 5 : Thermistor depth relative to the embankment surface and the ground surface
for the control section (Location: side slope and road center). ... 241 Table B.6 : Thermistor depth relative to the embankment side slope surface and the ground surface for the snow/sun shed and the longitudinal culvert techniques. ... 242 Table B.7 : Thermistor depth relative to the embankment surface and the ground surface for
the ACE slopes uncovered (Location: side slope and road center). ... 243 Table B.8 : Thermistor depth relative to the embankment side slope surface and the ground surface for the HD with insulation and the snow clearing technique. ... 244 Table B.9 : Thermistor depth relative to the embankment surface and the ground surface for
the light colored aggregates BST (Location: side slope and road center). ... 245 Table B.10 : Thermistor depth relative to the embankment side slope surface and the
xvii
List of Figures
Figure 1 : Map of the Alaska Highway and road construction sections undertaken by the U.S. Army Corps of engineers (Yukon Archives, 2012). ... 6 Figure 2 : A) Bulldozer clearing bush during construction of the Alaska Highway in 1942.
B) Muddy ruts made traveling difficult, even by truck. Alaska Highway north of Whitehorse in 1943 (Yukon Archives, 2012). ... 7 Figure 3 : « Corduroy » technique used during the construction of the Alaska Highway
(Yukon Archives, 2012). ... 7 Figure 4 : Typical road cross-section with berm of the Alaska Highway. ... 9 Figure 5 : Bituminous surface treatment on the Alaska Highway: the aggregates are
compacted and pressed into the emulsion (photo: YHPW). ... 10 Figure 6 : The most notable permafrost-affected area runs between Destruction Bay and the U.S. border and is outline in dark blue. ... 11 Figure 7 : Results of working in thawed ice-rich permafrost during road construction in
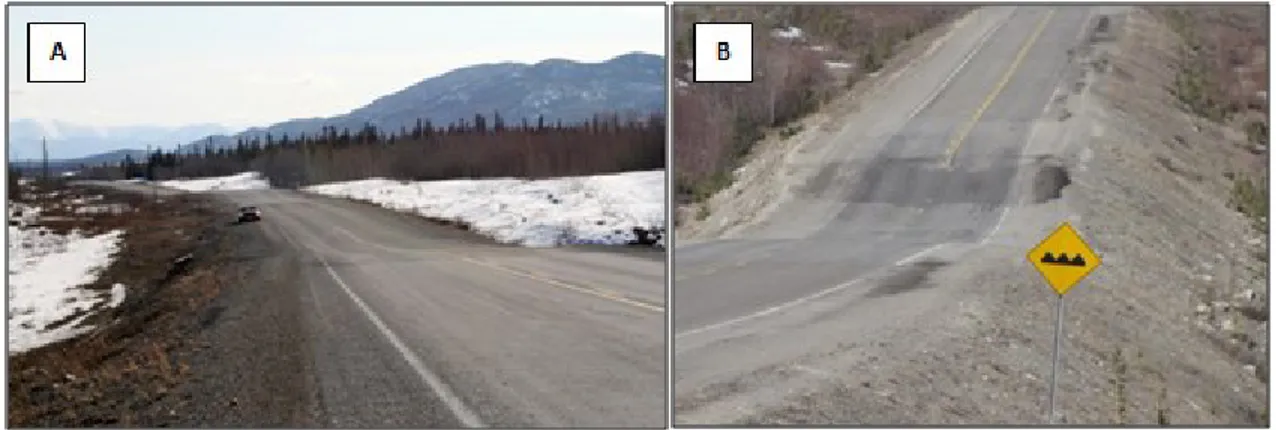
September 1994 (photo: YHPW). ... 12 Figure 8 : A) Common differential settlements observed on the Alaska Highway; B)
General settlement present on an access road going to the Dry Creek rest area near Beaver Creek in 2012 (photos: Julie M-Lepage). ... 13 Figure 9 : A) Differential settlement with water ponding near the centerline of the road; B)
Potholes in the bituminous surface treatment (photos: Julie M-Lepage, 2010). ... 13 Figure 10 : Longitudinal cracking along the embankment shoulder (photos: Julie
M-Lepage, 2009-2010). ... 15 Figure 11 : Permafrost thawing under the side slopes as a result of embankment geometry
(Transportation Association of Canada, 2010). ... 15 Figure 12 : Geogrids implementation on the Alaska Highway in summer 2011 (Photo:
Yukon Highways and Public Works). ... 16 Figure 13 : A) and B) Guardrails « sinking » into the road embankment due to permafrost
thawing (photos: Julie M-Lepage); C) Surface connection to the bridge does not meet YHPW standards and the curb is exposed, Koidern bridge, km 1810 (photo: YHPW). ... 17 Figure 14 : Creep of the Alaska Highway in the Takhini Valley; A) km 1462 in 2011 and
B) km 1446 in 2013 (photos: Guy Doré). ... 18 Figure 15 : A) 2003 photo of retrogressive thaw slump adjacent to Alaska Highway. The
dashed line highlights the remnant headscarp. Inset aerial photograph shows the slump in 1987 (Huscroft et al., 2004); B) Retrogressive thaw slump schematic (adapted from French 2007). The permafrost table acts as a lubricated slip plane and controls the depth of the failure plane. ... 19 Figure 16 : Thawing evolution initiated by granular material excavation (Location: Dry
Creek 2, km 1842, east side of the Alaska Highway). ... 20 Figure 17 : Picture showing the fast evolution of a debris slide related to growth of a
thermokarst depression adjacent to the Alaska Highway, between 2003 and 2009 (Location: Dry Creek 2, km 1842, west side of the Alaska Highway). ... 21 Figure 18 : Examples of culvert failures: A) along the Dalton Highway in Alaska (photo:
xviii
thawing of underlying permafrost (photo: Fabrice Camels); C) failure of a riveted culvert near Beaver Creek, Yukon (photo: YHPW). ... 22 Figure 19 : Installation of an insulated culvert (photo: YHPW). ... 23 Figure 20 : Example of a thermal erosion process along an embankment at km 1462 of the
Alaska Highway (photo: Julie M-Lepage, 2012). ... 24 Figure 21 : Water ponding along the Alaska Highway embankment between Beaver Creek
and the US border (photo: Julie M-Lepage, 2012). ... 25 Figure 22 : Cut slopes stabilization used in Yukon (Doré and Zubeck, 2009). ... 25 Figure 23 : A) Backslope with major failure caused by water flowing down the slope
(photo: YHPW); B) Backslope protection using rock (photo: YHPW); C) Granular backslope with geotextile reinforcement. Only minor settlements are observed. The performance of gravel blankets is enhanced when they are seeded (photo: YHPW). . 26 Figure 24 : Icing extends across the Alaska Highway near Haines Junction in March 2012
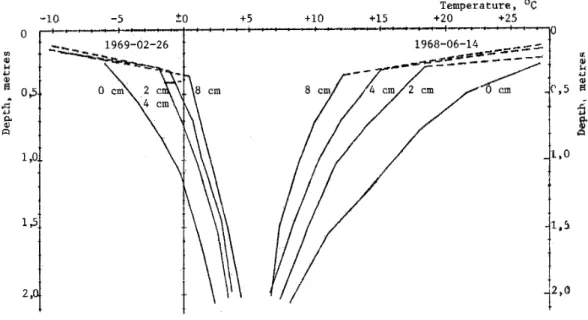
(Photo: Kate Grandmont). ... 27 Figure 25 : Insulation installation (Beaulac and Doré, 2006a) ... 31 Figure 26 : Vertical variation of temperature at a varying thickness of the insulating layer
(Gandahl, 1978). ... 32 Figure 27 : Permafrost degradation under different surface conditions (reproduced from
Linell (1973) In Transportation Association of Canada (2010)). ... 34 Figure 28 : Natural vegetation left in place prior highway construction in the Yukon
(Transportation Association of Canada, 2010) ... 35 Figure 29 : A) White paint application on a test section in Alaska (Photo: Cold Region
Research and Engineering Lab, CRREL); B) Picture of the same test section 30 years later (Photo: Guy Doré). ... 36 Figure 30 : Incident and reflected solar radiation at the highway test section in 1970 (Berg
and Aitken, 1973). ... 37 Figure 31 : Light colored pavement applied on Front Street in Dawson City, Yukon, to
protect the permafrost underneath and to preserve the heritage value of the gold rush city (photo: YHPW). ... 38 Figure 32 : A) Snow/sun sheds in Bonanza Creek, Alaska (Zarling and Braley, 1986); B)
Snow/sun shed, Qinghai-Tibet Highway, Tibetain Plateau (Yu et al. 2008). ... 39 Figure 33 : A) Cross section of the roadway embankment showing the duct system with
chimneys (Braley et al. 1991); B) Air duct system with chimneys along the Alaska Highway (Doré and Zubeck, 2009). ... 41 Figure 34 : Open-ended duct ventilating system tested at the Beiluhe test site on the
Qinghai-Tibet plateau (Niu et al. 2006) ... 42 Figure 35 : Thermosyphons under the Donjek Bridge, Yukon (photo: Julie M-Lepage). ... 44 Figure 36 : A) Diagram of the hairpin thermosyphon and instrumentation system (Xu and
Goering, 2008). B) Infrared image showing heat from the condensers of totally buried thermosyphons radiating to the cold air along Thompson Drive in Fairbanks, Alaska (Photo: Doug Goering In Arctic Foundations Inc. (2013)). ... 44 Figure 37 : Embankments shoulder protection using convective cooling. A) Thompson
Drive, Fairbanks, Alaska (photo: Julie M-Lepage); B) Wintertime pore air circulation in the ACE (McHattie and Goering, 2009). ... 46 Figure 38 : Various embankment configurations (Guodong et al. 2008). ... 47
xix Figure 39 : A) Schematic showing heat conduction to the drain and heat convection through
the drain (Lemelin et al. 2008); B) Heat drain made of a corrugated plastic core
covered on both sides by geotextile (Beaulac, 2006) ... 49
Figure 40 : A) Heat drain implementation in the airstrip embankment shoulder in Tasiuaq (Lemelin et al. 2008); B) Heat drain test section after construction in Tasiuaq. Only the inlet (white pipes) and outlet (black pipes) chimneys are visible after construction (photo: Julie M-Lepage, 2011). ... 50
Figure 41 : Geogrids implementation on the Alaska Highway in summer 2011 (Photo: Yukon Highways and Public Works). ... 52
Figure 42 : A) Use of geotextiles in the “pillow method” on the Alaska Highway in summer 2013 (Photo: Julie M-Lepage); B) Schematic of the core embankment reinforced with geotextiles (Doré and Zubeck, 2009). ... 52
Figure 43 : Rock berm along the Alaska Highway in the Yukon (Doré, 2005) ... 54
Figure 44 : A) Construction of the gentle slope section in Tasiuaq with 8H:1V slope (Lemelin et al. 2008); B) Low snow accumulation observed in the gentle section in February 2008 (Doré and Jorgensen, 2009). ... 55
Figure 45 : Snow removal on embankment slopes (Transportation Association of Canada, 2010) ... 57
Figure 46: Map of the Alaska Highway in the Yukon. ... 62
Figure 47 : Schematic of Beaver Creek experimental test site. Important note: the location of sections 4 and 5 were interchanged during the construction (see red arrow). ... 62
Figure 48 : Schematic of ACE full embankment. ... 64
Figure 49 : A) ACE on full embankment with geotextile implementation (Mercier, 2008); B) West slope of the ACE full embankment one year after its implementation (July 2009). ... 64
Figure 50 : Schematic of the air convection embankment, slopes covered. ... 65
Figure 51 : A) ACE embankment on side slopes with inlets implementation (Mercier, 2008); B) West slope of the ACE slopes covered one year after its implementation (July 2009). ... 65
Figure 52 : Schematic of the air convection embankment, slopes uncovered. ... 66
Figure 53 : Uncovered air convection embankment (2010). ... 66
Figure 54 : Schematics of heat drains on full embankment. ... 68
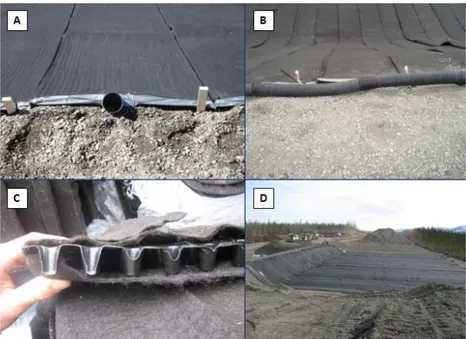
Figure 55 : A) Geocomposite connected on one side to a 4” pipe; B) Connection of the 4” pipes to the road parallel to pipe sections which will be connected to outlets; C) Close-up of the geocomposite; D) Overview of the heat drain installation before backfilling operations. (Mercier, 2008) ... 68
Figure 56 : Schematics of heat drains on side slopes showing the two independent air convection systems on each side of the road. ... 69
Figure 57 : A) Installation of the heat drain into slopes embankment before backfilling with granular material (photo: YHPW); B) Heat drain on side slope sections, with inlets located at the toe of the embankment toe and outlets at the top. ... 69
Figure 58 : Schematics of heat drains with insulation on embankment slopes ... 70
Figure 59 : A) Installation of the insulation layer on west slope (photo: YHPW); B) Inlets located at the toe of the embankment and outlets at the top (view of the east slope in 2009). ... 71
Figure 60 : Crushed geocomposite (Mercier, 2008). ... 71
xx
Figure 62 : Profile View of the snow/sun shed. ... 73 Figure 63 : Snow/sun shed on west slope (2010). ... 73 Figure 64 : A) Main culvert section parallel to the road (before backfilling in 2008); B)
Horizontal and vertical pipes are air inlets and outlets, respectively (2009); C) Schematic of the longitudinal culvert mitigation technique, where the dotted line represents the section of the pipe which is buried in the embankment slope; D)
Sectional view from Coulombe, (2011), showing 1) buried pipe section parallel to the road, 2) air inlet pipe, and 3) air outlet pipe. ... 74 Figure 65 : Cleared section a few days after snow clearing was performed (Reimchen et al.
2009). ... 75 Figure 66 : Evolution of the vegetative cover on the west embankment slope from 2008 to
2011. ... 76 Figure 67 : A) Application of the light colored BST in 2008 (Reimchen et al. 2009); B)
Bituminous surface treatment after its first year of installation (July 2009); C) Color difference between standard BST and light-colored BST (2009). ... 77 Figure 68 : Schematic of a borehole (YHPW). ... 80 Figure 69 : A) Data acquisition system including the meteorological station; B) The loggers
used are Campbell Scientific CR1000. ... 80 Figure 70 : Daily mean air temperature (°C) recorded from November 2008 to December
2011 at the weather station at section 11 of the Beaver Creek experimental test site. 81 Figure 71 : Lateral sides of the snow/sun shed completely blocked by snow (March 29,
2011). ... 86 Figure 72 : Extension to mid-slope of plowed snow cover. Section 8: heat drains on side
slopes with insulation (March 29, 2011). ... 86 Figure 73 : Wind speed and direction in 2010. ... 87 Figure 74 : Wind speed and direction in 2011. ... 88 Figure 75 : Wind speed and direction in winter 2009/10 (Wind data from October 2009 to
March 2010). ... 88 Figure 76 : Wind speed and direction in summer 2010 (Wind data from April 2010 to
September 2010). ... 89 Figure 77 : Water ponding along the longitudinal culvert and snow/sun sheds sections in
May 2012. ... 90 Figure 78 : Surface profiler used for the survey ... 91 Figure 79 : Settlement near the control section in July 2010 (west side). The white dotted
lines show the location of the 2 longitudinal profiles conducted in July 2010, while the orange dotted line shows the location of one of the perpendicular profiles. ... 92 Figure 80 : Example of the reference depths used. ... 95 Figure 81 : Thermal regime in the side slope of the control section obtained by kriging
interpolation. ... 98 Figure 82: Mean daily temperature at 0, -1 and -2 m depth in the natural ground underneath the control section side slope. ... 100 Figure 83: Thaw front and active layer thickness evolution in the control section slope from 2009 to 2011. ... 100 Figure 84 : Mean daily ground temperature recorded by every thermistor between 2009 and 2011 at the embankment toe of the control section. ... 101 Figure 85: Thaw front and active layer thickness evolution at the embankment toe of the
xxi Figure 86: Thermal regime obtained by kriging interpolation under the road centerline of
the control section. ... 103 Figure 87: Thaw front and active layer thickness evolution under the control section
centerline from 2009 to 2011. ... 104 Figure 88: Thermal regime obtained by kriging interpolation of the ACE full embankment
in the embankment side slope. ... 105 Figure 89: Thaw front and active layer thickness evolution in the side slope of the ACE full embankment from 2009 to 2011. ... 106 Figure 90: Thaw front and active layer thickness evolution in the embankment toe of the
ACE full embankment between 2009 and 2011. ... 107 Figure 91: Thaw front and active layer thickness evolution under the centerline of the ACE full embankment from 2009 to 2011. ... 108 Figure 92: Thermal regime obtained by kriging interpolation for the side slope of the ACE
slopes covered. ... 109 Figure 93: Thaw front and active layer thickness evolution between 2009 and 2011 in the
side slope of the ACE slopes covered. ... 109 Figure 94: Thermal regime under the road centerline of the ACE slopes covered obtained
by kriging interpolation. ... 110 Figure 95: Thaw front and active layer thickness evolution between 2009 and 2011 under
the centerline of the ACE slopes covered. ... 111 Figure 96: Thermal regime obtained by kriging interpolation in the side slope of the ACE
slopes uncovered. ... 112 Figure 97: Thaw front and active layer thickness evolution between 2009 and 2011 in the
side slope of the ACE slopes uncovered. ... 112 Figure 98: Mean daily temperature at 0, -1 and -2 m depth under the road centerline of the
ACE slopes uncovered. ... 113 Figure 99: Mean daily temperatures of the ACE sections compared with the control section in the road side slope March 15, 2011. ... 114 Figure 100: Mean daily temperatures of the ACE sections compared with the control
section in the road side slope September 15, 2011. ... 115 Figure 101: Mean daily temperatures of the ACE sections compared with the control
section in the middle of the road March 15, 2011. ... 116 Figure 102: Mean daily temperatures of the ACE sections compared with the control
section in the middle of the road on September 15, 2011. ... 117 Figure 103: Thermal regime obtained by kriging interpolation in the side slope of the heat
drain full embankment. ... 118 Figure 104: Thaw front and active layer thickness evolution between 2009 and 2011 in the
side slope of the heat drain full embankment. ... 119 Figure 105: Mean daily temperature at 0, -1 and -2 m depth under the slope of the heat
drain full embankment. ... 119 Figure 106: Thaw front and active layer thickness evolution between 2009 and 2011 under
the embankment toe of the heat drain on full embankment. ... 120 Figure 107: Comparison between the thermal regimes at the embankment toe of the heat
drain on full embankment, the control section and the ACE on full embankment (March 15, 2010). ... 121
xxii
Figure 108: Comparison between the thermal regimes at the embankment toe of the heat drain on full embankment, the control section and the ACE on full embankment (September 15, 2010). ... 121 Figure 109: Thermal regime obtained by kriging interpolation underneath the road
centerline of the heat drain full embankment. ... 122 Figure 110: Thaw front and active layer thickness evolution from 2009 to 2011 underneath
the road centerline of the heat drain on full embankment. ... 123 Figure 111: Thermal regime obtained by kriging interpolation in the slope of the heat drain
on side slope. ... 124 Figure 112: Thaw front and active layer thickness evolution from 2009 to 2011 in the slope of the heat drain on side slopes. ... 125 Figure 113: Mean daily temperature at 0, -1 and -2 m depth under the slope of the heat
drain on side slopes. ... 125 Figure 114: Thermal regime obtained by kriging interpolation in the road center of the heat drain on side slopes. ... 126 Figure 115: Thaw front evolution from 2009 to 2011 in the road center of the heat drain on
side slopes. ... 127 Figure 116: Mean daily temperature at 0 m, -1 m and -2 m depth in the natural ground
below the road center of the heat drain on side slopes. ... 128 Figure 117: Thermal regime obtained by kriging interpolation in the slope of the heat drain
with insulation. ... 129 Figure 118: Thaw front and active layer thickness evolution from 2009 to 2011 in the slope of the heat drain with insulation. ... 130 Figure 119: Mean daily temperature at 0 m, -1 m and -2 m depth in the natural ground
below the slope of the heat drain with insulation. ... 130 Figure 120: General set up of the smoke bomb test. The yellow smoke bomb was place in
the lower chimney at the toe of the embankment (left). Once the bomb was lit, a cover was place on the top and a vacuum was used to push the smoke through the ventilation system (right). ... 131 Figure 121: Larger view of the test. The smoke bombs were induced in the lower chimney
on the right. No smoke was observed at the outlets of the upper chimneys during the test. ... 132 Figure 122: The heat drain geocomposite was installed upside down during the construction
of the test site in 2008. ... 132 Figure 123: Thermal regime obtained by kriging interpolation in the side slope of the
snow/sun shed. ... 133 Figure 124: Mean daily ground temperature before and after the shed construction in
October 2009 at 0 m, -1 m and -2 m depth in the natural ground below the
embankment slope. ... 134 Figure 125: Thaw front and active layer thickness evolution from 2009 to 2011 in the side
slope of the snow/sun shed. ... 135 Figure 126: 2009, 2010 and 2011 trumpet curves (snow/sun shed). ... 135 Figure 127: Thermal regime obtained by kriging interpolation in the side slope of the
longitudinal culvert section. ... 136 Figure 128: Mean daily ground temperature at 0 m, -1 m and - 2 m depth in the natural
xxiii Figure 129: Temperature profiles from 2009 to 2011, measured on March 1, in the side
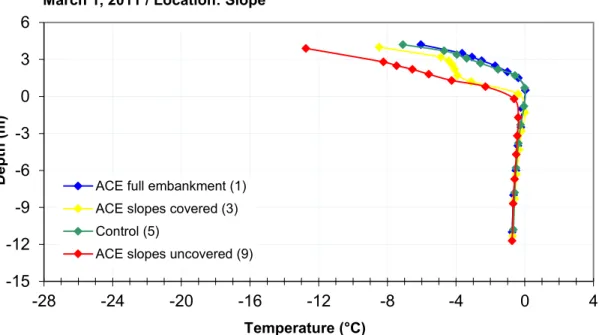
slope of the longitudinal culvert section. ... 138 Figure 130: The longitudinal culvert thermal profile in the side slope compared with the
control section on March 1, 2011. ... 138 Figure 131: The longitudinal culvert thermal profile in the side slope compared with the
control section on September 1, 2011. ... 139 Figure 132: Thaw front and active layer thickness evolution between 2009 and 2011 in the
side slope of the longitudinal culvert section. ... 139 Figure 133: Thermal regime obtained by kriging interpolation in the side slope of the snow
clearing section. ... 140 Figure 134: The snow clearing section thermal profile in the side slope compared with the
control section on March 15,2011. ... 141 Figure 135: The snow clearing thermal profile in the side slope compared with the control
section on May 1, 2011. ... 142 Figure 136 : A) Section 10, showing the embankment cleared of snow at the end of March
2011; B) Close-up on the 2 m thick snow bank located down the embankment slope from the cleared section. ... 142 Figure 137: Thaw front and active layer thickness evolution between 2009 and 2011 in the
side slope of the snow clearing section. ... 143 Figure 138: Mean daily temperature at 0 m, -1 m and -2 m depth in the natural ground of
the snow clearing section. ... 143 Figure 139: Thermal regime obtained by kriging interpolation in the side slope of the grass-covered embankment. ... 144 Figure 140: Thaw front and active layer thickness evolution between 2009 and 2011 in the
side slope of the grass-covered embankment. ... 145 Figure 141: Thermal profile in the side slope of the grass-covered embankment compared
with the control section on March 15, 2011. ... 146 Figure 142: Thermal profile in the side slope of the grass-covered embankment compared
with the control section on September 15, 2011. ... 146 Figure 143: Thermal regime obtained by kriging interpolation in the side slope of the light
colored BST test section. ... 147 Figure 144: Thaw front evolution between 2009 and 2011 in the side slope of the light
colored BST section. ... 148 Figure 145: Thermal profile in the side slope of the light-colored BST section compared
with the control section on March 15, 2011. ... 149 Figure 146: Thermal regime obtained by kriging interpolation in the centerline of the
light-colored aggregates BST section. ... 150 Figure 147: Thermal profile under the centreline of the light-colored aggregate BST
compared with the control section on March 1, 2011. ... 151 Figure 148: Thermal profile under the centreline of the light-colored aggregate BST
compared with the control section August 1, 2011. ... 151 Figure 149: Infrared image comparing dark (left-hand side of images) and light-coloured
bituminous surface treatment (right-hand side of images). ... 152 Figure 150: Thaw front and active layer thickness evolution between 2009 and 2011 under
xxiv
Figure 151: Evolution of the bi-monthly thermal gradients between 0 and -2 m depth in the natural ground for the ACE test sections and the control section (location:
embankment side slope). ... 158 Figure 152: Evolution of the bi-monthly thermal gradients between 0 and -2 m depth in the
ground for the HD test sections and the control section (location: embankment side slope). ... 159 Figure 153: Evolution of the bi-monthly thermal gradients between 0 and -2 m depth in the
natural ground for the longitudinal culvert section, the snow/sun shed, the snow clearing technique and the control section (location: embankment side slope). ... 160 Figure 154: Evolution of the bi-monthly thermal gradients between 0 and -2 m depth in the
natural ground for the ACE full embankment, the ACE slopes uncovered, the light colored aggregates BST, the HD on side slopes and the control section (location: embankment middle). ... 161 Figure 155: Evolution of the bi-monthly thermal gradients between 0 and -2 m depth in the natural ground for the ACE slopes uncovered (location: embankment centre and side slope). ... 162 Figure 156: Schematic of a trumpet curve showing the zone where heat extraction and
induction indices were calculated. ... 163 Figure 157: Heat balance (KJ/m2) in the embankment slopes from 2009 to 2011. ... 166 Figure 158: Heat balance (KJ/m2) under the road centreline between 2009 and 2011. ... 168 Figure 159: 2011 annual temperature envelopes for the HD on side slopes (location:
embankment side slope). ... 169 Figure 160 : Economic analysis of the Beaver Creek test sections based on their cost of
construction, design and maintenance as well as their cooling effectiveness. ... 173 Figure 161: A) Damage to the outlet pipes of the ACE slopes covered (section 3) caused by the winter maintenance operations; B) Snow blockage in the ventilation system of the ACE slopes covered. ... 178 Figure 162: West slope of the ACE uncovered in March, 2011, covered with gravel and
sand as a result of snow removal and maintenance. ... 180 Figure 163 : Schematic of talik development underneath the embankment side slopes
leading to settlements on the road surface. ... 189 Figure 164 : Annual mean air temperature at the Beaver Creek A climatic station
(Environment Canada, 2011). ... 191 Figure 165 : Analysis of the changes in climate on a seasonal basis with the temperature
data from the Beaver Creek A climatic station (Environment Canada, 2011). ... 192 Figure 166 : Average Monthly Temperature for Beaver Creek, Yukon for 4 time periods
compared with the baseline climate normal values for 1961-1991 (Environment Canada, 2013). Historical PRISM and 5-Model Projected Average, Mid-Range
Emissions (A1B) (SNAP, 2012). ... 194 Figure 167 : In the Yukon, the Alaska Highway was closed because due to washouts at
Canyon Creek km 1103 close to Teslin (fig. x A) and between Haines Junction and Destruction Bay from km 1641.5 to 1641.8 (Photos YHPW, June 8th 2012). ... 198 Figure A.1: Map of the permafrost zones in Canada (source: NRCAN derived from
Heginbottom et al. 1995; Furgal et al. 2003). ... 216 Figure A.2: Temperature profile in permafrost (Andersland and Ladanyi, 2004). ... 218
xxv Figure A.3: Contact between the active layer and permafrost. (Picture taken by Eva
Stephani in Mare-Sale, Russia, 2012). ... 218 Figure A.4: Conceptualized latitudinal distribution of permafrost characteristics in
northwestern Canada (Hegginbottom et al. 2012). ... 219 Figure A.5: Illustrations of eight types of ice in permafrost cores (provided by M.T.
Jorgenson, ABR, Inc., Fairbanks, Alaska in Heginbottom et al. 2012). ... 221 Figure A.6: Schematic representation of ice wedge evolution according to thermal
contraction theory (adapted from Lachenbruch (1963) in Andersland and Ladanyi (2004)). ... 223 Figure A.7: A) Example of an ice wedge observed by Yukon Highways and Public Works
under the Alaska Highway between Beaver Creek and the US border; B) Ice-wedge polygons observed in Siberia. ... 223 Figure A.8: Massive ice beds observed near Tuktoyaktuq (Burn, 2011). ... 224 Figure A.9: Shear failure in soils due to permafrost degradation at km 1892 on the Alaska
Highway, Yukon (photo: YHPW). ... 225 Figure A.10: Volume change after thawing of a permafrost sample (Stephani, 2008). ... 227 Figure A.11: Mechanical properties of a ground in thawing process (Doré, 2011b). ... 227 Figure A.12: Representative values for the temperature dependence of unfrozen water
contents in sand, silt and clay (Osterkamp and Burn, 2003). ... 229 Figure A.13: Basic creep behavior, showing a) creep curve variations (deformation versus
time) and b) creep rate versus time for each variation (adapted from Jonhston et al. 1981). ... 230 Figure A.14: Thaw settlement expressed in function of void ratio e and pressure σ (adapted from Andersland and Ladanyi, 2004). ... 234 Figure B.1 : Mean daily ground temperature recorded by every thermistor between 2009
and 2011 at the embankment toe of the ACE full embankment. ... 247 Figure B.2 : Mean daily ground temperature recorded by every thermistor between 2009
and 2011 at the embankment side slope of the ACE full embankment. ... 247 Figure B.3 : Mean daily ground temperature recorded by every thermistor between 2009
and 2011 at the embankment center of the ACE full embankment. ... 248 Figure B.4 : Mean daily ground temperature recorded by every thermistor between 2009
and 2011 at the embankment toe of the HD full embankment. ... 248 Figure B.5 : Mean daily ground temperature recorded by every thermistor between 2009
and 2011 at the embankment side slope of the HD full embankment. ... 249 Figure B.6 : Mean daily ground temperature recorded by every thermistor between 2009
and 2011 at the embankment center of the HD full embankment. ... 249 Figure B.7 : Mean daily ground temperature recorded by every thermistor between 2009
and 2011 at the embankment side slope of the ACE slopes covered. ... 250 Figure B.8 : Mean daily ground temperature recorded by every thermistor between 2009
and 2011 at the embankment center of the ACE slopes covered. ... 250 Figure B.9 : Mean daily ground temperature recorded by every thermistor between 2009
and 2011 at the embankment side slope of the HD on side slopes. ... 251 Figure B.10 : Mean daily ground temperature recorded by every thermistor between 2009
and 2011 at the embankment center of the HD on side slopes. ... 251 Figure B.11 : Mean daily ground temperature recorded by every thermistor between 2009
xxvi
Figure B.12 : Mean daily ground temperature recorded by every thermistor between 2009 and 2011 at the embankment side slope of the control section. ... 252 Figure B.13 : Mean daily ground temperature recorded by every thermistor between 2009
and 2011 at the embankment center of the control section. ... 253 Figure B.14 : Mean daily ground temperature recorded by every thermistor between 2009
and 2011 at the embankment side slope of the snow/sun shed. ... 253 Figure B.15 : Mean daily ground temperature recorded by every thermistor between 2009
and 2011 at the embankment side slope of the longitudinal culvert. ... 254 Figure B.16 : Mean daily ground temperature recorded by every thermistor between 2009
and 2011 at the embankment side slope of the HD with insulation. ... 254 Figure B.17 : Mean daily ground temperature recorded by every thermistor between 2009
and 2011 at the embankment side slope of the ACE slopes uncovered. ... 255 Figure B.18 : Mean daily ground temperature recorded by every thermistor between 2009
and 2011 at the embankment center of the ACE slopes uncovered. ... 255 Figure B.19 : Mean daily ground temperature recorded by every thermistor between 2009
and 2011 at the embankment side slope of the snow clearing technique. ... 256 Figure B.20 : Mean daily ground temperature recorded by every thermistor between 2009
and 2011 at the embankment side slope of the grass-covered embankment. ... 256 Figure B.21 : Mean daily ground temperature recorded by every thermistor between 2009
and 2011 at the embankment side slope of the light colored BST. ... 257 Figure B.22 : Mean daily ground temperature recorded by every thermistor between 2009
and 2011 at the embankment center of the light colored BST. ... 257 Figure B.23 : 2009, 2010, 2011 trumpet curves at the embankment side slope of the ACE
full embankment. ... 258 Figure B.24 : 2009, 2010, 2011 trumpet curves at the embankment center of the ACE full
embankment. Warm temperatures at -4 m depth were recorded in late April or early May. ... 258 Figure B.25 : 2009, 2010, 2011 trumpet curves at the embankment side slope of the HD full
embankment. ... 259 Figure B.26 : 2009, 2010, 2011 trumpet curves at the embankment center of the HD full
embankment. ... 259 Figure B.27 : 2009, 2010, 2011 trumpet curves at the embankment side slope of the ACE
slopes covered. ... 260 Figure B.28 : 2009, 2010, 2011 trumpet curves at the embankment center of the ACE
slopes covered. ... 260 Figure B.29 : 2009, 2010, 2011 trumpet curves at the embankment side slope of the HD on
side slopes. ... 261 Figure B.30 : 2009, 2010, 2011 trumpet curves at the embankment center of the HD on side
slopes. ... 261 Figure B.31 : 2009, 2010, 2011 trumpet curves at the embankment side slope of the control section. ... 262 Figure B.32 : 2009, 2010, 2011 trumpet curves at the embankment center of the control
section. ... 262 Figure B.33 : 2009, 2010, 2011 trumpet curves at the embankment side slope of the
snow/sun shed. ... 263 Figure B.34 : 2009, 2010, 2011 trumpet curves at the embankment side slope of the
xxvii Figure B.35 : 2009, 2010, 2011 trumpet curves at the embankment side slope of the HD
with insulation. ... 264 Figure B.36 : 2009, 2010, 2011 trumpet curves at the embankment side slope of the snow
clearing technique. ... 264 Figure B.37 : 2009, 2010, 2011 trumpet curves at the embankment side slope of the ACE
slopes uncovered. ... 265 Figure B.38 : 2009, 2010, 2011 trumpet curves at the embankment center of the ACE
slopes uncovered. ... 265 Figure B.39 : 2009, 2010, 2011 trumpet curves at the embankment side slope of the light
colored BST. ... 266 Figure B.40 : 2009, 2010, 2011 trumpet curves at the embankment center of the light
colored BST. ... 266 Figure B.41 : 2009, 2010, 2011 trumpet curves at the embankment side slope of the
grass-covered embankment. ... 267 Figure B.42 : Mean daily temperature at 0, -1 and -2 m depth under the road side slope of
the ACE full embankment. ... 268 Figure B.43 : Mean daily temperature at 0, -1 and -2 m depth under the road centerline of
the ACE full embankment. ... 268 Figure B.44 : Mean daily temperature at 0, -1 and -2 m depth under the road side slope of
the HD full embankment. ... 269 Figure B.45 : Mean daily temperature at 0, -1 and -2 m depth under the road centerline of
the HD full embankment. ... 269 Figure B.46 : Mean daily temperature at 0, -1 and -2 m depth under the road side slope of
the ACE slopes covered. ... 270 Figure B.47 : Mean daily temperature at 0, -1 and -2 m depth under the road centerline of
the ACE slopes covered. ... 270 Figure B.48 : Mean daily temperature at 0, -1 and -2 m depth under the road side slope of
the HD on side slopes. ... 271 Figure B.49 : Mean daily temperature at 0, -1 and -2 m depth under the road centerline of
the HD on side slopes. ... 271 Figure B.50 : Mean daily temperature at 0, -1 and -2 m depth under the road side slope of
the control section. ... 272 Figure B.51 : Mean daily temperature at 0, -1 and -2 m depth under the road centerline of
the control section. ... 272 Figure B.52 : Mean daily temperature at 0, -1 and -2 m depth under the road side slope of
the snow/sun shed. ... 273 Figure B.53 : Mean daily temperature at 0, -1 and -2 m depth under the road side slope of
the longitudinal culvert. ... 273 Figure B.54 : Mean daily temperature at 0, -1 and -2 m depth under the road side slope of
the HD with insulation. ... 274 Figure B.55 : Mean daily temperature at 0, -1 and -2 m depth under the road side slope of
the snow clearing technique. ... 274 Figure B.56 : Mean daily temperature at 0, -1 and -2 m depth under the road side slope of
the ACE slopes uncovered. ... 275 Figure B.57 : Mean daily temperature at 0, -1 and -2 m depth under the road centerline of
xxviii
Figure B.58 : Mean daily temperature at 0, -1 and -2 m depth under the road side slope of the light colored aggregate BST. ... 276 Figure B.59 : Mean daily temperature at 0, -1 and -2 m depth under the road centerline of
the light colored aggregate BST. ... 276 Figure B.60 : October 15, 2008. ... 277 Figure B.61 : November 1, 2008 ... 277 Figure B.62 : November 15, 2008 ... 278 Figure B.63 : December 1, 2008 ... 278 Figure B.64 : December 15, 2008 ... 279 Figure B.65 : January 1, 2009 ... 279 Figure B.66 : January 15, 2009 ... 280 Figure B.67 : February 1, 2009 ... 280 Figure B.68 : February 15, 2009 ... 281 Figure B.69 : February 15, 2009 ... 281 Figure B. 70 : (March 15, 2009 ... 282 Figure B.71 : April 1, 2009 ... 282 Figure B.72 : April 15, 2009 ... 283 Figure B.73 : May 1, 2009 ... 283 Figure B.74 : May 15, 2009 ... 284 Figure B.75 : June 1, 2009 ... 284 Figure B.76: 15, 2009 ... 285 Figure B.77 : June 1, 2009 ... 285 Figure B.78 : June 15, 2009 ... 286 Figure B.79 : August 1, 2009 ... 286 Figure B.80 : August 15, 2009 ... 287 Figure B.81 : September 1, 2009 ... 287 Figure B.82 : September 15, 2009 ... 288 Figure B.83 : October 1, 2009 ... 288 Figure B.84 : October 15, 2009 ... 289 Figure B.85 : November 1, 2009 ... 289 Figure B.86 : November 15, 2009 ... 290 Figure B.87 : December 1, 2009 ... 290 Figure B.88 : December 15, 2009 ... 291 Figure B.89 : January 1, 2010 ... 291 Figure B.90 : January 15, 2010 ... 292 Figure B.91 : February 1, 2010 ... 292 Figure B.92 : February 15, 2010 ... 293 Figure B.93 : March 1, 2010 ... 293 Figure B.94 : March 15, 2010 ... 294 Figure B.95 : April 1, 2010 ... 294 Figure B.96 : April 15, 2010 ... 295 Figure B.97 : May 1, 2010 ... 295 Figure B.98 : May 15, 2010 ... 296 Figure B.99 : June 1, 2010 ... 296 Figure B.100 : June 15, 2010 ... 297 Figure B.101 : July 1, 2010 ... 297 Figure B.102 : July 15, 2010 ... 298
xxix Figure B.103 : August 1, 2010 ... 298 Figure B.104 : August 15, 2010 ... 299 Figure B.105 : September 1, 2010 ... 299 Figure B.106 : September 15, 2010 ... 300 Figure B.107 : October 1, 2010 ... 300 Figure B.108 : October 15, 2010 ... 301 Figure B.109 : November 1, 2010 ... 301 Figure B.110 : November 15, 2010 ... 302 Figure B.111 : December 1, 2010 ... 302 Figure B.112 : December 15, 2010 ... 303 Figure B.113 : January 1, 2011 ... 303 Figure B.114 : January 15, 2011 ... 304 Figure B.115 : February 1, 2011 ... 304 Figure B.116 : February 15, 2011 ... 305 Figure B. 117 : March 1, 2011 ... 305 Figure B.118 : March 15, 2011 ... 306 Figure B.119 : April 1, 2011 ... 306 Figure B.120 : April 15, 2011 ... 307 Figure B.121 : May 1, 2011 ... 307 Figure B.122 : May 15, 2011 ... 308 Figure B.123 : June 1, 2011 ... 308 Figure B.124 : June 15, 2011 ... 309 Figure B.125 : July 1, 2011 ... 309 Figure B.126 : July 15, 2011 ... 310 Figure B.127 : August 1, 2011 ... 310 Figure B.128 : August 15, 2011 ... 311 Figure B.129 : September 1, 2011 ... 311 Figure B.130 : September 15, 2011 ... 312 Figure B.131 : October 1, 2011 ... 312 Figure B.132 : October 15, 2011 ... 313 Figure B.133 : November 1, 2011 ... 313 Figure B.134 : November 15, 2011 ... 314 Figure B.135 : December 1, 2011 ... 314 Figure B.136 : December 15, 2011 ... 315 Figure B.137 : December 31, 2011 ... 315 Figure B.138 : October 15, 2008 ... 316 Figure B.139 : November 1, 2008 ... 316 Figure B.140 : November 15, 2008 ... 317 Figure B.141 : December 1, 2008 ... 317 Figure B.142 : December 15, 2008 ... 318 Figure B.143 : January 1, 2009 ... 318 Figure B.144 : January 15, 2009 ... 319 Figure B.145 : February 1, 2009 ... 319 Figure B.146 : February 15, 2009 ... 320 Figure B.147 : March 1, 2009 ... 320 Figure B.148 : March 15, 2009 ... 321 Figure B.149 : April 1, 2009 ... 321
xxx Figure B.150 : April 15, 2009 ... 322 Figure B.151 : May 1, 2009 ... 322 Figure B.152 : May 15, 2009 ... 323 Figure B.153 : June 1, 2009 ... 323 Figure B.154 : June 15, 2009 ... 324 Figure B.155 : July 1, 2009 ... 324 Figure B.156 : July 15, 2009 ... 325 Figure B.157 : August 1, 2009 ... 325 Figure B.158 : August 15, 2009 ... 326 Figure B.159 : September 1, 2009 ... 326 Figure B.160 : September 15, 2009 ... 327 Figure B.161 : October 1, 2009 ... 327 Figure B.162 : October 15, 2009 ... 328 Figure B.163 : November 1, 2009 ... 328 Figure B.164 : November 15, 2009 ... 329 Figure B.165 : December 1, 2009 ... 329 Figure B.166 : December 15, 2009 ... 330 Figure B.167 : January 1, 2010 ... 330 Figure B.168 : January 15, 2010 ... 331 Figure B. 169 : February 1, 2010 ... 331 Figure B.170 : February 15, 2010 ... 332 Figure B.171 : March 1, 2010 ... 332 Figure B.172 : March 15, 2010 ... 333 Figure B.173 : April 1, 2010 ... 333 Figure B.174 : April 15, 2010 ... 334 Figure B.175 : May 1, 2010 ... 334 Figure B.176 : May 15, 2010 ... 335 Figure B.177 : June 1, 2010 ... 335 Figure B.178 : June 15, 2010 ... 336 Figure B.179 : July 1, 2010 ... 336 Figure B.180 : July 15, 2010 ... 337 Figure B.181 : August 1, 2010 ... 337 Figure B.182 : August 15, 2010 ... 338 Figure B.183 : September 1, 2010 ... 338 Figure B.184 : September 15, 2010 ... 339 Figure B.185 : October 1, 2010 ... 339 Figure B.186 : October 15, 2010 ... 340 Figure B.187 : November 1, 2010 ... 340 Figure B.188 : November 15, 2010 ... 341 Figure B.189 : December 1, 2010 ... 341 Figure B.190 : December 15, 2010 ... 342 Figure B.191 : January 1, 2011 ... 342 Figure B.192 : January 15, 2011 ... 343 Figure B.193 : February 1, 2011 ... 343 Figure B.194 : February 15, 2011 ... 344 Figure B.195 : March 1, 2011 ... 344 Figure B.196 : March 15, 2011 ... 345
xxxi Figure B.197 : April 1, 2011 ... 345 Figure B.198 : April 15, 2011 ... 346 Figure B.199 : May 1, 2011 ... 346 Figure B.200 : May 15, 2011 ... 347 Figure B.201 : July 1, 2011 ... 347 Figure B.202 : July 15, 2011 ... 348 Figure B.203 : July 1, 2011 ... 348 Figure B.204 : July 15, 2011 ... 349 Figure B.205 : August 1, 2011 ... 349 Figure B.206 : August 15, 2011 ... 350 Figure B.207 : September 1, 2011 ... 350 Figure B.208 : September 15, 2011 ... 351 Figure B.209 : October 1, 2011 ... 351 Figure B.210 : October 15, 2011 ... 352 Figure B.211 : November 1, 2011 ... 352 Figure B.212 : November 15, 2011 ... 353 Figure B.213 : December 1, 2011 ... 353 Figure B.214 : December 15, 2011 ... 354 Figure B. 215 : December 31, 2011 ... 354 Figure B.216 : October 15, 2008 ... 355 Figure B.217 : November 1, 2008 ... 355 Figure B.218 : November 15, 2008 ... 356 Figure B.219 : December 1, 2008 ... 356 Figure B.220 : December 15, 2008 ... 357 Figure B.221 : January 1, 2009 ... 357 Figure B.222 : January 15, 2009 ... 358 Figure B.223 : February 1, 2009 ... 358 Figure B.224 : February 15, 2009 ... 359 Figure B.225 : March 1, 2009 ... 359 Figure B.226 : March 15, 2009 ... 360 Figure B.227 : April 1, 2009 ... 360 Figure B.228 : April 15, 2009 ... 361 Figure B.229 : May 1, 2009 ... 361 Figure B.230 : May 15, 2009 ... 362 Figure B.231 : June 1, 2009 ... 362 Figure B.232 : June 15, 2009 ... 363 Figure B.233 : July 1, 2009 ... 363 Figure B.234 : July 15, 2009 ... 364 Figure B.235 : August 1, 2009 ... 364 Figure B.236 : August 15, 2009 ... 365 Figure B.237 : September 1, 2009 ... 365 Figure B.238 : September 15, 2009 ... 366 Figure B.239 : October 1, 2009 ... 366 Figure B.240 : October 15, 2009 ... 367 Figure B.241 : November 1, 2009 ... 367 Figure B.242 : November 15, 2009 ... 368 Figure B.243 : December 1, 2009 ... 368
xxxii Figure B.244 : December 15, 2009 ... 369 Figure B.245 : January 1, 2010 ... 369 Figure B.246 : January 15, 2010 ... 370 Figure B.247 : February 1, 2010 ... 370 Figure B.248 : February 15, 2010 ... 371 Figure B.249 : March 1, 2010 ... 371 Figure B.250 : March 15, 2010 ... 372 Figure B.251 : April 1, 2010 ... 372 Figure B.252 : April 15, 2010 ... 373 Figure B.253 : May 1, 2010 ... 373 Figure B.254 : May 15, 2010 ... 374 Figure B.255 : June 1, 2010 ... 374 Figure B.256 : June 15, 2010 ... 375 Figure B.257 : July 1, 2010 ... 375 Figure B.258 : July 15, 2010 ... 376 Figure B.259 : August 1, 2010 ... 376 Figure B.260 : August 15, 2010 ... 377 Figure B.261 : September 1, 2010 ... 377 Figure B.262 : September 15, 2010 ... 378 Figure B.263 : October 1, 2010 ... 378 Figure B.264 : October 15, 2010 ... 379 Figure B.265 : November 1, 2010 ... 379 Figure B.266 : November 15, 2010 ... 380 Figure B.267 : December 1, 2010 ... 380 Figure B.268 : December 15, 2010 ... 381 Figure B.269 : January 1, 2011 ... 381 Figure B.270 : January 15, 2011 ... 382 Figure B.271 : February 1, 2011 ... 382 Figure B.272 : February 15, 2011 ... 383 Figure B.273 : March 1, 2011 ... 383 Figure B.274 : March 15, 2011 ... 384 Figure B.275 : April 1, 2011 ... 384 Figure B.276 : April 15, 2011 ... 385 Figure B.277 : May 1, 2011 ... 385 Figure B.278 : May 15, 2011 ... 386 Figure B.279 : June 1, 2011 ... 386 Figure B.280 : June 15, 2011 ... 387 Figure B.281 : July 1, 2011 ... 387 Figure B.282 : July 15, 2011 ... 388 Figure B.283 : August 1, 2011 ... 388 Figure B.284 : August 15, 2011 ... 389 Figure B.285 : September 1, 2011 ... 389 Figure B.286 : September 15, 2011 ... 390 Figure B.287 : October 1, 2011 ... 390 Figure B.288 : October 15, 2011 ... 391 Figure B.289 : November 1, 2011 ... 391 Figure B.290 : November 15, 2011 ... 392
xxxiii Figure B.291 : December 1, 2011 ... 392 Figure B.292 : December 15, 2011 ... 393 Figure B.293 : December 31, 2011 ... 393 Figure B.294 : October 15, 2008.. ... 394 Figure B.295 : November 1, 2008 ... 394 Figure B.296 : November 15, 2008 ... 395 Figure B.297 : December 1, 2008 ... 395 Figure B.298 : December 15, 2008 ... 396 Figure B.299 : January 1, 2009 ... 396 Figure B.300 : January 15, 2009 ... 397 Figure B.301 : February 1, 2009 ... 397 Figure B.302 : February 15, 2009 ... 398 Figure B.303 : March 1, 2009 ... 398 Figure B.304 : March 15, 2009 ... 399 Figure B.305 : April 1, 2009 ... 399 Figure B.306 : April 15, 2009 ... 400 Figure B.307 : May 1, 2009 ... 400 Figure B.308 : May 15, 2009 ... 401 Figure B.309 : June 1, 2009 ... 401 Figure B.310 : June 15, 2009 ... 402 Figure B.311 : July 1, 2009 ... 402 Figure B.312 : July 15, 2009 ... 403 Figure B.313 : August 1, 2009 ... 403 Figure B.314 : August 15, 2009 ... 404 Figure B.315 : September 1, 2009 ... 404 Figure B.316 : September 15, 2009 ... 405 Figure B.317 : October 1, 2009 ... 405 Figure B.318 : October 15, 2009 ... 406 Figure B.319 : November 1, 2009 ... 406 Figure B.320 : November 15, 2009 ... 407 Figure B.321 : December 1, 2009 ... 407 Figure B.322 : December 15, 2009 ... 408 Figure B.323 : January 1, 2010 ... 408 Figure B.324 : January 15, 2010 ... 409 Figure B.325 : February 1, 2010 ... 409 Figure B.326 : February 15, 2010 ... 410 Figure B.327 : March 1, 2010 ... 410 Figure B.328 : March 15, 2010 ... 411 Figure B.329 : April 1, 2010 ... 411 Figure B.330 : April 15, 2010 ... 412 Figure B.331 : May 1, 2010 ... 412 Figure B.332 : May 15, 2010 ... 413 Figure B.333 : June 1, 2010 ... 413 Figure B.334 : June 15, 2010 ... 414 Figure B.335 : July 1, 2010 ... 414 Figure B.336 : July 15, 2010 ... 415 Figure B.337 : August 1, 2010 ... 415
xxxiv Figure B.338 : August 15, 2010 ... 416 Figure B.339 : September 1, 2010 ... 416 Figure B.340 : September 15, 2010 ... 417 Figure B.341 : October 1, 2010 ... 417 Figure B.342 : October 15, 2010 ... 418 Figure B.343 : November 1, 2010 ... 418 Figure B.344 : November 15, 2010 ... 419 Figure B.345 : December 1, 2010 ... 419 Figure B.346 : December 15, 2010 ... 420 Figure B.347 : January 1, 2011 ... 420 Figure B. 348 : January 15, 2011 ... 421 Figure B.349 : February 1, 2011 ... 421 Figure B.350 : February 15, 2011 ... 422 Figure B.351 : March 1, 2011 ... 422 Figure B. 352 : March 15, 2011 ... 423 Figure B. 353 : April 1, 2011 ... 423 Figure B.354 : April 15, 2011 ... 424 Figure B.355 : May 1, 2011 ... 424 Figure B. 356 : May 15, 2011 ... 425 Figure B.357 : June 1, 2011 ... 425 Figure B.358 : June 15, 2011 ... 426 Figure B.359 : July 1, 2011 ... 426 Figure B.360 : July 15, 2011 ... 427 Figure B.361 : August 1, 2011 ... 427 Figure B.362 : August 15, 2011 ... 428 Figure B.363 : September 1, 2011 ... 428 Figure B.364 : September 15, 2011 ... 429 Figure B.365 : October 1, 2011 ... 429 Figure B.366 : October 15, 2011 ... 430 Figure B.367 : November 1, 2011 ... 430 Figure B.368 : November 15, 2011 ... 431 Figure B.369 : December 1, 2011 ... 431 Figure B.370 : December 15, 2011 ... 432 Figure B.371 : December 31, 2011 ... 432 Figure B.372 : October 15, 2008. ... 433 Figure B.373 : November 1, 2008 ... 433 Figure B.374 : November 15, 2008 ... 434 Figure B.375 : December 1, 2008 ... 434 Figure B.376 : December 15, 2008 ... 435 Figure B.377 : January 1, 2009 ... 435 Figure B.378 : January 15, 2009. ... 436 Figure B.379 : February 1, 2009 ... 436 Figure B.380 : February 15, 2009 ... 437 Figure B.381 : March 1, 2009 ... 437 Figure B.382 : March 15, 2009 ... 438 Figure B.383 : April 1, 2009 ... 438 Figure B.384 : April 15, 2009 ... 439
xxxv Figure B.385 : May 1, 2009 ... 439 Figure B.386 : May 15, 2009 ... 440 Figure B.387 : June 1, 2009 ... 440 Figure B.388 : June 15, 2009 ... 441 Figure B.389 : July 1, 2009 ... 441 Figure B.390 : July 15, 2009 ... 442 Figure B.391 : August 1, 2009 ... 442 Figure B.392 : August 15, 2009 ... 443 Figure B.393 : September 1, 2009 ... 443 Figure B.394 : September 15, 2009 ... 444 Figure B.395 : October 1, 2009 ... 444 Figure B.396 : October 15, 2009 ... 445 Figure B.397 : November 1, 2009 ... 445 Figure B.398 : November 15, 2009 ... 446 Figure B.399 : December 1, 2009 ... 446 Figure B.400 : December 15, 2009 ... 447 Figure B.401 : January 1, 2010 ... 447 Figure B.402 : January 15, 2010 ... 448 Figure B.403 : February 1, 2010 ... 448 Figure B.404 : February 15, 2010 ... 449 Figure B.405 : March 1, 2010 ... 449 Figure B.406 : March 15, 2010 ... 450 Figure B.407 : April 1, 2010 ... 450 Figure B.408 : April 15, 2010 ... 451 Figure B.409 : May 1, 2010 ... 451 Figure B.410 : May 15, 2010 ... 452 Figure B.411 : June 1, 2010 ... 452 Figure B.412 : June 15, 2010 ... 453 Figure B.413 : July 1, 2010 ... 453 Figure B.414 : July 15, 2010 ... 454 Figure B.415 : August 1, 2010 ... 454 Figure B.416 : August 15, 2010 ... 455 Figure B.417 : September 1, 2010 ... 455 Figure B.418 : September 15, 2010 ... 456 Figure B.419 : October 1, 2010 ... 456 Figure B.420 : October 15, 2010 ... 457 Figure B.421 : November 1, 2010 ... 457 Figure B.422 : November 15, 2010 ... 458 Figure B.423 : December 1, 2010 ... 458 Figure B.424 : December 15, 2010 ... 459 Figure B.425 : January 1, 2011 ... 459 Figure B.426 : January 15, 2011 ... 460 Figure B.427 : February 1, 2011 ... 460 Figure B.428 : February 15, 2011 ... 461 Figure B.429 : March 1, 2011 ... 461 Figure B.430 : March 15, 2011 ... 462 Figure B.431 : April 1, 2011 ... 462