HAL Id: tel-02951682
https://tel.archives-ouvertes.fr/tel-02951682
Submitted on 28 Sep 2020
HAL is a multi-disciplinary open access
archive for the deposit and dissemination of sci-entific research documents, whether they are pub-lished or not. The documents may come from teaching and research institutions in France or abroad, or from public or private research centers.
L’archive ouverte pluridisciplinaire HAL, est destinée au dépôt et à la diffusion de documents scientifiques de niveau recherche, publiés ou non, émanant des établissements d’enseignement et de recherche français ou étrangers, des laboratoires publics ou privés.
humaines sur le territoire français entre 7000 et 2000
avant le présent
Samantha Brunel
To cite this version:
Samantha Brunel. Paléogénomique des dynamiques des populations humaines sur le territoire français entre 7000 et 2000 avant le présent. Médecine humaine et pathologie. Université Sorbonne Paris Cité, 2018. Français. �NNT : 2018USPCC282�. �tel-02951682�
Thèse de doctorat
de l’Université Sorbonne Paris Cité
Préparée à l’Université Paris Diderot
Ecole doctorale Bio Sorbonne Paris Cité
Equipe Epigénome et Paléogénome UMR 7592 – Institut Jacques Monod
Paleogenomics of human population
dynamics on the French territory between
7000 and 2000 before present
Par Samantha Brunel
Thèse de doctorat de Génétique
Dirigée par Eva-Maria Geigl
Présentée et soutenue publiquement à Paris le 14 novembre 2018
Président du jury : Reiner Veitia Professeur Université Paris Diderot - CNRS
Rapporteurs : Christine Keyser Professeur Université de Strasbourg - CNRS
Wolfgang Haak Docteur Max Planck Institute for the Science of Human History
Examinateurs : Etienne Patin CR HDR Institut Pasteur - CNRS
Directeur de thèse : Eva-Maria Geigl DR HDR Université Paris Diderot - CNRS Co-directeur de
thèse : Thierry Grange DR HDR Université Paris Diderot – CNRS
i
Aknowledgments
Difficile de résumer en quelques mots ces trois années de thèse tant elles furent hétéroclites. Riche de découvertes et de rencontres, mais aussi d’enseignements, cette expérience a été l’aboutissement d’un cursus universitaire orienté vers l’évolution de l’être humain et de son génome, bien qu’elle ne soit pas une fin en soi. Je suis reconnaissante envers mes directeurs de thèse, Eva-Maria Geigl et Thierry Grange, ainsi que Mélanie Pruvost et tous les collaborateurs du projet ANR ANCESTRA, pour avoir rendu ce travail possible.
Mes remerciements vont également :
A chaque membre du jury, et particulièrement à Christine Keyser et Wolfgang Haak, pour avoir accepté d’endosser le rôle de rapporteurs.
A Etienne Patin et Fabien Fauchereau, membres du comité de thèse, pour leur bienveillance et leurs conseils tout au long de ce périple.
Aux anciens du laboratoire Epigénome et Paléogénome : Mélanie Pruvost, les désormais docteurs Diyendo Massilani, Giulia Lizzo, Nathalie Coté et Olivier Gorgé, des présences adorables et des chercheurs talentueux, Silvia Guimaraes et Andrew Bennett. Une pensée également à ceux qui restent, en particulier Wejdene Ben Dhafer, à qui je souhaite force de caractère pour les trois années à venir.
Aux rencontres Monodiennes : Estelle Gauquelin, Joseph d’Alessandro, Alexandros Glentis, Marc-Antoine Fardin, ainsi qu’aux habitués du coin détente du 5ème étage, pour
leur bonne humeur contagieuse, les pauses café salvatrices, les soirées et une certaine virée en Savoie.
ii A Nicolas Coënt, Jean-Baptiste Gelé, Louise Brasseur, Ansgar Bohmann, Simon Bouloy et Maëva Mehaye.
Au binôme d’Apprenties Chercheuses Kimberly Plancy et Maryse Yapo, ainsi qu’à Chaïma Benaksas, pour m’avoir permis de faire ce qui me plaît le plus : partager un peu de connaissances et beaucoup de curiosité.
Aux membres de l’association Science Ouverte de Drancy, en particulier Pauline Drapeau, Julien Rastegar et François Gaudel, pour cette mission formidable qu’est la vôtre. Ces nombreux samedis après-midi de tutorat à vos côtés ont été une bouffée d’air frais, et j’ai pris grand plaisir à participer à vos conférences.
Au professeur François Guérineau de l’Université de Picardie Jules Verne, sans qui mon parcours universitaire aurait probablement été tout autre.
A mes parents pour leur confiance et leur présence discrète mais essentielle ; à mes grands-parents, à qui je dois sans aucun doute la persévérance et la résilience qui m’ont accompagnée durant toute cette entreprise.
iii
Abstract
Paleogenomics of human population dynamics on the French territory between 7000 and 2000 before present.
The last 10,000 years in Western Eurasia were marked by cultural transitions that profoundly transformed human societies: the advent of the Neolithic, the Bronze Age and the Iron Age. Paleogenomics, the analysis of ancient genomes, started to address the underlying demographic processes in various parts of the continent. In France, however, Late Prehistory is only known from the rich archaeological records and not yet explored through genetics at a territory-wide scale. We generated a large dataset comprising the complete mitochondrial genomes, Y chromosome markers and genotypes on a number of nuclear loci of interest obtained through a DNA enrichment approach of 193 Mesolithic, Neolithic, Bronze Age and Iron Age individuals sampled across the territory of present-day France. It was complemented with the low-coverage genomes of 58 individuals partially overlapping this dataset. This panel provides, for the first time, a high-resolution 5,000-year transect of the dynamics of maternal and paternal lineages in France as well as of autosomal genotypes. Both parental lineages and genomic data revealed different dynamics in the North and the South of the French territory during the Neolithic, with varying degrees of incorporation of autochthonous hunter-gatherers lineages into farming communities. They also revealed a mostly male-driven gene flow from individuals deriving part of their ancestry from the Pontic Steppe at the onset of the Bronze Age, a signature that then persisted through the Iron Age. The various nuclear phenotypic markers we studied evolved differently. While some harbor present-day European frequencies already at the Neolithic epoch indicating ancient episodes of positive selection of these specific traits, others show different evolutionary stages throughout the Neolithic and the Bronze Age allowing us the establish more clearly the origin and evolution of the phenotypic traits that characterize the present-day European population. This study further expands our understanding of the relationship between populations during late Prehistory in France and across Europe.
Keywords: ancient DNA, mitochondrial DNA, ancient genomes, Neolithic, Bronze Age,
v
Résumé
Paléogénomique des dynamiques des populations humaines sur le territoire français entre 7000 et 2000 avant le présent.
Ces derniers 10000 ans en Eurasie occidentale ont été marqués par des transitions culturelles qui ont profondément transformé les sociétés humaines : l’apparition et la diffusion du Néolithique, de l’Âge du Bronze et de l’Âge du Fer. La paléogénomique, en analysant les génomes anciens, s’est attelée à en décrire les processus démographiques sous-jacents dans diverses parties du continent. En France cependant, la fin de la Préhistoire est seulement connue par le biais de l’archéologie, et n’a pas encore été explorée par la génétique à l’échelle du territoire. Nous avons produit un large jeu de données comprenant les génomes mitochondriaux, marqueurs du chromosome Y et génotypes d’une sélection de loci nucléaires d’intérêt via une procédure d’enrichissement pour 193 individus datant du Mésolithique, Néolithique, Âge du Bronze et Âge du Fer à travers le territoire de la France actuelle. Nous avons également généré les génomes à faible couverture de 58 individus répartis sur les mêmes périodes et recouvrant partiellement ce panel. L’intégralité de ces résultats offre, pour la première fois, un aperçu des dynamiques des lignées maternelles et paternelles ainsi que du génome nucléaire sur une période recouvrant 5000 ans. Que ce soient les lignées parentales ou le génome, différentes dynamiques apparaissent entre le nord et le sud de la France durant le Néolithique, avec un degré variable d’incorporation des populations de chasseurs-cueilleurs autochtones dans les communautés de fermiers. Ils mettent également en évidence, peu avant le début de l’Âge du Bronze, un flux de gènes dominé par des hommes dont la signature génétique des bergers de la Steppe Pontique, une signature qui ensuite persiste durant l’Âge du Fer, alors que la population montre peu de différentiation à l’échelle du territoire français. Certains marqueurs phénotypiques observés au Néolithique arborent une fréquence proche de celle observée dans la population européenne actuelle, indiquant des épisodes de sélection positive pré-datant le Néolithique, tandis que d’autres montrent des fréquences différentes, signe d’une sélection en cours sur ces loci. Cette étude accroit notre compréhension de relations entre les différentes populations de la fin de la Préhistoire, à l’échelle de la France et de l’Europe.
Mots-clés : ADN ancien, ADN mitochondrial, génomes anciens, Néolithique, Age du Bronze, Age
vii
Table of contents
Part I. Introduction ... 1
Chapter I. Modern populations genetics ... 1
I. Variations in human populations ... 1
II. Signatures of past events in present-day people ... 6
Chapter II. From genetics to paleogenomics ... 8
I. Genetics of modern populations... 8
II. A new discipline: paleogenomics ... 17
Chapter III. The peopling of Europe during the Holocene ... 27
I. Insight from archeology... 27
II. Ancient DNA studies helped to end longstanding debates ... 33
Chapter IV. Description of the thesis project ... 40
I. State of the art ... 40
II. Aim of the project ... 41
III. Strategy ... 42
Part II. Material and methods ... 44
Chapter I. Material ... 44
Chapter II. Sample processing ... 60
I. Sample preparation ... 60
II. Sample characterization ... 66
III. Library preparation ... 68
Chapter III. Mitochondrial genome and nuclear SNPs enrichments ... 72
I. DNA capture ... 72
viii
Chapter IV. Sequencing and data processing... 77
I. Sequencing ... 77
II. Paired-end reads trimming, merging and filtering ... 77
III. Mapping and filtering ... 77
IV. Contamination and authenticity ... 78
V. Sex determination ... 78
Chapter V. Population genetics analyses ... 80
I. Capture data ... 80
II. Shotgun data ... 82
Part III. Methodological developments ... 87
Chapter I. Ancient DNA capture... 87
I. Generalities about the capture ... 87
II. Marker selection and primer design ... 88
III. Target PCR amplification ... 95
IV. Second amplification ... 97
V. In vitro transcription ...100
Chapter II. Results of a preliminary capture ...101
Chapter III. Conclusion and discussion ...104
Part IV. A French population from the Neolithic to the Iron Age: insight from uni-parentally inherited markers and phenotypes ...105
Chapter I. Introduction ...105
Chapter II. Results...108
I. Sample characterization ...108
II. The Mesolithic substrate (~ 11,000-7000 BCE) ...113
III. Evolution of the populations during the Neolithic (~ 5500–2500 BCE) ....113
IV. Transitioning into Bronze Age (~2300-1000 BCE) ...119
ix
VI. Y chromosome haplogroup analysis...122
VII. Phenotypic changes from the Mesolithic to the Bronze Age ...129
Chapter III. Discussion ...132
I. Continuity with both the Danubian and the Mediterranean Neolithic routes 132 II. A contrasted picture across the French territory as the Neolithic progresses 133 III. Interactions with hunter-gatherers ...134
IV. Influence of the population from Eurasian steppe during the onset of Bronze Age and Iron Age...136
V. Adaptation over time to new environments and lifestyles ...136
Chapter IV. Conclusion ...138
Part V. Paleogenomic overview of the peopling of France from the Mesolithic to the Iron Age 139 Chapter I. Introduction ...139
Chapter II. Results...141
I. Sample characterization ...141
II. Mesolithic France ...146
III. Neolithic France...148
IV. Late Neolithic and the onset of Bronze Age ...152
V. Bronze and Iron Age France ...156
Chapter III. Discussion ...158
I. Structure among Western hunter-gatherers ...158
II. Neolithic continuity and admixture with hunter-gatherers ...158
III. A shift in affinities with the advent of Late Neolithic and Bronze Age...159
IV. No apparent changes as France transitions to the Iron Age ...160
x Part VI. Conclusion and perspectives ...162
xi
Table of figures
Figure 1: Frequency of the blood group O in Europe. ... 2
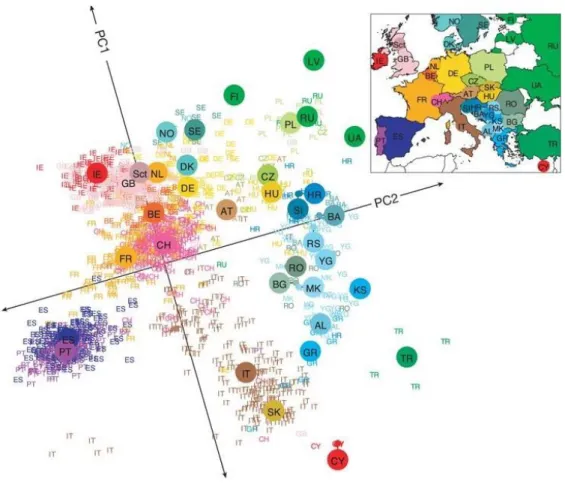
Figure 2: A statistical summary of genetic data from 1,387 Europeans based on principal component axis one (PC1) and axis two (PC2)... 7
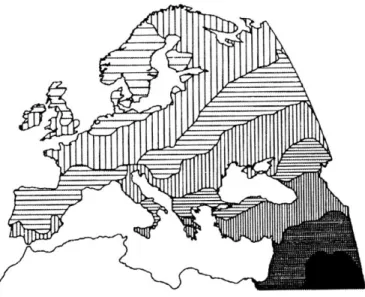
Figure 3: A summary of genetic variation in Europe’s first principal component... 9
Figure 4: Structure of the mitochondrial DNA ... 10
Figure 5: Structure of the Y chromosome ... 11
Figure 6: Global distribution of mtDNA haplogroups. ... 12
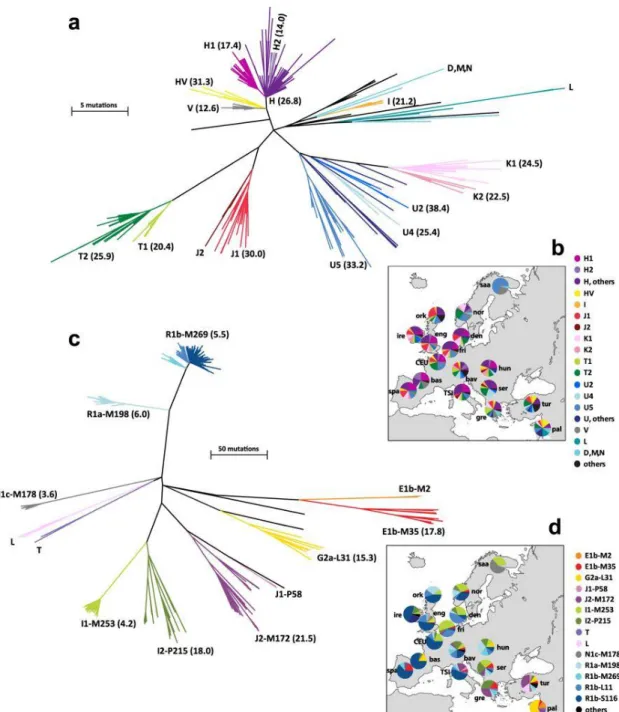
Figure 7: Phylogenies and geographical distributions of European mtDNA and Y chromosome lineages... 14
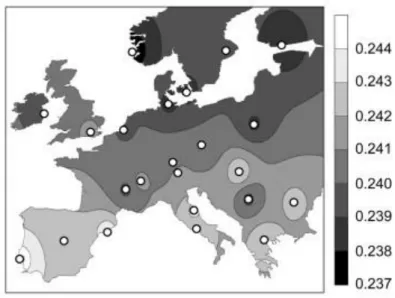
Figure 8: Isoline map of Europe based on the mean observed heterozygosity in each of 23 European subpopulations. ... 16
Figure 9: A. Fragmentation and B. deamination occurring in the aDNA molecule. ... 19
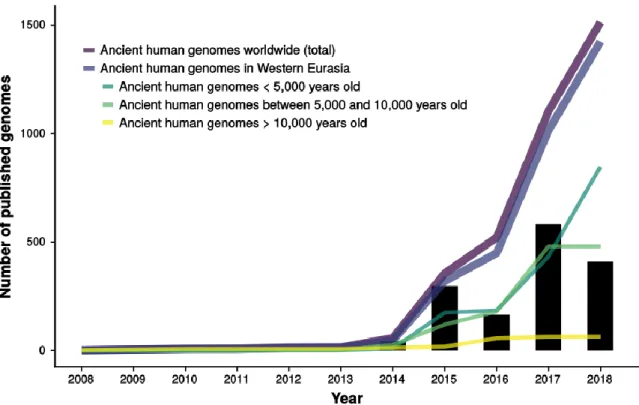
Figure 10: Evolution of the number of published genomes over the last 10 years. ... 26
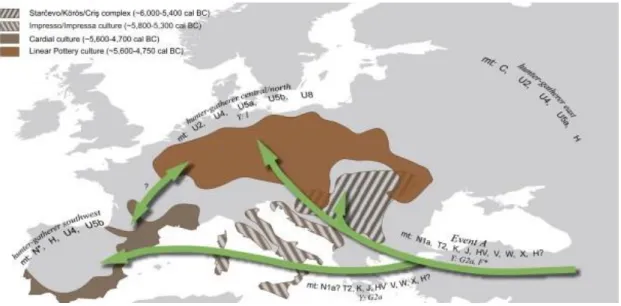
Figure 11: Neolithic cultures in Western Eurasia ... 29
Figure 12: Spread of the Neolithic into Europe and associated haplogroups ... 35
Figure 13: Yamnaya-related admixture into Bronze Age European populations ... 37
Figure 14: Proportion of steppe-related ancestry in Beaker-complex-associated groups in Western Europe. ... 38
Figure 15: Picture of a fragment of the temporal bone ... 61
Figure 16: Sampling procedure of a tooth ... 62
Figure 17: Extraction procedure for different type of samples. ... 64
Figure 18: Results of an inhibition test ... 67
Figure 19: Deamination patterns in an ancient sample. ... 69
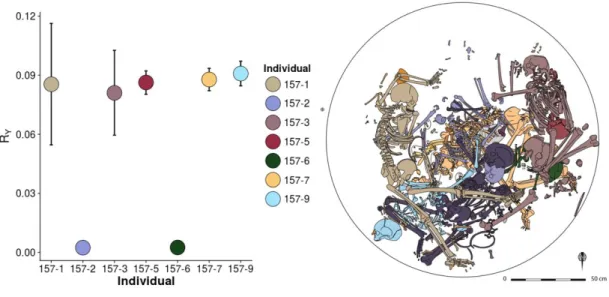
Figure 20: Sex determination of 7 individuals from the Neolithic tomb 157 of Bergheim ... 79
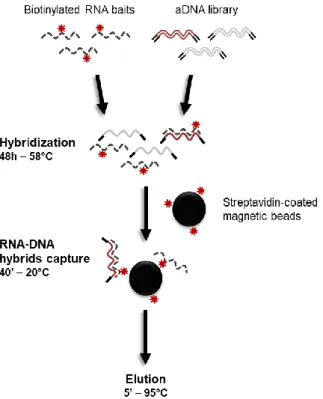
Figure 21: Summary of the enrichment procedure used during this project ... 88
Figure 22: Strategy used to obtain biotinylated RNA baits from modern human DNA. ... 94
Figure 23: qPCR amplification of P131 and M231. ... 96
Figure 24: Conducted tests to estimate the specificity and the melting temperature of universal re-amplification primers depending on the annealing length... 98
xii Figure 25: Re-amplification of LP1 tagged PCR product. ... 99 Figure 26: Boxplots showing the size distribution of reads mapping to human genome and mitogenome before and after capture. ...102
Figure 27: Location of French archeological sites included in this study. ...107 Figure 28: Boxplot showing the percentage of endogenous DNA per bone type across all sequenced samples ...109
Figure 29: Frequency of transitions associated with aDNA damages on the 10 terminal positions of non-UNG treated DNA molecules ...110
Figure 30: Location of published samples included in this study. ...111 Figure 31: Clustering of the individuals included in the present study. ...112 Figure 32: Ward’s clustering of ancient populations based on haplogroup frequencies ...113 Figure 33: Changes in the average frequency of 16 core haplogroups in the ancient French population ...116
Figure 34: Frequency of the derived allele for several types of genetic markers in Neolithic French and present-day Europeans. ...130
Figure 35: Authenticity of DNA across all ancient French ...141 Figure 36: Principal component analysis of ancient Western Eurasians projected onto the present-day variation of genotypes...143
Figure 37: Genetic affinity between ancient French and either Western hunter-gatherers or Steppe herders. ...145 Figure 38: f3(Ancient French, Modern population; Mbuti) for Mesolithic, Early and Middle Neolithic French ...147
Figure 39: f3(Ancient French population, Ancient population; Mbuti) for Mesolithic, Early and Middle Neolithic French ...149
Figure 40: Supervised ADMIXTURE on ancient French where Western hunter-gatherers, Anatolian farmers and Steppe herders are used as source populations ...150 Figure 41: Result from Spearman’s rank correlation test. ...152 Figure 42: Shared alleles between populations from the Steppe and French Bell Beakers. ...154
Figure 43:f3(Bell Beaker, Ancient population; Mbuti) performed on Bell Beaker from Northern and Southern France ...155
xiii Figure 44: f3(Ancient French, Modern population; Mbuti) for Bronze Age and Iron Age French ...156
Figure 45: f3(Ancient French, Ancient population; Mbuti) for Bronze Age and Iron Age French ...157
xv
Table of tables
Table 1: Compared chronologies of the Bronze and Iron Ages in the German and the
French system ... 32
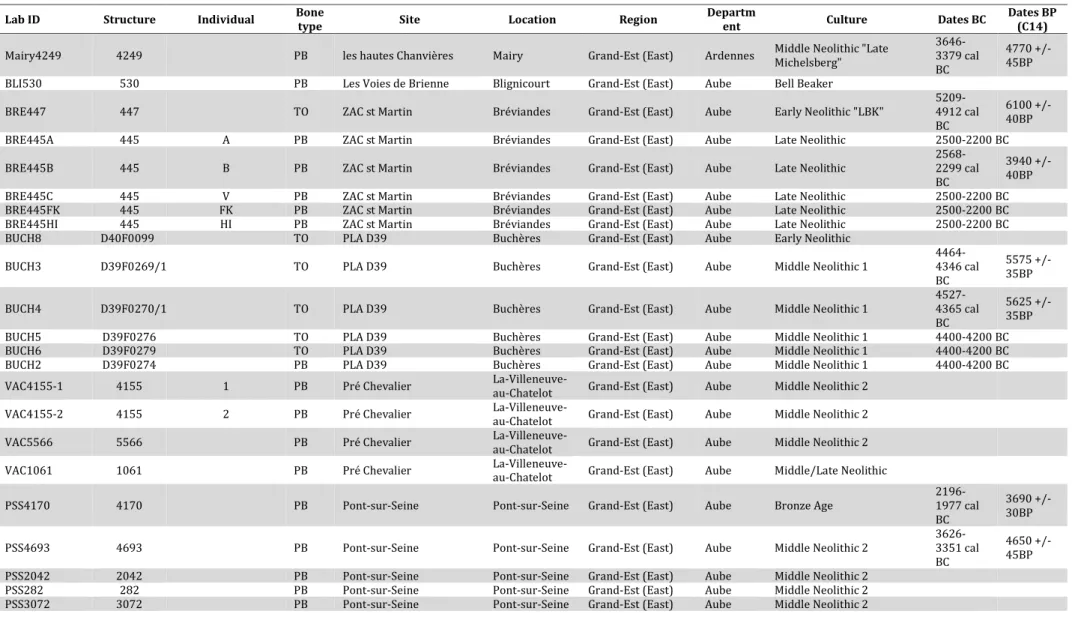
Table 2: List of all samples included in the present study... 45
Table 3: Optimized PCR conditions for the amplification of the complete mitochondrial genome ... 89
Table 4: List of SNPs associated ancestry, physiological and physical trait ... 90
Table 5: Immunity-related variants incorporated in the current study ... 92
Table 6: Y chromosome SNPs and associated haplogroups... 93
Table 7: Mitochondrial haplogroups and location of individuals assigned to the LBK culture ...114
Table 8: Linearized Slatkin’s pairwise FST values between populations included in the present study ...117
Table 9: P-values of Fisher’s exact test conducted on haplogroup frequencies ...118
Table 10: Mitochondrial haplogroups and location of individuals assigned to the Bronze Age. ...119
Table 11: Mitochondrial haplogroups and location of individuals assigned to the Iron Age. ...120
Table 12: Y chromosome haplogroup assignments for Mesolithic and Early Neolithic individuals ...123
Table 13: Y chromosome haplogroup assignments for Middle Neolithic individuals ...124
Table 14: Y chromosome haplogroup assignments for Bell Beaker and Bronze Age individuals ...126
Table 15: Y chromosome haplogroup assignments for Iron Age individuals ...128
Table 16: Values of D(Mbuti, French HG; WHG, WHG) and corresponding standard errors and Z-scores ...146
1
Part I.
Introduction
Chapter I. Modern populations genetics
I. Variations in human populations
The world around us is a world of diversity of shapes and forms, with 1.5 million species identified and nearly a thousand times more yet to be observed (Larsen et al., 2017). As humans, we are the results of a complex and seemingly ancient history that spans around 10 million years, from the moment our lineage diverged from that of present-day chimpanzees (Patterson et al., 2006). Yet the 7.6 billion of us worldwide today are no exceptions to the rule of diversity, as humans indeed are a complex species that displays a wide range of features, some being remarkable while others remain invisible to the eye. These characters, or phenotypes, called for the establishment of categories and classifications among humans. Hence the most obvious traits such as skin and hair color, hair texture, head morphology, set the basis to concepts such as races that, stripped off their objective purposes, served to legitimate judgment of value among groups. The criteria used for classification evolved with the scientific knowledge available at the time, but always had to fulfill two main conditions: be hereditary and have a certain stability within a population from one generation to the other (Jacquard, 1978).
The existence of molecular genetic variation among human populations was first observed through the blood system by Karl Landsteiner in 1900, a discovery for which he was awarded the Nobel Prize in Physiology or Medicine in 1930. He found that when mixing together blood samples recovered from different individuals, they would sometimes agglutinate. Through his experiments, he identified the three main blood groups we are all familiar with today. The genetic inheritance of these groups was later demonstrated by Hirszfeld and Hirszfeld in a classic study published in 1910, resulting in the identification of the first human gene to be described: the ABO locus, which determines the presence of one, both, or neither of the A and B antigens on red blood cells (erythrocytes), defining ABO blood groups (Hirszfeld and Hirszfeldowa, 1919). In 1954, Arthur Mourant published The distribution of the human blood groups, a groundbreaking book in which he summarized allele frequencies for serological variation in various populations, as blood-group data was being abundantly produced in the context of blood
2 transfusion, and one of the very few human traits with clear genetic inheritance at the time. This large-scale study revealed that detectable genetic differences exist among human populations, as the frequency of the different groups varied across the world (Mourant, 1954).
As more and more genetic markers were discovered and studied within families, it soon became apparent that combinations of alleles at different genetic loci could segregate together from one generation to the next. This concept of haplotypes was introduced in a study of the major histocompatibility complex, where segregation of combinations of alleles was observed by Ceppellini and colleagues in 1967 (Ceppellini et
al., 1967). Altogether, these stepping stones contributed to our understanding of the
mechanisms underlying both our similarity and our diversity, as analyzing the genotypes of various loci on a chromosome in populations and their inheritance within families could help us study humans and their evolution (Race et al. 1975).
In this introduction, I chose to present the milestones that ultimately shaped modern genetics, from the discovery of the DNA molecule to the theoretical concepts that provided the framework within which individuals and populations are studied today. Focusing on Western Eurasia, we will see how genetics aimed at answering questions
Figure 1: Frequency of the blood group O in Europe. (Mourant, 1954)
3 about when and how the European continent was populated, and what the origins of the first Europeans were. Finally, we will show how individuals from past populations, through multiple approaches involving specialists from a wide range of disciplines, ultimately allowed us to delve into our past. The outcome of these various studies will be put into perspective in order to discuss the results newly reported in this work.
1. From phenotypes to genotypes
As the first theories about the causes of phenotypic variations appeared, the underlying mechanisms of the transmission of characters across generations were still obscure. Hence the concept of pangenesis from Charles Darwin in 1868, stating that every part of the adult body emitted small organic particles called gemmules that migrated to the gonads, contributing heritable information to the gametes (Darwin, 1868), or Buffon’s
seminal liquor, a fluid “composed of parts which seek to be organized; that it in fact
produces organized substances, but that they are not as yet either animals or organized substances, like the individual which produced them” (Buffon et al., 1767). The rediscovery of Gregor Mendel’s work in 1900 (Mendel G., 1866), 45 years after their first publication, set the basis for genetics by introducing concepts now known as genes and
alleles and their transmission across generations. The identification of DNA as the
support of genetic information over the course of the 20th century (Levene, 1919) and the description of its structure in the 1950s marked the beginning of the genetic era as we know it (Chargaff, 1950; Watson and Crick, 1953).
2. Internal forces altering the DNA sequence
As I briefly mentioned in the previous paragraph, the pioneer work of Phoebus Levene during the 20th century resulted in the description of the monomers of DNA, i.e.
nucleotides, and their organization into the DNA sequence (Levene, 1919). Genetic
variation is caused by changes that alter this sequence and are called mutations. Mutations occur spontaneously within cells, through non-repaired errors in DNA replication, or DNA damages induced by byproducts of the normal cell metabolism such as reactive oxygen species (Loeb, 1989). They may also be caused by external factors that alter the DNA sequence, such as ultraviolet light, X rays, or certain chemicals (Motulsky, 1984). There are many different types of mutations, the most commonly used for many
4 purposes being single nucleotide polymorphisms (SNPs), changes that only alter one nucleotide, replacing it with another. These mutations can only be identified through sequencing, when the DNA sequence is aligned with another sequence that serves as a reference. Every time a genome is passed from one generation to the next it accumulates 100–200 new mutations, according to a DNA-sequencing analysis of the Y chromosome (Xue et al., 2009). Other genomic forces are then acting upon these variations. During meiosis, the cell divisions that lead to the production of gametes, newly duplicated chromosomes exchange parts through recombination, a process often mediated by homology. This recombination results in a new arrangement of maternal and paternal alleles on the same chromosome. Even if the order of genes along the chromosome does not change when this process occurs properly, the combination of parental alleles can be altered. The frequency of these crossovers varies across chromosomes, leading to the notion of "genetic linkage” between alleles to describe the tendency of alleles to be inherited together as a result of their location on the same chromosome. The stronger the so-called linkage disequilibrium, the more likely alleles at each of two positions will be found in association with one another. Since such loci are no longer considered as independent, description of human variation requires more than just the positions and characteristics of isolated SNPs. One rather needs to study how these SNPs vary simultaneously within a part of or a whole chromosome, which requires statistics of the correlations between the variations at different positions.
3. Other forces applying on existing variation
Allele frequencies can be estimated and compared among populations, revealing patterns of changes. These changes result from different forces that either affects single loci (evolutionary forces) or the genome as a whole (demographic forces).
(1) Genetic drift
Mutations set aside; each new generation draws a part of the genetic variability that existed in the previous one, in the form of two gametes picked at random. As this phenomenon occurs at each generation, any given allele has a chance to either disappear, or ultimately reach fixation in the population. The progressive modification of the genetic structure of a population solely by chance is called random genetic drift, and is due to a
5 finite number of individuals participating in the formation of the next generation, ultimately altering the frequency of an existing variant in the population (Kimura, 1983).
This process is slow in a large effective population, but its effect increases when a population goes through a bottleneck after a natural disaster or epidemic. The resulting loss of genetic diversity can persist long after the cause of the population decline disappeared, and reduces the potential of adaptation of the population. The reduction of genetic diversity that occurs when populations split into groups that afterwards remain separate characterizes a founder effect, a concept named after the term “founder”, first introduced by Ernst Mayr in Systematics and the Origin of Species from the Viewpoint of a
Zoologist to describe individuals starting a new population after a split from their parent
group (Mayr, 1942). Such episodes are quite common in our history, as our species was born in Africa and every human population today was founded by a reduced number of individuals that originally stemmed from this initial group, carrying only a subset of its genetic diversity (Stringer and Andrews, 1988). As a consequence of the expansion of humans around the world through a series of founder effects, genetic variation in human populations decreases with the geographic distance to the source population in Africa (Ramachandran et al., 2005).
(2) Migrations and gene flows
The study of genetic drift relies on one main assumption: the isolation of the group during the period that encompassed the studied generations. Yet such isolation over a long period of time is rarely encountered in nature, especially among humans.
Only a little more than a hundred tribes across the world still maintain limited contacts with other people according to Survival International, even though many more are probably still unknown (https://www.survivalinternational.org/uncontactedtribes). These tribes often live in regions that are difficult to reach, such as the deep interior of the Amazon, the Congo, and the mountains of New Guinea, but also islands off India such as the Andaman Islands, and despite being described as uncontacted people, they do in fact often have a history of contacts. Apart from these exceptions, there is no such isolation among most populations across the globe today, as technology enabled people to move relatively quickly and easily from one part of the world to the other. Increased contact between people despite geographical distance and cultural differences provide more opportunities to pass on genes from one population to another. As such gene flows
6 introduce new sets of alleles in the genetic pool of a population, only a low amount of migration (i.e. few individuals) is enough to counter the effect of genetic drift. The more geographically and genetically distant each parental population is, the stronger the effect.
(3) Natural selection
The concept of natural selection was formalized by Charles Darwin in his On the Origin
of Species (Darwin, 1859) as follows: “If variations useful to any organic being do occur,
assuredly individuals thus characterized will have the best chance of being preserved in the struggle for life; and from the strong principle of inheritance they will tend to produce offspring similarly characterized. This principle of preservation, I have called, for the sake of brevity, Natural Selection”. This concept describes the differential survival and reproduction of individuals based on differences in their respective phenotypes, hence genotypes. Where one or several characters might be advantageous in a given environment and at a certain time, they might be preferably transmitted to the next generation as a result of a higher reproductive success, thus increasing in frequency in the population over time. Disadvantageous traits are removed from the population, as their carriers have fewer offspring each generation, reducing the frequency of the trait and its associated genotype in the population.
II. Signatures of past events in present-day people
The genetic variability of modern populations is not randomly distributed. Instead, it displays patterns. Within Europe for example, the first two principal axes of variation of the matrix of genotypes over about half a million genomic loci closely match latitude and longitude upon rotation of the axes (Figure 2) (Lao et al., 2008; Novembre et al., 2008), as would be expected if patterns of ancestry in present-day populations were mostly shaped by local migration. To the question “where does the genetic variation observed among modern Europeans come from?”, an intuitive answer would be that it must reflect some combination of demographic phenomena that occurred in its past, since Europe has been continuously peopled since the arrival of Homo sapiens around 45,000 years ago (Benazzi et al., 2011; Higham et al., 2011; Trinkaus et al., 2003). These phenomena would have acted upon both the genetic variation that accumulated before Europe was
7 colonized, as the first settlers had pre-existing genetic variation, but also the genetic variation that accumulated since then.
Figure 2: A statistical summary of genetic data from 1,387 Europeans based on principal component axis one (PC1) and axis two (PC2).
Small colored labels represent individuals and large colored points represent median PC1 and PC2 values for each country. The inset map provides a key to the labels. The PC axes are rotated to emphasize the similarity to the geographic map of Europe. (Novembre et al. 2008)
Indeed, the history of Europe is a history of migrations, sometimes at a very large scale. Thus, a common way to gain insight into these past population processes is to analyze and interpret patterns of genetic variation in present-day people. Few of us know our family histories more than a few generations back; it is therefore easy to overlook the fact that we are all distant cousins, related to one another via a vast network of relationships. Although most genetic relationship among individuals world-wide is very old, some individuals are related at far shorter time scales. Given that each individual has 2n
ancestors from n generations ago, theoretical considerations suggest that all humans are related genealogically to each other over surprisingly short time scales (Chang et al., 1999; Rohde et al., 2004).
8
Chapter II. From genetics to paleogenomics
I. Genetics of modern populations
1. Classical markers
An ever-increasing dataset of individual and population-wide biological information and developments in the mathematical framework associated with population genetics profoundly transformed the methodology of the field over the past century. Before the advent of DNA-based testing, proteins and blood groups constituted what was known as
classical markers, and attempts were made at correlating their allelic frequencies in
modern populations with spatial data. In Europe, clines in many of these genetic markers were therefore identified, spanning from southeast to northwest Europe (Figure 3). The correlation between the allele frequencies in those clines and the dates of origin of agriculture inferred from the archaeological record led Ammerman and Cavalli-Sforza to propose that the European genetic structure was determined mainly by population dispersal during the Neolithic: a demic diffusion (Ammerman and Cavalli-Sforza, 1984). In this model, Neolithic farmers expanded from the Near East into Europe, presumably as a result of population growth, spreading their genes along with novel technologies for farming and animal breeding over the entire continent (Sokal and Menozzi, 1982), and mixed very little with the preexisting hunting–gathering communities. In this scenario, the genes of the latter should represent only a small fraction of the present European gene pool. This contradicts the hypothesis broadly adopted among archaeologists that advocated in favor of the development of agriculture in Europe or, alternatively, the adoption of plants, animals and related technologies from the Near East with only limited and geographically restricted human migration. Indeed, computer simulations have shown that a Neolithic expansion is the simplest, but not the only, possible cause of the continent-wide clines of allele frequencies. Paleolithic population dispersal may have been accompanied by founder effects, resulting in clines under successive short-distance gene flow (Barbujani et al., 1995). Thus, the current European gene pool could have been established during the Paleolithic, with relatively few Near Eastern genes incorporated during the Neolithic, and the farming technologies would mostly have spread through cultural transmission, rather than by population movements.
9
Figure 3: A summary of genetic variation in Europe’s first principal component
Different shades of gray represent different values of a synthetic variable summarizing allele frequency at 120 protein loci. (Cavalli-Sforza, L. L., et al., The History and Geography of Human Genes)
2. DNA markers
Methodological developments such as the polymerase chain reaction (PCR) in the 1980s coupled with Sanger sequencing in 1977 introduced the use of DNA markers to population genetics. It became possible to simultaneously study various genomic loci within theoretical frameworks that allowed us to introduce the notion of evolutionary distance between alleles, and study the genetic relationships among human populations, as well as their relatedness with other species. In this paragraph, I will introduce the different types of DNA found within a cell, and how they can be used to study relatedness among individuals and populations.
Mitochondrial DNA (mtDNA) is located within mitochondria, cellular organelles that are involved in the energetic metabolism, converting organic material into a form that cells can use, adenosine triphosphate (ATP). The number of these organelles varies among cells and cell types, but is usually comprised between several hundreds and one or two thousand. In humans, like in most species, mitochondrial DNA is transmitted exclusively from mothers to offspring, with almost no recombination events. It is a 16,569bp-long circular DNA molecule that codes for a total of 37 genes. These genes are not evenly distributed across the mitochondrial genome, which is divided into both a coding and non-coding region. The latter contains two specific “hypervariable” regions (HVR-I and HVR-II), that accumulate mutations at a faster rate, rendering it particularly useful for genotyping individuals. The mitochondrial genome as a whole accumulates
10 mutations, though at a slower pace. Combinations of these mutations define haplotypes, and when extended across the whole mitochondrial genome, fit into a broader haplogroup that characterizes a specific maternal lineage. All these mutations are defined through comparison with a reference sequence: the Cambridge revised sequence (rCRS, Anderson
et al. 1981, Andrews et al. 1999).
Figure 4: Structure of the mitochondrial DNA (Parsons et al. 1999)
Nuclear DNA is composed of 22 pairs of autosomes numbered from 1 to 22 and one pair of allosomes (or sexual chromosomes) X and Y. The Y chromosome is found only in males, and is transmitted from fathers to sons only. It carries small regions that are homologous to the X chromosome (pseudoautosomal regions, PAR 1 and PAR 2) and therefore suitable for homologous recombination during meiosis (Figure 4). It also contains a male specific region called “non-recombining region of the Y chromosome” (NRY), which forms the bulk of the chromosome and like the mitochondrial DNA lacks the possibility to recombine. The mutations that accumulate over this large portion of the chromosome also define haplogroups that allow tracing of paternal lineages (Underhill et
11
Figure 5: Structure of the Y chromosome (Gusmão et al. 2008)
(1) Results from uni-parentally inherited markers
The first widely used molecular markers were variants of the mitochondrial DNA (mtDNA) and the NRY. Due to their peculiar mode of transmission, these markers are transmitted from one generation to the next intact (apart from new mutations), as they have no homologous partner to recombine with. As their mutation rate is known from the study of pedigrees, these markers allow a straightforward phylogeny construction and inferences of some aspects of population relationships, as they provide a uniquely male or female perspective of human evolutionary history (Pakendorf and Stoneking, 2005). Understanding the evolutionary path of both the female and male lineages has helped population geneticists trace their inheritance in modern humans back to Africa and their subsequent spread around the globe (Cann et al., 1987). Due to their sex-specific nature, investigating both mtDNA and the NRY in parallel to data from the recombining autosomes remains important as they provide insights into social and demographic parameters, such as sex-biased introgression or mobility, which are crucial for the reconstruction of past societies (Haak et al., 2008).
12
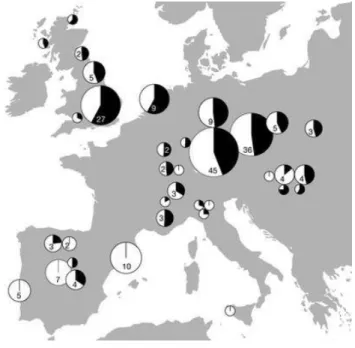
Map showing the names and locations of worldwide populations from the 1000 genomes project along with pie charts showing the relative frequencies of mtDNA haplogroups for each population. The haplogroups are color coded as shown in the key. (Lavanya et al. 2017)
Studies from uniparentally inherited markers have improved our understanding of human demographic history, as the distribution of mtDNA and Y chromosome haplogroups around the world reflects the early dispersion of humans out of Africa (Figure 6). At a more local scale, no significant structuring could be detected from the mtDNA in present-day Europe and Near East, in comparison with the gradients exhibited by classical markers (Figure 3) (Menozzi et al. 1978; Ammerman and Cavalli-Sforza 1984; Sokal et al. 1989, 1991; Cavalli-Sforza et al. 1994). A principal-component analysis of the hypervariable segment I (HVS-I) by Cavalli-Sforza and Minch (1997) indicated that the main detectable pattern was a shallow east-west gradient that accounted for only 23% of the variation. These studies brought out the limitation of this approach on mtDNA to infer the demographic history of Europeans, as selection and maternal gene flow across the continent potentially blurred ancient migration events (Barbujani and Chikhi, 2006).
Other approaches were used to deduce the patterns of the pioneer human peopling from the extant mtDNA diversity. One example was the calculation of the coalescence age of mtDNA haplogroups identified as being autochthonous from a given region. From the mtDNA variability of sampled individuals in the present-day population, and assuming
13 that no selection or gene flow had occurred, the age of the common ancestor to these lineages can be estimated. The founder analysis of mtDNA in Europe, undertaken by Richards and colleagues in 2000, was based around the idea that this coalescent age would reflect the time of the colonization of the region (Richards et al., 2000). In this study, a founder type was defined as an ancestral node in the mitochondrial phylogenetic tree, that was either present in both the source and the destination area, or reconstructed from extant haplogroups (Richards et al., 2000; Stoneking et al., 1990). Through the fine tuning of this method and the extension of the Near Eastern, European, and Northern-Caucasus mitogenome databases, they observed that the largest fraction of extant mtDNA lineages date back to the reexpansion that followed the Last Glacial Maximum, 20,000 years ago, and that the maternal contribution of Near Eastern Neolithic farmers to the modern mtDNA pool did not exceed 20%. These results support the colonization of Europe by small groups of Near Eastern people combined with a wide-scale adoption of the Neolithic lifestyle by autochthonous Mesolithic populations (Richards et al. 2000). However, the coalescent time of two mitochondrial sequences drawn from both the source and the destination population is expected to be older than the split of the two populations (Barbujani et al., 1998). Indeed, unless the colonizing group passes through a strong and long-lasting bottleneck (Nei et al., 1975), it will harbor some degree of genetic diversity prior to migrating into the destination area. Under such scenario, the estimated age of founder types will predate the time of the migration.
An initial Y-chromosome analysis reached a similar conclusion (Semino, 2000), and the proposed scale of immigration was further reduced. A number of distinct episodes, including (i) migration from Northeast Africa, (ii) expansion of acculturated indigenous hunter-gatherers in the Balkans, or (iii) younger expansions, were proposed (Battaglia et
al., 2009). Studies of Western European mtDNA and Y-chromosome variation supported
these conclusions, with a largely Mesolithic ancestry in various regions of Europe including the Basque country, the Iberian and Scandinavian Peninsulas and the British Isles (Luca Cavalli-Sforza et al., 1995). These regions may still have received Neolithic immigrants, who integrated maternal lineages of autochthonous hunter-gatherers.
14
Figure 7: Phylogenies and geographical distributions of European mtDNA and Y chromosome lineages.
(Batini et al. 2017)
From the mtDNA and Y-chromosome it was concluded that: (i) the Neolithic most likely dispersed into Europe through human migration, accompanied by a spread of domestic plants and animals alongside the migrants, (ii) the immigration from the Near East was minor, and there was substantial adoption of farming by indigenous groups in many parts of Europe and (iii) internal European migrations that occurred after the Neolithic may have later considerably reshaped the genetic landscape. Thus, many mitochondrial lineages whose origin has been traced back to the Paleolithic period
15 probably reached Europe at a later time. Looking at three major Y chromosome lineages (I1, R1a, R1b) that represent more than 60% of present-day Europe’s Y diversity, Batini and colleagues showed that they have a short coalescent time (3,500 to 7,300 years ago), indicating a widespread male-specific phenomenon during the onset of Bronze Age, contrasting with mitochondrial data (Figure 7)(Batini et al., 2015).
(2) Results from autosomal markers
The study of genome-wide markers was initiated using microsatellites (short tandem repeats). Chikhi and colleagues used four of these markers in combination with other hypervariable genomic loci to study genomic variation across Europe. Their study highlighted broad clinal patterns of DNA variation that closely matched those described at the protein level. To the exception of the Saami, a semi-nomadic population from Northern Europe, all European populations were found to have split within the last 10,000 years. This pattern was consistent with the westward and northward expansion of a Neolithic population originating in the Near East, thus supporting a Near Eastern origin for the ancestral population of present-day Europeans.
The development of single nucleotide polymorphism (SNP) arrays further increased the resolution of genome-wide studies, as they are less prone to drift and providing insight further back into human history. I mentioned earlier how genes mirrored geography in Europe (Lao et al., 2008; Novembre et al., 2008). The study from Lao and colleagues revealed that, although the amount of differentiation within the European autosomal gene pool is small, the existing genetic differences correlated well with geographic distances, with a slight decrease in diversity running from south-to-north in Europe (Figure 8), with the highest haplotype and allelic diversity in the Iberian Peninsula, and the lowest haplotype diversity in England and Ireland (O’Dushlaine et al., 2010). Results from these studies were compatible with expectations based on European population history, mainly the prehistoric population expansion from southern to northern Europe and/or a larger effective population size in the south as compared to the north of Europe.
16
Figure 8: Isoline map of Europe based on the mean observed heterozygosity in each of 23 European subpopulations.
(Lao et al. 2008)
3. Limitations of the genetic approach in modern populations
When summarizing the results of the previously described studies, contradictions arise. While comparisons between archaeological findings and allele frequencies at protein loci suggest that most genes of current Europeans descend from populations that have been expanding in Europe in the last 10,000 years starting during the Neolithic period, recent mitochondrial data have been interpreted as indicating a much older, Paleolithic ancestry.
One has to bear in mind that when studying past events from variation in present-day populations, only the ancestral lineages of living subjects are available for inferences, thus lineages that became extinct in the past are usually not represented. Moreover, when considering nuclear data, the contribution of each of our ancestors to our nuclear genome becomes more diluted with every new generation, to the point where it is barely informative, leading to a progressive reduction of information the further back in time we go. Even if we focus on the last 50,000 years or so, it may seem that traditional genetics applied to modern populations can capture little of the dynamics of the growth and development of human communities. Most studies reflect current population structure and admixture during the last 3,000 years, but provide little insight into older population processes. Such insights can only be obtained through the analysis of ancient genomes.
17
II. A new discipline: paleogenomics
1. Background
The term “ancient DNA” (aDNA) refers to DNA molecules recovered from archaeological or paleontological samples. These samples are very diverse, ranging from tissues and bones, teeth, seeds and pollen for plant samples, coprolites and sediments (Haile, 2012; Loreille et al., 2001; Pääbo et al., 1988; Rollo et al., 1988; Thomas et al., 1989). The discovery that DNA could survive for thousands of years in favorable environmental conditions gave rise to a-new discipline called paleogenetics, a term that was initially invented by Emile Zuckerkandl and the physical chemist Linus Carl Pauling in 1963, when pondering possible applications in the reconstruction of past polypeptide sequences. The first ancient DNA sequence, isolated from a museum specimen of the extinct quagga, was published in 1984 by a team led by Allan Wilson (Higuchi et al., 1984). Paleogeneticists, by piecing together ancient DNA sequences using various analytical methods, aim at providing a temporal dimension to genetic studies that would be inaccessible with present-day genomes alone. In the field of anthropology, the use of aDNA allowed geneticists to elucidate broad patterns of relationship among populations, providing answers to long-standing archeological and paleoanthropological questions. When, where, and from what source did specific human populations arise? Who admixed with whom and when did this admixture take place? Are obvious changes in the archaeological record the result of population replacement or cultural innovation? Did past cultures leave any genetic descendants? As we will show in the next part, analysis of aDNA has been successful in answering several of these questions, but also raised many new ones in the process.
2. Generalities about ancient samples
After an organism is buried and decays, minerals from mineral-rich groundwater invade empty spaces left by the decomposition of organic matter and start accumulating. The degree to which the remains are decayed when covered by sediment determines the later details of the fossil. Most fossils consist only of skeletal remains or teeth; but sometimes they can contain traces of skin, feathers or even soft tissues. Trace amounts of DNA can occasionally survive the decomposition of organic matter for long periods of time after the death of an organism, though it is at least partially degraded and chemically
18 modified (Hofreiter et al., 2001). Little is known about the exact role the environment plays in DNA preservation. Bones are locally destroyed by bacteria and fungi (Bell et al., 1996), and the diagenetic alteration that characterizes fossilization is a localized process leaving discrete “fossilizing regions” (Wess et al., 2001). Thus, conditions that alter bacterial and fungal growth directly impact the chance for DNA preservation, and these conditions likely vary across and within bones. Temperature has been identified as a key factor in DNA preservation (Smith et al., 2001), but it is likely that all factors influencing chemical reactions (e.g., pH, chemical composition of bone and soil, hydrology...) also play a role. As a result, various types of microenvironments with different biological and physicochemical properties might enable long-term DNA preservation (i.e. so-called “molecular niches”(Geigl, 2002)), and such structures can form in the bones during fossilization. There, DNA might be protected from degradation (e.g., by adsorption to the hydroxyapatite (Ca5(PO4)3(OH)) matrix that composes the bone structure (Grunenwald
et al., 2014). The excavation of fossils, the washing procedures and other treatments they
are subjected to as well as their transfer to museums or natural history collections constitute important changes in the physicochemical conditions of such microenvironments with dramatic consequences on DNA preservation (Pruvost et al., 2007).
3. Signatures of ancient DNA molecules
Ancient DNA molecules are different from modern ones from many respects. The DNA molecule will degrade if not repaired. After death, cells no longer maintain their integrity, leading to the release of free radicals and nucleases from cell compartments that initiate the degradation of the DNA molecule. Cell rupture also releases nutrient-rich fluids, which encourage the growth of environmental microorganisms that contribute to further degradation of organic material. As the complex repair systems are no longer active in the dead cell, damages accumulate quickly, leading to fragmentation of the DNA molecule. If these enzymatic processes are reduced or stopped, traces of these organic molecules can survive. This is the case in exceptional circumstances, including rapid desiccation, freezing and high salt concentrations. It is thus the environmental conditions of preservation rather than the age of the cell that determines the rate of genomic
19 degradation (Gilbert et al., 2005; Hofreiter et al., 2001; Lindahl, 1993; Sawyer et al., 2012; Willerslev and Cooper, 2005).
Apart from fragmentation, DNA also undergoes chemical changes (Figure 9). In particular, the glycosidic bonds that bind the nitrogenous base to the sugar-phosphate backbone are weak points in the structure of DNA. Accordingly, hydrolytic cleavage of the glycosidic bonds in DNA, often referred to as “depurination” as it occurs more easily in purines than in pyrimidines, will lead to the formation of abasic sites. From there, hydrolysis of the deoxyribose will result in the eventual fragmentation of the DNA into progressively smaller molecules with single-stranded overhangs (Gates, 2009).Another characteristic signature of ancient DNA is the conversion of cytosine residues into uracil through hydrolytic deamination, a process that occurs more frequently at the single-stranded ends of the molecules (Hofreiter et al., 2001; Lindahl, 1993). Not only do these changes lead to an excess of C to T transitions in the DNA sequence, but they also hamper molecular approaches as they sometimes inhibit certain proofreading polymerases.
Figure 9: A. Fragmentation and B. deamination occurring in the aDNA molecule. (Dabney et al. 2013)
20
4. Constraints and limitations
Using ancient DNA to achieve a better understanding of the events that occurred during the European prehistory is quite a recent approach. Despite promising results, several issues still limit the potential of the discipline.
(1) Sample availability
The number of well-documented archaeological specimens available to perform such analysis is limited. Indeed, the number of excavated skeletons dating from certain periods such as the pre-Neolithic is quite low. Archaeological samples can, depending on the temporal or geographical region of interest, be very scarce due to environmental or cultural factors leading to a poor preservation of remains such as funerary practices (e.g. cremation). Because of this taphonomic bias, it should not be forgotten that the ancient individuals studied are not necessarily representative of a given ancient population. Funerary practices such as the selection of buried individuals according to their sex, age, and social condition makes it likely that not the entire ancient population was represented within burial sites but only parts of it. The process of extracting DNA from archaeological remains is destructive and often these remains are precious and irreplaceable. Ancient DNA studies thus require close collaboration with archaeologists, anthropologists and paleoanthropologists. Moreover, not all bones are good sources of ancient DNA, in particular spongious bones, and the small amount of material obtained from bones allows only for a limited number of experiments. As a result, the main problem of genetic studies of populations from the past concerns the number and representativeness of the samples. Thus, increasing the data available is essential to reconstruct population histories while accounting for regional and local variability.
(2) DNA degradation
The ability to obtain authentic ancient DNA from archaeological specimens varies according to numerous endogenous and external factors which influence DNA preservation within skeletal remains.
As stated before, DNA undergoes degradation from the moment the cell stops its activity and dies and if the environmental conditions are unfavorable, DNA can end up completely degraded. The number of DNA fragments extracted from an ancient sample is therefore expected to increase exponentially as their size decreases (Allentoft et al.,
21 2012), which contrasts with the observed size distribution of DNA sequences from published ancient specimens, that instead shows a deficit in short sequences. Although this deficit might result from poor DNA preservation, the loss of such molecules during extraction and library construction cannot be excluded (e.g., Dabney et al., 2013; Rohland and Hofreiter, 2007). Moreover, successfully retained very short fragments are less informative than long molecules as they can generate spurious alignments during post-sequencing analyses (Smith et al., 1985). The success rate of ancient DNA studies can thus vary from one specimen or one bone collection to another according to various additional parameters such as the age of the skeletal material, the burial circumstances, the storage conditions after excavation and the handling precautions taken during the analyses (Pruvost et al., 2007, 2008).
(3) Contamination
One of the major problems that prevented the widespread sequencing of hominin aDNA for several years was contamination. Genetic material extracted and sequenced from a tissue sample of a living individual will consist largely of DNA fragments from that individual (i.e., endogenous fragments) if standard laboratory practices are followed. In contrast, because aDNA is so scarce and fragmented, most of the genetic material extracted from fossils tends to be exogenous, usually mainly from environmental microorganisms. In addition, DNA from humans who handled the fossil can also be co-extracted and analyzed (e.g., Green et al., 2009). The latter type of DNA is especially troublesome, as present-day human DNA is similar in sequence to endogenous aDNA from hominin fossils, and can introduce biases in downstream analyses. Modern DNA, of a better quality, will often be favored by molecular approaches that rely on amplification such as the PCR even if it is less abundant than endogenous DNA. Although some of the first studies of nuclear aDNA from archaic hominins had problems with contamination (Green et al., 2009; Wall and Kim, 2007), there have been substantial experimental and computational innovations to mitigate its effect in contemporary studies. In the past decade, researchers have developed two broad sets of approaches to correct for contamination in their aDNA samples, allowing for the study of previously unusable sequences.
First, it is now a standard practice to extract aDNA under strict clean-room conditions -including UV irradiation, bleach treatment of surfaces, and filtered air systems- so as to
22 minimize the proportion of exogenous DNA in the fossil extracts (Champlot et al., 2010; Green et al., 2009). Reagent contamination is also a problem that has yet to be broadly recognized and addressed, e.g., through UV and enzymatic treatment of reagents prior to DNA library construction (Champlot et al., 2010). Additionally, during DNA library construction, unique adapters are incorporated to tag molecules that are present at the moment of extraction (Briggs et al., 2007), preventing contaminant molecules accidentally added during subsequent steps from being confused with endogenous molecules.
Second, after the DNA has been sequenced, several bioinformatic tools can be used to either remove contaminant reads or estimate the proportion of those reads present in a DNA library. A common practice is to estimate the rate of contamination using mitochondrial DNA, which is much more abundant than nuclear DNA and hence is sequenced to a much higher coverage. For highly divergent populations (e.g., Neanderthals), one can use diagnostic positions that distinguish the two groups and assess how many discordant reads are present at each position (Renaud et al., 2015). For modern human populations (e.g., ancient Europeans), one can check for reads that diverge from the consensus sequence or that do not contain molecular signatures consistent with aDNA (Ginolhac et al., 2011; Jónsson et al., 2013). There are also more sophisticated contamination rate estimation methods that use larger subsets of the data, including sex chromosomes (Korneliussen et al., 2014) and entire autosomal genomes (Racimo et al., 2016). Additionally, one can use patterns of cytosine deamination at the ends of fragments (see II.2) to filter out sequenced reads that do not display this signature and are therefore not likely to be ancient (Skoglund et al., 2014).
5. Methodological and technical improvements
Until 5 years ago, available genetic data consisted mostly of mtDNA studies, as the chances of retrieving nuclear data at a sufficiently high level of complexity decreases as we gradually move from cooler and temperate climate zones to warmer and more humid regions such as certain Mediterranean countries and regions in the Near and Middle East (Pruvost et al., 2008). This is unfortunate since these regions are crucial for our understanding of certain population processes such as Neolithization (Pruvost et al., 2008). Most of these studies were based on the targeted PCR amplification of regions of the mitochondrial genome, including the HVR, in order to recover genotypes of diagnostic
23 SNPs, crucial for haplogroup assessment. This approach, despite being highly cost effective, is prone to spurious results due to the high frequency of contamination with modern DNA when appropriate decontamination procedures are not followed, in particular when remains of H. sapiens are analyzed (Champlot et al., 2010; Olalde et al., 2018; Pääbo et al., 2004).
With the rise of new generation sequencing (NGS) over the past decade, allowing the obtain millions of DNA sequences in only a few days of work, an ever-increasing number of genomes or at least partial genomic information are now available for study. A number of different sequencing technologies and platforms exist, but all require beforehand the conversion of DNA extracts into sequencing libraries. This process consists in the ligation of sequencing adapters to the ends of each DNA molecule found in the extract, enabling the amplification and sequencing of all molecules with a single pair of primers.
Being naturally fragmented, aDNA might at first glance seem like an ideal candidate for such an approach since sequencing library preparation often includes a DNA fragmentation step. In fact, sequencing allows the recovery of short molecules that would not be amplified by PCR. Indeed, only fragments that are long enough to allow for the hybridization of the two PCR primers around a sequence of interest are amenable to direct amplification, while the priming sites required for amplification and sequencing are added externally by ligating adaptor sequences to the molecule ends. Thus, benefits from this strategy are numerous when applied to ancient DNA, and already allowed several breakthroughs in our understanding of the past, by unraveling genomes of long extinct species such as Neanderthals and Denisovans (Briggs et al., 2007; Reich et al., 2010), and demographic processes of past human populations (e.g., Gamba et al., 2014; Haak et al., 2015; Lazaridis et al., 2014). First, the amplification of all molecules within the library renders it “immortal”, as it can be stored and used for several downstream applications without risking the loss of unique molecules. This is a major advantage, since the amount of available material to extract DNA from is a limiting factor in ancient DNA studies. Adapters can carry an index sequence allowing the tagging of each molecule in the library with one or a combination of specific indexes. This allows the identification of a sample in the pool of libraries that is used during the sequencing, but also to monitor potential cross-contamination of the libraries after their barcoding. But the use of ancient DNA material is far from straightforward, as it is scarce and degraded, and some of its features can limit or impair the proper conversion of the extract into a library.
24 Fortunately, recent major advances in laboratory procedures and sequencing methods have facilitated a shift in the field of paleogenomics, from the analysis of mitochondrial genomes for a small number of individuals to the generation of genome-wide datasets at the scale of large populations.
(1) Identification of preservation niches
The discovery by Gamba and colleagues in 2014 of a specific part of the skeleton as a niche for DNA preservation revolutionized ancient DNA studies. The petrosal part of the temporal bone houses a specific structure, the otic capsule, that is extremely dense and was shown to yield a systematically higher endogenous DNA content compared to other skeletal element (Gamba et al., 2014; Pinhasi et al., 2015). This discovery made aDNA analyses possible of samples from regions that were otherwise not amenable to ancient DNA analyses. More recently, Alberti and colleagues identified through Computed Tomography (CT) scanning the routinely discarded outermost layer of long bones as their densest region, and another promising source of endogenous DNA (Alberti et al., 2018).
(2) Better recovery of DNA fragments
Another significant leap forward came through the refinement of library preparation methods. In particular, where most protocols only convert double-stranded molecules into a library by blunt-end ligation of adapters, the single-stranded method converts each strand of the DNA fragments separately into library molecules. This provides huge benefits for highly degraded samples where a significant fraction of the remaining DNA is short and partially single-stranded, because such procedures don’t rely on an initial repair step that would further shorten molecules presenting single-stranded overhangs. The first application of the single-stranded library preparation method was the generation of a 30-fold coverage genome sequence from the phalanx of a Denisovan individual, an extinct archaic human (Meyer et al., 2012). The success of the method led to further attempts at recovering genomic information from other ancient hominins such as a Neanderthal from the Altai (Prüfer et al., 2014) and a Pleistocene Homo sapiens from Ust Ishim in Siberia (Fu et al., 2014). In combination with a DNA extraction method optimized for the recovery of extremely short DNA fragments (Dabney et al., 2013; Glocke and