EUROPEAN
ECONOMY
Occasional Papers 201 | October 2014
Identifying fiscal sustainability challenges in the areas
of pension, health care and long-term care policies
ISSN 1725-3209 (online) ISSN 1725-3195 (print)
European Commission
Directorate-General for Economic and Financial Affairs
Identifying fiscal sustainability
challenges in the areas of pension,
health care and long-term care policies
ACKNOWLEDGEMENTS
This paper was prepared in the Directorate-General for Economic and Financial Affairs under the direction of Marco Buti, Director-General, Servaas Deroose, Deputy Director-General, and Lucio Pench, Director for Fiscal Policy.
Giuseppe Carone (Head of Unit, Sustainability of public finances) and Per Eckefeldt (Deputy Head of Unit, Sustainability of public finances) coordinated and supervised the production of the paper. The main contributors were Per Eckefeldt, Christoph Schwierz, Luigi Giamboni and Menno Aarnout. Statistical support was provided by Etienne Sail.
Comments and suggestions by colleagues in the Directorate-General for Economic and Financial Affairs are gratefully acknowledged.
Comments on the report would be gratefully received and should be sent to: Directorate-General for Economic and Financial Affairs
Unit C2: Sustainability of public finances European Commission
BE-1049 Brussels
TABLE OF CONTENTS
1. Introduction
5
2. A thematic assessment framework for identifying fiscal sustainability
challenges
5
2.1. Comparing structural fiscal challenges and country-specific
recommendations (CSRs) 7
3.
Pension
policy
challenges
8
3.1. Comparing pension challenges and country-specific
recommendations (CSRs) 13
4. Health care policy challenges
134.1. Comparing health care challenges and country-specific
recommendations (CSRs) 20
5.
Long-term
care
policy
challenges
20
5.1. Comparing long-term care challenges and country-specific
recommendations (CSRs) 23
Annex 1 –2014 Pension CSR
S24
Annex 2 – 2014 Health care CSR
S26
Annex 3 – 2014 Long-term care CSR
S28
Annex 4 – Coverage ratio development 2010-2060
29
Annex 5 – Penalties and bonuses for early and late retirement
30
Annex
6
–
Accrual
rates
31
Annex 7 – Definition of individual indicators in health care
32
Annex 9 – Detailed tables of individual indicators in health care
35
Annex 10 –Detailed information on the care needs index related to
long-term care
41
Annex 11 – Definition of individual indicators in long-term care
42
References
LIST OF TABLES
Table 1: Key indicators for fiscal sustainability challenges 7 Table 2: Horizontal analysis of structural fiscal policy challenges and CSRs in
2014 8
Table 3: Overview of relevant pension system indicators 11
Table 4: Overview of main results: country classification for potential reform
areas in healthcare 19
Table 5: Overview of main long-term care indicators 23
Table A.4.1: Coverage ratio development 2010-2060 (Total number of public
pensioners as % of population aged 65 and older) 29
Table A.9.1: Indicators of public expenditure on health,
2011 or most recent 35
Table A.9.2: Indicators of hospital care, 2011 or most recent 36 Table A.9.3: Indicators of ambulatory care, 2011 or most recent 37 Table A.9.4: Indicators of spending on outpatient pharmaceuticals, 2011 or
most recent 38
Table A.9.5: Indicators of public expenditure on administration and
insurance, 2011 or most recent 39
Table A.9.6: Indicators of health status, 2011 or most recent 40
Table A.10.1: Potential need for care services 41
LIST OF GRAPHS
1. Current (2011) and projected (2011-2060) public expenditure on
1. INTRODUCTION
This paper presents a horizontal assessment framework used by the Commission services to identify structural-fiscal reforms that are deemed necessary to address fiscal sustainability challenges in the Member States. It describes the steps to ascertain the extent to which there is a policy challenge in ensuring progress towards fiscal sustainability and which policy dimensions merits closer scrutiny, taking into account the country-specific circumstances in the fields of, respectively: i) pension policy; ii) health care policy; and, iii) long-term care policy. The areas under scrutiny concern the design of national policies in the above-mentioned policy fields and are under the direct control of the Member States’ governments. These areas are explicitly mentioned, in relevant cases, in the policy coordination process at EU level, the European Semester.
The deterioration in fiscal positions and increases in government debt since 2008, together with the budgetary pressures posed by population ageing, compound each other and make fiscal sustainability an acute policy challenge. Analysing prospective government debt developments and risks to fiscal sustainability is therefore crucial at the current juncture for euro-area countries and for the EU as a whole to be able to formulate appropriate policy responses and restore credibility and confidence. Developments in the recent past, in particular the sovereign debt crisis leading to conditions under which some Member States faced difficulties in accessing the market, have confirmed that fiscal sustainability challenges are not only of longer-term nature. The strengthening of the EU fiscal sustainability assessment framework as regards the short- and medium-term dimensions, as presented in the 2012 Fiscal Sustainability Report1 is, therefore, all the more relevant in the context of the financial and economic crisis.
The economic and budgetary situations and prospects vary widely among EU countries at the current juncture, pointing to a diversified policy approach and different degrees of required fiscal consolidation. The appropriate combination of policies needed to ensure fiscal sustainability will depend on the main reasons behind the fiscal sustainability challenges the different Member States are facing.
In terms of adapting economic policies to changing circumstances, structural fiscal adjustment plays an important role. In order to provide policy advice to countries in a comparable manner, it is useful to consider robust indicators so as to underpin the recommendations. From the overarching point of view of enhancing fiscal sustainability, a logical starting point is the sustainability indicators used in EU budgetary surveillance. The sustainability indicators show the extent to which there is a need for large policy adjustment now or in the future (of fiscal or structural nature or a combination of the two). On this basis, it is necessary to analyse the main causes of the sustainability gap and how they should be addressed. Hence, this process entails two steps:
• identifying the extent to which there is an important fiscal sustainability challenge;
• establishing the nature of the challenge so as to devise appropriate policies to remedy the situation.
2. A THEMATIC ASSESSMENT FRAMEWORK FOR IDENTIFYING
FISCAL SUSTAINABILITY CHALLENGES
A key objective in the EU is to ensure sustainability of the public finances, including in a long-term perspective. Fiscal sustainability refers to the ability to continue now and in the future current policies (with no changes regarding public services and taxation) without causing public debt to rise continuously as a share of GDP.
1 European Commission (DG ECFIN), 2012, "Fiscal Sustainability Report 2012", European Economy, No. 8/2012, EC, Brussels, http://ec.europa.eu/economy_finance/publications/european_economy/2012/fiscal-sustainability-report_en.htm .
First, for the purposes of establishing whether on the basis of current policies a large adjustment in policy is required to ensure fiscal sustainability, we look at the sustainability indicators (the S1 and S2 indicators2) used in budgetary surveillance in the EU. This multidimensional approach enables assessing:
• medium-term challenges, through fiscal gaps related to the excess of projected expenditure, including age-related expenditure (notably on pensions, health care and long-term care) over projected revenue together with any gap with respect to the primary balance needed to bring the debt-to-GDP ratio to 60% of GDP by 2030 (S1 indicator). This indicator, therefore, takes into account age-related spending trends over the medium term and beyond, influenced by among others country-specific demographic prospects and country-specific arrangements of pension systems. Moreover and importantly, it incorporates the effort needed by high-debt countries to respect the Treaty threshold of 60% of GDP for government debt within a reasonable time span.
• long-term challenges, through fiscal gaps related to the excess of projected expenditure, including age-related expenditure (specifically on pension, health care and long-term care) over projected revenue together with any gap with respect to the primary balance needed to ensure that the debt-to-GDP ratio is not on an ever-increasing path (S2 indicator). This indicator, therefore, takes into account very long-term trends, which is highly relevant when analysing public spending programmes like pensions and health care.
Countries with high S1 or S2 values are classified to be at medium risk (S1 higher than zero or S2 higher than 2) and high risk (S1 higher than 2.5 or S2 higher than 6). Second, once a medium or high sustainability gap is identified, it is necessary to pinpoint the nature of it. This is done by looking at the relative importance of future spending pressures in the EU countries in the fields of pensions, health care and long-term care, respectively. The time horizons correspond to those of the sustainability indicators (covering the full period (to 2060) of projections available from the 2012 Ageing Report3 in the case of the S2 indicator and the period up to 2030 for the S1 indicator). This implies that the underlying dynamics of the spending trends over time are given due attention (e.g. the time path of demographic trends and of institutional settings currently in place, thereby including the timing of pension reforms). Table 1 shows a set of indicators that merit attention so as to identify fiscal sustainability policy challenges, and in addition the source(s) behind those challenges.
The cost of ageing, a key element of the sustainability indicators, covers a longer time horizon (almost 50 years) and its impact comes from the projected changes in age-related expenditure, notably on pension, health care and long-term care (from the 2012 Ageing Report).
The largest expenditure item of these is public pension spending, accounting for about 11% of GDP in the EU as a whole. There is considerable variation across Member States in terms of both current expenditure levels and in terms of projected changes in pension spending, reflecting the different pension systems in place, and importantly, at which stage of the pension reform process countries find themselves.
The second largest expenditure item is expenditure on health care, accounting for about 7% of GDP for the EU as a whole. In addition to health care, consideration is given to expenditure on long-term care. Taken together, these items represent 9% of GDP in the EU. As for pensions, there is considerable variation across Member States in terms of both current expenditure levels and in terms of projected changes, reflecting the different health care and long-term care systems and arrangements in place.
The analysis provided above is useful in terms of identifying the scale and scope of fiscal policy challenges in the Member States, and in indicating the main reason(s) behind such challenges. On this basis, as noted above, the second step entails establishing the nature of the challenge so as to remedy the situation. Specifically, this is done by analysing the nature of the challenge taking into account the
2 For details about the sustainability indicators, see Chapter 1 in European Commission (DG ECFIN), 2012, "Fiscal Sustainability Report 2012", European Economy, No. 8/2012, EC, Brussels.
3
European Commission (DG ECFIN) and Economic Policy Committee (AWG), 2012, "2012 Ageing Report: Economic and budgetary projections for the 27 EU Member States", European Economy, No. 2/2012, EC, Brussels. http://ec.europa.eu/economy_finance/publications/european_economy/2012/2012-ageing-report_en.htm
county-specific circumstances in the fields of: i) pension policy, ii) health care policy and, iii) long-term care policy, respectively.
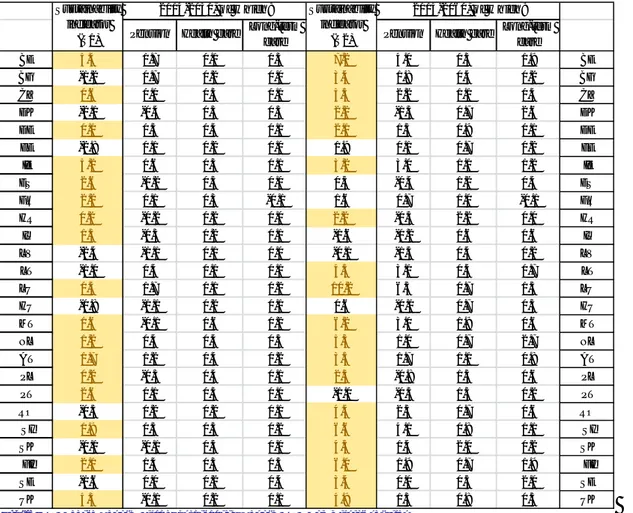
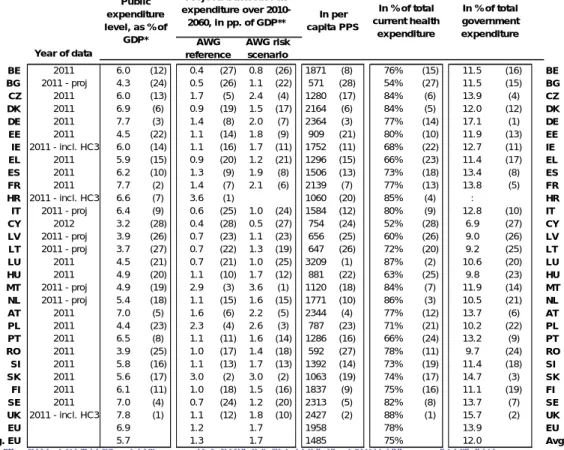
Table 1: Key indicators for fiscal sustainability challenges
Source: 2012 Ageing Report, Fiscal Sustainability Report 2012, Commission services
Notes: The sustainability indicators and projections of age-related expenditure in this table are calculated on the basis of the AWG reference scenario from the 2012 Ageing Report. Projections for BE, DK, ES, HU, NL, PL, LV, SK and SI have been updated after the publication of the 2012 Ageing Report in May 2012, to incorporate the impact of pension reforms, as verified by peer reviews by the Economic Policy Committee (EPC). Greece and Cyprus are implementing adjustment programmes monitored by the EU, the IMF and the ECB. The macroeconomic and budgetary prospects for these 'programme' countries are assessed more frequently than for the other Member States. The time horizon covered by the forecasts for these countries is also different than for the other Member States and assume full implementation of the adjustment programme. They are therefore not included here. Long-term projections for HR were not included in the 2012 Ageing Report. As proxies for long-term spending trends, the projections included in the 2012 pre-accession programme were used. It needs to be borne in mind that these projections are not comparable with those for the other 27 EU Member States. Column 1 (sustainability indicator S1): a value of more than 2.5 suggests high medium-term fiscal risk; a value between 0 and 2.5 suggest medium medium-term fiscal risk (high and medium risk highlighted in yellow), a value below zero suggests low medium-term fiscal risk. Column 5 (sustainability indicator S2): a value higher than 6 suggest high long-term fiscal risk and a value between 2 and 6 suggest medium long-term fiscal risk (high and medium risk highlighted in yellow), a value below two suggests low medium-term fiscal risk. Columns 2 to 4 and 6 to 8 (pensions, health care and long-term care): shows the contribution to the 'cost of ageing' from the specific spending programme.
2.1. COMPARING STRUCTURAL FISCAL CHALLENGES AND COUNTRY-SPECIFIC RECOMMENDATIONS (CSRs)
Europe 2020 is the European Union’s ten-year growth and jobs strategy that was launched in 2010. It is about more than just overcoming the crisis from which our economies are now gradually recovering. It is also about addressing the shortcomings of our growth model and creating the
Pension Health care Long-term
care Pension Health care
Long-term care BE 5.4 1.7 0.1 0.3 7.2 4.0 0.3 1.9 BE BG -1.2 0.7 0.2 0.0 3.4 1.8 0.4 0.2 BG CZ 0.6 0.0 0.3 0.1 5.3 2.2 1.1 0.4 CZ DK -2.1 -0.4 0.3 0.5 2.2 -1.3 0.7 2.6 DK DE 0.1 0.5 0.4 0.1 2.1 1.5 0.9 0.1 DE EE -2.8 0.1 0.2 0.0 1.9 0.1 0.7 0.2 EE IE 5.2 0.6 0.3 0.1 3.2 3.0 1.1 1.2 IE ES 2.6 -0.2 0.3 0.0 0.3 -0.4 1.2 0.4 ES FR 2.2 0.1 0.3 -0.1 1.6 0.7 1.0 -0.1 FR HR 0.2 -0.2 0.2 0.0 2.2 -0.3 2.2 0.0 HR IT 1.5 -0.3 0.2 0.1 -1.6 -0.2 0.6 0.6 IT LV -2.4 -1.1 0.1 0.0 -0.1 -1.5 0.4 0.2 LV LT -1.0 0.4 0.1 0.1 4.3 3.1 0.4 0.7 LT LU 0.4 1.7 0.1 0.2 10.2 6.5 0.7 1.5 LU HU -0.8 -1.1 0.2 0.1 0.6 -0.1 0.7 0.3 HU MT 1.6 -0.1 0.6 0.2 6.2 3.0 1.9 0.6 MT NL 1.2 0.4 0.4 0.5 5.3 1.0 0.7 2.7 NL AT 1.7 1.2 0.4 0.2 3.5 1.7 1.1 0.8 AT PL 0.2 -0.3 0.4 0.1 2.5 -0.8 1.5 0.6 PL PT 2.6 0.1 0.3 0.0 -1.0 -0.3 1.3 0.2 PT RO -0.5 0.2 0.2 0.1 4.4 2.5 0.7 0.6 RO SI 1.9 0.5 0.3 0.2 6.6 4.1 0.8 1.1 SI SK -0.1 -0.1 0.5 0.0 4.3 1.4 2.0 0.2 SK FI 2.1 1.4 0.3 0.5 6.0 1.9 0.7 1.9 FI SE -1.6 0.0 0.2 0.4 3.4 0.0 0.5 2.0 SE UK 4.3 -0.1 0.2 0.1 4.9 1.3 0.8 0.5 UK Sustainability indicator (S1) 2014-2030, of w hich: Sustainability indicator (S2) 2014-2060, of w hich:
conditions for a smart, sustainable and inclusive growth.4 Implementation of the Europe 2020 strategy is a core part of the policy coordination process at EU level through the annual European Semester. This entails formulating recommendations tailored to the situation in each Member State - Country-Specific Recommendations (CSRs). This section presents the outcome of the thematic assessment framework for structural fiscal reforms and makes a factual comparison with the 2014 CSRs (see Annexes 1-3 for the 2014 CSRs).
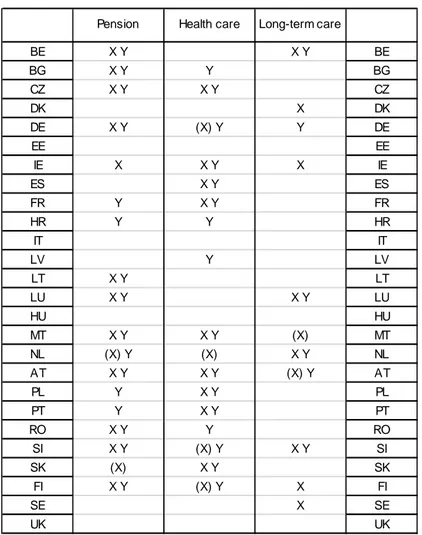
Table 2: Horizontal analysis of structural fiscal policy challenges and CSRs in 2014
Source: Commission services
Notes: X- challenges based on the screening described in Table 1 above, Y- CSR in 2014 European Semester, ( ) denotes a borderline case. A country may be considered a borderline case if it has been identified as being at either medium or high risk according to the S1 or S2 indicator (see Table 1) and the contribution to the sustainability gap from the specific policy area (pension, health care or long-term care) is: i) very close to the average in the EU; and, ii) higher than on average in the EU only in one of the time dimensions considered and not both (i.e. according to either the S1 or the S2 indicator). This is the case for MT and AT (long-term care), NL (pension and health care), SI (health care), SK (pension), FI and DE (health care). Long-term projections for HR were not included in the 2012 Ageing Report. As proxies for long-Long-term spending trends, the projections included in the 2012 pre-accession programme were used. It needs to be borne in mind that these projections are not comparable with those for the other 27 EU Member States.
Programme countries (EL and CY) are not included (see note to Table 1)
Generally, structural fiscal challenges and recommendations are broadly similar (see Table 2). There are also some differences, which do not necessary point to inconsistency but are often warranted by a series of valid reasons. First and foremost, some recommendations are not primarily motivated by concerns for fiscal sustainability, but for other reasons, taking account of special country specific circumstances. Second, the horizontal assessment framework may not take due account of very recent measures adopted or implemented in Member States, since they may not be captured yet by the
4 Eor further information on the Europe 2020 strategy, the European Semester and the Country-Specific Recommendations, see the Commission's website: http://ec.europa.eu/europe2020/index_en.htm.
Pension Health care Long-term care
BE X Y X Y BE BG X Y Y BG CZ X Y X Y CZ DK X DK DE X Y (X) Y Y DE EE EE IE X X Y X IE ES X Y ES FR Y X Y FR HR Y Y HR IT IT LV Y LV LT X Y LT LU X Y X Y LU HU HU MT X Y X Y (X) MT NL (X) Y (X) X Y NL AT X Y X Y (X) Y AT PL Y X Y PL PT Y X Y PT RO X Y Y RO SI X Y (X) Y X Y SI SK (X) X Y SK FI X Y (X) Y X FI SE X SE UK UK
quantitative indicators used. Third, there are some borderline cases that merit specific attention (highlighted with a bracket). The individual areas for policy challenges (pension, health care and long-term care) are analysed in sections 3-5, respectively.
The thematic assessment framework described here is meant to provide guidance as to whether fiscal sustainability risks are important based on available indicators in DG ECFIN and should therefore not be taken as incorporating all the country-specific considerations relevant for the final formulation of country-specific recommendations.
3. PENSION POLICY CHALLENGES
As a result of the analysis of fiscal sustainability above, several countries face challenges in the area of pension systems. Next to the pension expenditure analysis, a broad set of indicators of current and future performance of pension systems is thus presented, based on a comparative analysis. It develops the possible specific areas where policy could be adapted to address the sustainability challenges tailored to the country-specific circumstances in the pension policy field.
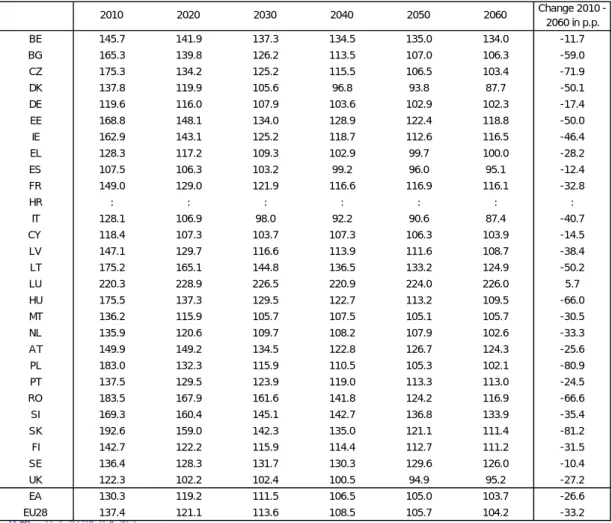
Pension expenditure projections
Public pension expenditures in the EU are projected to increase by 1.0 p.p. of GDP over the period 2010-2060 from 11.4 % of GDP to a level of 12.1% of GDP (see Table 3).5 In the euro area, an increase by 1.2 p.p. of GDP is projected. However, the range of projected changes in public pension expenditure is very large across MS. On the one hand, Latvia projects a decline of -3.7 p.p. of GDP. On the other hand, an increase of 9.4 p.p. of GDP can be observed for Luxembourg. Belgium, Malta and Slovenia project a public pension expenditure increase by more than 5 p.p. of GDP. On the contrary, the ratio decreases over the projection horizon between 2010 and 2060 in Bulgaria, Denmark, Estonia, Italy, Latvia and Poland. For the remaining countries, an increase of less than 4 p.p. of GDP is expected.
Potential reform approaches
For countries with medium/high fiscal challenges and high projected increases in public pension spending, there might be a need to implement sustainability-enhancing reform measures in their pension systems. In general, two ways to reform pension systems with the aim of increasing their sustainability can be distinguished:
1. Eligibility-restricting reforms: These reforms have a decreasing impact on the coverage rate of
pension systems. In many cases, reforms are related to the abolishment or restriction of early retirement schemes and other early-exit pathways, the increase in statutory retirement ages (also through introducing automatic links to the largely known changes in longevity over the medium- and long-term) or the harmonisation of retirement ages between men and women, .
2. Generosity-reducing reforms: As an alternative to restrictions in the coverage of a pension system,
several other policy approaches can be applied that restrict the generosity of the pension. This is reflected in a decrease in the pension benefit ratio (defined as the average pension as a share of the average economy-wide wage). If benefit ratios are very high both in comparison to the reference wage and in comparison to other Member States, this could hint to the fact that a pension system is rather generous. Reducing the benefit ratio, i.e. the generosity of pension entitlements, can thus have a substantial decreasing or at least stabilising impact on public pension expenditure.
5 European Commission (DG ECFIN) and Economic Policy Committee (Ageing Working Group), 2012, 'The 2012 Ageing Report: Economic and budgetary projections for the 27 EU Member States (2010-2060)', European Economy, No. 2/2012.
(http://ec.europa.eu/economy_finance/publications/european_economy/2012/pdf/ee2_en.pdf). Projections have been updated
after the publication of the 2012 Ageing Report for Belgium, Denmark, Cyprus, Latvia, Hungary, the Netherlands, Poland, Slovenia and Slovakia. Those changes have also an influence on the EU and EA average.
Eligibility-restricting reforms
The following indicators are specifically investigated when analysing the eligibility of a pension system:
- Coverage ratios: To get an overview in which countries eligibility-restricting reforms might be necessary, the projected coverage ratio development over time is examined. The coverage ratio is defined as the total number of public pensioners as % of population aged 65 and older. In those countries where this ratio is projected to remain rather stable even in the long-run, a potential need to restrict the pension system's eligibility might exist (see Annex 4 for an overview).
- Statutory and early retirement ages: For countries with high projected increases in public pension spending (and potentially high coverage ratios), a necessary component might be to adjust the retirement age, given the expected gains in life expectancy in the coming decades. This would be the case for countries in which retirement ages are supposed to stay constant at a relatively low level even in the long-run under current legislation. Moreover, in countries where the gap between early retirement ages and statutory retirement ages are quite substantial, people might be tempted to leave the labour market too early. A restriction in early retirement schemes might be needed to increase the effective retirement age and pension spending.
Table 3 below shows the change in statutory and early retirement ages under current legislation as well as the change in the effective retirement age, split by gender. As a result of recent reforms in many MS, statutory and effective retirement ages will rise substantially until 2060, with major steps often taking place in the near future. Only in Croatia (for men), Luxembourg, Austria (for men), Portugal, Finland and Sweden, no retirement age increases are legislated to take place. The gap between early retirement ages and statutory retirement ages is in several cases quite substantial (e.g. Belgium, France, Luxembourg, Austria, Malta or Romania).
- Retirement age gaps by gender: Statutory retirement ages for males and females will gradually converge in almost all MS, except for Bulgaria and Romania (see Table 3). In other countries the retirement age harmonisation is only implemented very gradually, i.e. till 2030 and even beyond (Croatia, Austria and Poland). In all those countries, an introduction/acceleration of the retirement age harmonisation might be a potential reform option.
- Effective retirement age projections and the gap between effective and statutory retirement ages: In almost all countries, average effective retirement ages are lower than the respective statutory retirement ages and a gap is projected to remain in the long-run (see Table 3). This is often related to existing early retirement schemes, alternative early-exit pathways such as disability schemes or other government measures that provide pension income before reaching the statutory retirement age threshold. Potential measures to increase effective retirement ages are restrictions in early retirement and other early exit pathways, increases in statutory and early retirement ages or other incentives to stay longer on the labour market, as described below.
- Penalties and bonuses for early and late retirement: One way to increase the effective retirement age further in the direction of the statutory retirement age would hence be to reduce incentives to leave the labour market early. Next to the full abolishment of early retirement schemes or the increase of early retirement ages, higher early retirement penalties and bonuses for late retirement could lead to the warranted effects. The size of applied penalties and bonuses in the different Member States can vary quite substantially (overview in Annex 5).6
6 For a general overview of actuarially neutral adjustment factors (i.e. penalties for early retirement), see Queisser, M. and E.R. Whitehouse (2006), "Neutral or Fair?: Actuarial Concepts and Pension-System Design", OECD Social, Employment and Migration Working Papers, No. 40, OECD Publishing. In that paper, an actuarially neutral penalty of around 6-7% is mentioned. This is also the average penalty in those countries that have a penalty system for early retirement. Bonuses for late retirement are in most of the countries slightly lower.
Tabl e 3: Ove rv iew of re le vant p ensio n sy st em indi cat ors Sou rc e: Co mmi ssion se rv ice s, EPC, Euro st at. No te s: * r ec en tly l egis lat ed au tom ati c lin k of re ti rem en t ag es to lif e exp ec tan cy f or C Y . On ly in form ati on on p roj ec ted min imu m fu ll p en sion ag e av ailabl e (c las sifi ed h ere as ea rly re tir em en t). Gap b etw een ea rly and st at uto ry age set as co nsta nt in t he lo ng -run . ** Fi gu res f or eff ectiv e r eti re men t ages ar e p rox ied by p roj ect ion s fo r eff ect iv e ex it ag es fr om th e la bou r ma rk et bas ed on C om mis sio n s ervi ces (DG E C F IN ) C oh ort Simu la ti on M od el (C SM ) (r efe ren ce ag e group 5 0-74) and EUROPOP2010. F igures ar e sl ightl y diver ging fr om the 2012 Ag eing Rep ort du e to a d ifferen t r efe re nce ag e group (50-70 in th e 20 12 Ageing R epor t). Da ta not upda te d fo r n on-pee r re viewe d cou n tri es wi th r ec en tly le gis la ted in cr eas es in s tatu tor y re ti rem en t a ges a n d/or r efo rms wi th ef fec ts on ef fec tiv e re ti rem en t a ges ( S ta tus Ma y 201 3). ** *: P op u lat ion -w eigh te d av era ges fo r exp en dit u res , s imp le a ve rag es f or ret ire m en t a ges ( eff ec tiv e an d s tatu to ry) an d b en efi t r at io s a n d ret ire me nt a ge s. Fo r co unt ri es w ith st at ut or y ret ire me nt ag e c or rid ors, th e m ed ian of th e corr id or h as be en ta ke n in to acc ou n t. ****: Eff ectiv e r eti rem ent ag e d ata f or HR not avai labl e sp li t b y gend er . L ates t Euros tat da ta fr om 2009 is shown. LE = r et ire men t a ge lin k to lif e e xpe ct an cy; SF =su stain ab ilit y fac tor P en sio n able earn in gs: Fu ll= Fu ll car ee r, Yo R =Years of r esi de n ce, C on tr=C on tri bu tion s, L as t/B es t= Las t/B es t n u m be r o f yea rs In de xa tio n r u le: P= pr ice , W= w age s, Co L = Co st o f l iv ing, T= Ta xe s. I P R I nd ex f or pe ns io n rev alu at io n. 2010 2030 2060 c h ange 2011 2030 2060 201 1 2030 20 60 201 0 20 30 2 060 2010 2030 206 0 2 010 2 030 20 60 % c h ange BE 11. 1 15. 2 16. 2 5. 1 61. 5 62 .1 62. 1 6 1. 6 62. 3 62. 3 65 ( 60) 6 5 (62) 65 ( 62 ) 65 ( 6 0) 65 ( 62) 65 ( 62) F ul l P /C oL 39. 6 40. 6 37. 7 -4. 8 BG 9. 9 9. 6 11. 1 1. 1 63. 2 64 .7 64. 7 6 1. 5 62. 5 62. 5 63 ( 63) 6 5 (65) 65 ( 65 ) 60 ( 6 0) 63 ( 63) 63 ( 63) F ul l P /W 46. 1 39. 5 37. 8 -18. 1 CZ 9. 1 8. 9 11. 8 2. 7 62. 9 64 .3 65. 6 6 0. 1 62. 6 65. 1 6 2. 2 ( 60) 6 5 (60) 69. 3 (64 .3) 58. 7 ( 5 5. 7) 64 .7 ( 6 0) 6 9. 3 ( 64. 3) F ul l P /W 26. 2 23. 7 25. 4 -3. 0 DK 10. 1 9. 9 8 .9 -1. 1 64. 2 67 .0 67. 2 6 2. 3 65. 5 66. 3 65 ( 60) 6 8 ( 65) 72. 5 ( 69 .5) 65 (6 0) 68 (65) 7 2. 5 ( 69. 5) x Y oR W 35. 8 32. 9 30. 4 -15. 1 DE 10. 8 12. 0 13. 4 2. 6 64. 3 65 .7 65. 7 6 3. 5 65. 3 65. 3 65 ( 63) 6 7 (63) 67 ( 63 ) 65 ( 6 0) 67 ( 63) 67 ( 63) x F ul l W 47. 0 41. 0 38. 5 -18. 1 EE 8. 9 8. 2 7 .7 -1. 1 63. 8 65 .4 65. 4 6 4. 5 65. 0 65. 0 63 ( 60) 6 5 (62) 65 ( 62 ) 61 ( 5 8) 65 ( 62) 65 ( 62) F ul l P /T 38. 7 29. 2 20. 0 -48. 5 IE 7. 5 9. 0 11. 7 4. 1 65. 1 65 .1 65. 1 6 6. 7 66. 5 66. 6 66 ( 65) 6 7 (65) 69 ( 65 ) 66 ( 6 5) 67 ( 65) 69 ( 65) C ont r -EL 13. 6 14. 1 14. 6 1. 0 62. 5 63 .1 64. 0 6 2. 4 62. 9 63. 8 65 ( 60) 68. 8 ( 63. 8) 71. 4 ( 66 .4) 60 (5 5) 68 .8 (63. 8 ) 7 1. 4 ( 66. 4) x F ul l P /G DP 35. 9 35. 1 27. 6 -23. 3 ES 10. 0 10. 0 9 .6 -0. 4 62. 6 66 .0 66. 2 6 3. 9 66. 5 66. 7 65 ( 61) 6 7 ( 63) 67 (63 ) 65 (6 1) 67 (63) 67 ( 63) x L as t 25 IP R 56. 2 50. 3 34. 3 -43. 7 FR 14. 6 14. 9 15. 1 0. 5 60. 1 62 .8 62. 8 6 0. 2 62. 8 62. 8 60-65 ( 6 0) 62-67 ( 62) 62-67 ( 62) 60 -6 5 (60) 6 2-67 (62) 62-67 ( 62 ) x B e s t 35 P 39. 8 35. 2 31. 7 -20. 4 HR 8. 9 8. 3 8 .7 -0. 2 60. 6 60 .6 60. 6 6 0. 6 60. 6 60. 6 65 ( 60) 6 5 (60) 65 ( 62 ) 60 ( 5 5) 65 ( 60) 65 ( 62) F ul l P /W IT 15. 3 14. 5 14. 4 -0. 9 61. 7 66 .1 67. 3 6 1. 4 65. 4 67. 5 65 .3 (-) 67. 8 ( 64. 8) 70. 3 ( 67 .3) 60. 3 ( -) 67 .8 (64. 8 ) 7 0. 3 ( 67. 3) x x F ul l P 48. 5 49. 8 43. 6 -10. 2 CY 7. 6 10. 3 10. 4 2. 8 65. 4 66 .7 67. 4 6 3. 8 65. 9 67. 7 65 ( 63) 6 6 (63) 69 ( 63 ) 65 ( 6 3) 66 ( 63) 69 ( 63) x F ul l P /W 30. 3 32. 2 26. 9 -11. 2 LV 9. 7 6. 0 6 .0 -3. 7 64. 3 65 .4 65. 4 6 3. 8 65. 3 65. 3 62 ( 60) 6 5 (63) 65 ( 63 ) 62 ( 6 0) 65 ( 63) 65 ( 63) x F ul l P LT 8. 6 8. 4 12. 1 3. 5 63. 5 64 .3 64. 3 6 1. 7 63. 8 63. 8 62. 5 ( 57. 5) 6 5 (60) 65 ( 60 ) 60 ( 5 5) 65 ( 60) 65 ( 60) B e s t 25 -38. 7 33. 9 35. 1 -9. 2 LU 9. 2 14. 0 18. 6 9. 4 59. 6 59 .6 59. 6 6 0. 6 60. 5 60. 5 65 ( 57) 6 5 (57) 65 ( 57 ) 65 ( 5 7) 65 ( 57) 65 ( 57) F ul l P /W 58. 7 57. 2 50. 7 -13. 6 HU 11. 9 9. 3 12. 4 0. 5 61. 2 65 .3 65. 3 6 0. 3 64. 8 64. 8 62 ( 60) 6 5 (65) 65 ( 65 ) 62 ( 5 9) 65 ( 65) 65 ( 65) F ul l P 31. 2 27. 7 25. 5 -18. 1 MT 10. 4 10. 4 15. 9 5. 5 61. 3 64 .0 64. 0 6 0. 3 62. 6 62. 6 61 ( 61) 6 5 (61) 65 ( 61 ) 60 ( 6 0) 65 ( 61) 65 ( 61) B e s t 10 P /W 51. 2 43. 2 47. 4 -7. 5 NL 6. 8 7. 9 8 .6 1. 7 64. 6 67 .2 68. 1 6 2. 5 65. 2 66. 2 65 ( 65) 67. 8 ( 67. 8) 69. 8 ( 69 .8) 65 (6 5) 67 .8 (67. 8 ) 6 9. 8 ( 69. 8) x Y oR W AT 14. 1 16. 7 16. 1 2. 0 61. 8 63 .0 63. 1 6 0. 6 62. 5 62. 8 65 ( 62) 6 5 ( 62) 65 (62 ) 60 (6 0) 63 .5 (6 2) 65 ( 62) B es t 40 P 42. 3 41. 1 35. 5 -16. 1 PL 11. 8 10. 3 9 .8 -2. 0 62. 2 66 .0 66. 0 5 8. 8 64. 0 65. 8 65 ( -) 6 7 (65) 67 ( 65 ) 60 ( 5 5) 64 .8 ( 6 2) 67 ( 62) x F ul l P /W 46. 7 39. 4 23. 7 -49. 3 PT 12. 5 13. 2 12. 7 0. 2 64. 5 65 .8 65. 8 6 4. 7 65. 7 65. 7 65 ( 55) 6 6 (55) 66 ( 55 ) 65 ( 5 5) 66 ( 55) 66 ( 55) x F ul l/ B es t 10 P /G D P RO 9. 8 10. 3 13. 5 3. 7 63. 1 64 .0 64. 0 6 1. 2 62. 6 62. 6 64 ( 59) 6 5 (60) 65 ( 60 ) 59 ( 5 4) 63 ( 58) 63 ( 58) F ul l P /( W ) 38. 7 31. 3 26. 9 -30. 5 SI 11. 2 12. 7 17. 0 5. 9 62. 1 63 .8 63. 8 5 9. 7 63. 5 63. 5 63 ( 58) 6 5 (60) 65 ( 60 ) 61 ( 56. 7 ) 65 ( 60) 65 ( 60) B e s t 24 P /W 19. 2 16. 4 16. 3 -15. 1 SK 8. 0 8. 1 10. 6 2. 7 61. 4 62 .6 66. 2 5 8. 7 62. 4 65. 9 62 ( 60) 63. 9 ( 61. 9) 67. 7 ( 65 .7) 57. 9 (5 5. 9) 62 .6 (60. 6 ) 6 3. 9 ( 61. 9) x F ul l P /( W ) 44. 2 35. 5 33. 2 -24. 8 FI 12. 0 15. 6 15. 2 3. 2 63. 4 64 .1 64. 1 6 2. 6 63. 9 63. 9 63-68 (6 2) 63-68 (62) 63-68 ( 62) 63 -6 8 ( 62) 6 3-68 ( 62) 63-68 (62 ) x F ul l P /W 49. 4 48. 2 44. 1 -10. 7 SE 9. 6 10. 1 10. 2 0. 6 65. 1 65 .6 65. 6 6 4. 0 64. 4 64. 4 61-67 (6 1) 61-67 (61) 61-67 ( 61) 61 -6 7 ( 61) 6 1-67 ( 61) 61-67 (61 ) x F ul l W 35. 3 29. 7 25. 6 -27. 7 UK 7. 7 7. 7 9 .2 1. 5 64. 7 64 .9 65. 8 6 3. 3 65. 2 65. 8 65 ( 65) 6 6 (66) 68 ( 68 ) 60 ( 6 0) 66 ( 66) 66 ( 66) C ont r P /W /G DP EA ** * 12. 1 12. 8 13. 4 1. 2 62. 8 64 .4 64. 8 6 2. 3 64. 1 64. 7 64. 1 ( 60. 7) 65. 8 ( 62. 3) 66. 7 ( 63 .2) 62. 2 (5 8. 8) 65 .5 (62. 1 ) 6 6. 6 ( 62. 9) 40. 9 37. 0 32. 5 -20. 3 E U 2 7 *** 11. 3 11. 7 12. 3 1. 0 62. 9 64 .5 64. 8 6 2. 0 63. 9 64. 5 64. 4 ( 60. 8) 66. 1 ( 62. 4) 67. 3 ( 63 .3) 63. 1 (5 9. 8) 66 .0 (62. 4 ) 6 7. 3 ( 63. 3) 42. 9 39. 8 35. 3 -17. 7 Index at ion ru le P ubl ic pens ion ex pend it ur e as % o f G D P E ffe c tiv e r e tir e m ent ag e m a les * * E ffec tiv e r et ir em ent age f e m ales ** S tat u to ry (and earl y ) ret irem ent age - m a le s S tat ut ory ( a n d earl y ) r e tir e m e nt age - fe m a le s B e nef it r a tio (p u b li c pe ns io ns ) LE S F P ens iona bl e e ar n ings ba s e
Generosity-restricting reforms
As an alternative to restrictions in the coverage of a pension system, several other policy approaches can be applied that restrict the generosity of the pension system and thus – ceteris paribus – increase its sustainability. This might especially necessary in countries where benefit ratios are supposed to stay at a relatively high level over the coming decades (see Table 3).
Pensionable earnings reference: Increasing the pensionable earnings base in the direction of full career contributions or from final pay to average pay schemes would increase the pension system sustainability and could be applied in countries where only a share of contributory years or even the final salary are taken into account in the pension formula so far (see Table 3, e.g. France, Spain, Lithuania, Malta, Portugal, Slovenia).
Accrual rates: Accrual rates for public pension entitlements have been adjusted (downsized) in several countries to take into account longer contributory periods and increasing retirement ages. Moreover, in some countries they will decline due to stricter eligibility criteria for pension entitlements or a partial shift to second and third pillar schemes (e.g. in Estonia, Latvia, Lithuania and Slovakia). Yet, in several countries, accrual rates remain rather high also in the long-run (Spain, Luxembourg) (See Annex 6). In general, a lower accrual rate helps to decrease the generosity of the pension system by decreasing replacement rates and thus leads to reduced pension expenditures. Indexation rule: A majority of MS will apply indexation rules of pension entitlements that do not fully reflect a 1:1 relationship with nominal wage increases, i.e. a mix of wage and price or pure price indexation rules (see Table 3). In countries with a pure wage indexation rule or a high share of wages in the indexation formula (e.g. Croatia, Netherlands, Slovenia), a restriction to a mix of wage/price indexation or a pure price indexation would help to push pension expenditures down in the long-run. The same logic applies for valorisation rules of pension contributions.
Sustainability factors: Many MS (e.g. Germany, France, Finland, Italy, Portugal, Slovakia Spain, Sweden and Greece for the supplementary pension) have introduced sustainability factors in their pension systems (see Table 3). These (often automatic) adjustment coefficients are taken into account in the calculation mechanism that determines either the exact amount of pension entitlements or the specific contribution period required to be entitled for a full pension. The factors change the size of the pension benefit, e.g. depending on expected demographic changes such as life expectancy at the time of retirement or changes in the ratio between contributions and pensions. Also the introduction of a closer link between pension contributions and the resulting pension benefits, as expressed in a shift from 'old' (actuarially too generous) DB or point systems to NDC systems (done in Italy, Latvia, Poland, Sweden and Greece for the supplementary pension scheme) can be seen as a sustainability enhancing factor.
In comparison to a retirement age link to life expectancy, higher reductions in future pension spending would potentially materialize with a rule that links pension benefits to longevity gains without adapting statutory retirement ages. However, this would also lead to lower pension levels. If people do not extend their working lives in order to maintain the level of pension benefits, serious adequacy problems may arise.
3.1. COMPARING PENSION CHALLENGES AND COUNTRY-SPECIFIC RECOMMENDATIONS (CSRs) As shown in Table 1 and Table 2, a pension challenge is present in 16 Member States (Belgium, Bulgaria, the Czech Republic, Germany, Croatia, Lithuania, Luxembourg, Malta, the Netherlands, Austria, Poland, Romania, Slovenia and Finland). For another 3 countries (France, Poland and Portugal) with a recommendation to revise certain aspects of their pension systems (see Annex 1), long-term fiscal sustainability in the pension area is not the main concern. Those countries either show a decrease in public pension spending in the long-run up to 2060 (Poland) or only a slight increase (France, likely to be even lower following reforms in 2013 and Portugal). France implemented a reform that increased the full pension contribution period and Poland and Portugal legislated an increase in the statutory retirement age. These reforms have a positive effect on the sustainability of the pension systems.
Moreover, account should be taken of the fact that Slovakia and the Netherlands are borderline cases with respect to pension-related long-term sustainability challenges.7 Both countries have recently legislated strong reforms that introduced a retirement age link to life expectancy gains. Furthermore, Spain has introduced a pension reform in 2013 with a significant sustainability-enhancing impact. In addition, recent and planned measures in the pension field in Member States need to be taken duly into consideration when assessing the extent to which a challenge is present.
4. HEALTH CARE POLICY CHALLENGES
As a result of the analysis of fiscal sustainability challenges above, several countries are seen to face a challenge in the area of health care. In addition to the analysis of health care expenditure (current and projected), a broad set of indicators can be used to look at the performance of the health care system across several of its dimensions. A comparative analysis of these indicators can help understanding what are the possible and more specific areas of health care provision where policy could be adapted to address the sustainability challenges, taken duly into consideration the country-specific circumstances in the health care field.
In order to identify more specific challenges and potential areas for health care policy reform, the assessment framework looks at a set of internationally available and commonly used health and health care-related indicators. These indicators cover the main dimensions of public expenditure on health and the main areas of health care provision: hospital care, ambulatory care, pharmaceuticals and administrative spending. In addition, health status indicators are considered as capturing the potential need for healthcare. Using mainstream statistical tools it is also possible to combine these individual indicators into composite indicators, one for each of the areas of provision and one for the health status indicators. These composite indicators can help summarising the information provided by the individual indicators.
The relative performance of countries is then assessed on the basis of this comprehensive pool of indicators in an attempt to identify specific areas for improvement. An indicator value which is clearly an outlier or is out of line with country peers may suggest a need for improving the performance in the respective areas of health care provision or improving health status.
Note that such an analysis does not necessarily replace a more careful country-specific analysis of the respective health system, which may lead to a more specific definition of challenges and a more specific flagging of reform policies. More extensive information on country-specific features of healthcare systems, their characteristics and country-specific recommendations, can be found in the "Joint EC(ECFIN)-EPC Report on Health Systems". Country-specific recommendations on health care formulated in the last round of the European Semester are available in Annex 2. Examples of a more detailed set of goals, recommendations and measures can be found in the Memoranda of Understanding of Cyprus, Portugal, Greece and Romania.8 A detailed assessment of public expenditure on outpatient pharmaceuticals is provided in the working paper on "Cost-containment policies in public pharmaceutical spending in the EU".9
Health care expenditure – current and projected
Public spending on health care (excluding long-term nursing care) absorbs a significant and growing share of resources (6.9% of GDP in the EU in 2011) (Graph 1).10 In addition, all EU Member States will face strong and growing pressures on their health systems in the coming decades, due to an ageing population and to non-demographic drivers (mostly technological factors). According to the 2012 Ageing Report and the 2012 Fiscal Sustainability Report, public expenditure on health care will rise at a higher rate than GDP growth: public spending on health care is expected to increase by 1.1 pp. of GDP due to ageing-related factors, compensated by some improvement in health status (AWG
7 For a definition of a borderline case, see the notes to Table 2.
8http://ec.europa.eu/economy_finance/publications/occasional_paper/index_en.htm.
9http://ec.europa.eu/economy_finance/publications/economic_paper/2012/ecp461_en.htm
10
The data presented was the latest available and used in the assessment of health care systems at the beginning of 2012. Thus, the presented data (as of Sep. 2014) is not the most recent, as in the meantime data for 2012 has been published.
reference scenario). When taking into account the impact of non-demographic drivers on future spending growth (AWG risk scenario), health care expenditure is expected to increase by 1.7 pp. of GDP from now till 2060. The projected expenditure on health care represents a considerable 30% of the total age-related increase in public spending till 2060.11
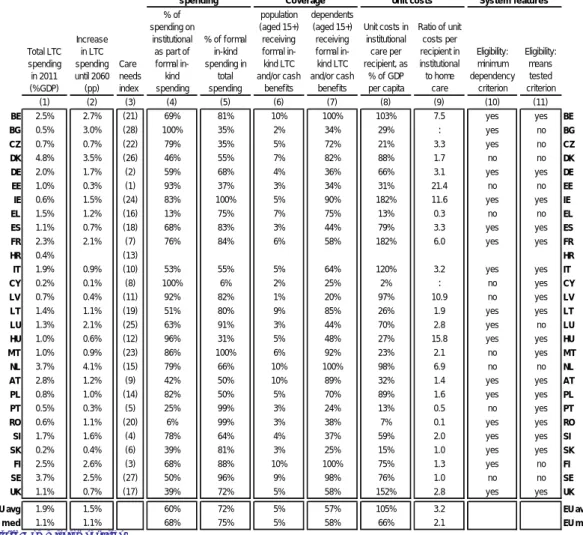
Graph 1: Current (2011) and projected (2011-2060) public expenditure on health
Source: 2012 Ageing Report, Fiscal Sustainability Report 2012, European Commission, own calculations.
Notes: The ranking of the countries deviates from the ranking in the Ageing Report, as the 2011 data has been updated for some countries according to data availability. Data for Croatia includes the projection of long-term care spending based on national sources, as no separate projection for health care and long-term care is available. No risk scenario is available for HR either.
Data excludes spending for long-term nursing care (HC.3 category of the system of health accounts).
The growing importance of public expenditure on health care as a share of GDP and in total government expenditure and the need for budgetary consolidation all across the European Union has brought public expenditure on health care into the spotlight within the policy debate on how to ensure the medium- and long-term sustainability of public finances and in addition to other areas of public spending such as pensions.
In this context, it is important to assess the performance of health systems and identify areas where reforms may be needed to reduce or control expenditure growth through a more efficient use of public resources. In so doing, reforms can increase the cost-effectiveness of public health systems to address pressures in demand and strong resource constraints. While spending on health care can contribute to better health, and therefore add to economic prosperity through higher labour market participation and productivity, it also limits public spending in other areas which can contribute to health and economic growth (education, R&D, poverty reduction). Moreover, health spending appears not to be producing the same value across countries in that countries with similar levels of expenditure have different levels of health.
This has been highlighted by the 2010 Council Conclusions12 on the 2010 EPC-EC (DG ECFIN) Joint Report on health systems in the EU, which recognize the need to strengthen measures aiming at improving value for money and constraining excessive growth in health care spending. The 2010 EPC-EC (DG ECFIN) Joint Report on health systems in the EU has been an important basis for pooling together the indicators used in this thematic assessment framework on health.
Assessing potential areas for policy reform
As said, to identify possible challenges and potential areas for policy reform, a comprehensive set of indicators is used covering public expenditure on health and the main areas of health care provision: hospital care, ambulatory care, pharmaceuticals and administrative spending. In addition, indicators of health status are considered. Individual indicators may also be combined into composite indicators to summarise the pool of information available. Countries are then assessed on the basis of this comprehensive pool of indicators. The aim is to look at the allocation of resources (proxied by
11
An alternative projection method can be explored in Medeiros J., and C. Schwierz (2013). 12 See: http://www.consilium.europa.eu/uedocs/cms_Data/docs/pressdata/en/ecofin/118273.pdf 2.6 3.2 3.7 4.3 4.5 4.5 4.9 6.0 5.4 4.4 5.9 5.8 6.4 6.1 6.0 7.0 6.2 6.0 6.9 4.9 5.6 6.5 6.9 7.2 7.0 7.5 7.7 7.7 6.6 3.6 3.7 4.9 5.3 5.7 6.2 6.5 6.8 6.9 7.0 7.4 7.4 7.5 7.5 8.0 8.2 8.3 8.3 8.3 8.5 8.5 8.5 8.6 8.6 9.1 9.2 9.6 9.7 10.3 -2 0 2 4 6 8 10 12 LV CY LT BG LU EE HU BE NL PL EL SI IT FI IE SE ES CZ DK MT SK PT EU RO AT UK DE FR HR* % of GDP
expenditure and input indicators) across areas of health care provision and then look at how much each system is getting out of those inputs by looking at process and output indicators. However, this is done in a simple and purely descriptive manner; no cost-efficiency or cost-effectiveness analysis is conducted.
Overall, we assess six groups of indicators collected in the following domains: 1) public expenditure on health care; 2) hospital care; 3) ambulatory care; 4) pharmaceutical spending; 5) administrative spending and; 6) health status. A list of the potential individual indicators that can be used to assess health care systems in these areas is available in Annex 7.
1) Public expenditure on health care: Public expenditure on health care is defined as expenditure on health care incurred by state, regional and local government bodies and social security schemes. Expenditure indicators include (a non-exhaustive list): public expenditure on healthcare as % of GDP; projected public expenditure on healthcare as pp. of GDP; public expenditure on healthcare per capita in purchasing power standards (PPS); public in total (private and public) expenditure on healthcare; and public expenditure on healthcare as a share of total government expenditure.
The rationale for looking at spending using these various indicators is to explore the concept of "affordability" by looking at recent expenditure trends and expenditure forecasts (i.e. taking into consideration the impact of ageing and other cost-drivers). In other words, is the country spending "too much" compared to others? Is its expenditure due to increase by more than others? Is this fiscally sustainable? In general, from a fiscal point of view, it can be assumed that higher levels of expenditure on health may place a higher challenge to the fiscal sustainability of health systems and fiscal sustainability in general. It can also be assumed that a growing share of health in total government expenditure may limit the fiscal space for government spending in other economic areas, increasing the fiscal pressure on government budget. Table A.9.1 in Annex 9 provides an overview of the expenditure indicators used. Next to the individual indicators, the ranking of countries (from highest to lowest) is depicted.
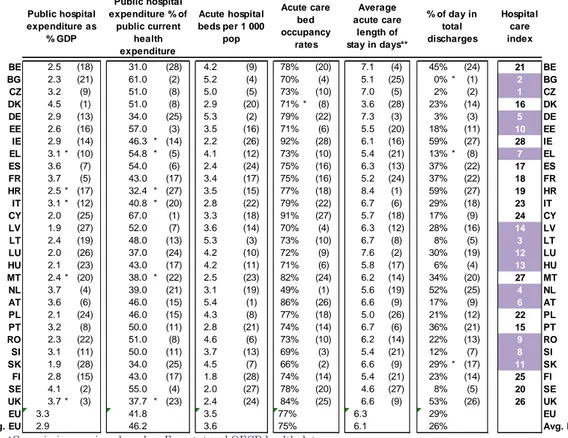
2) Hospital care: Public expenditure on hospital care includes all expenditure by state, regional and local government bodies and social security schemes on hospitals, including general hospitals, mental health, substance abuse hospitals and other specialty hospitals. Public expenditure on hospitals represents a very large share of total public expenditure on health care (on average more than 40%) and has not changed significantly in the past decade despite calls for policy reform that moves health care from hospital to primary and community settings.
Due to the intensity of care provided, hospital care tends to be more expensive than other forms of care such as ambulatory care. This is especially the case for inpatient care, which is defined as all admissions during which patients stay overnight before discharge. However, large treatment variations can be observed within and across Member States i.e. patients are treated differently for the same condition: in some cases as inpatient in others as ambulatory (day-case), in some countries patients stay longer in hospital than in other countries for the same condition. This reflects the fact that hospital care provision and therefore spending depends on numerous factors other than patients' needs or severity of condition. These factors include budgetary incentives associated with hospital remuneration, constraints on hospitals and their staff, lack of competition among providers, lack of monitoring and benchmarking, excess bed capacity and excess equipment for example.
Therefore, assessing the importance (including fiscal importance) of the hospital sector and its performance can be done by using a group of hospital-related indicators of which the most common include: public expenditure on hospital care as % of GDP; public expenditure on hospital care as % of public current health expenditure (CHE); number of acute care beds per 1 000 inhabitants; acute care bed occupancy rate; average length of stay (ALOS) in acute care hospitals; and hospital day cases as a % of all hospital discharges.
The rationale to look at hospital indicators is to try and understand if a particular country system is "too" hospital centred and "too" inpatient centred i.e. if a Member State is potentially using unnecessarily and more expensive hospital resources to treat patient conditions which can be treated in other settings such as primary care or as ambulatory day-cases. Too high spending on hospital care, too low bed occupancy rates, too high ALOS and too small a share of day-cases may provide an indication that efficiency gains can be made through changes in service delivery or changes in incentives that affect service delivery, without a negative impact on patients.
For each country, the indicators are presented alongside their ranking, where a high ranking represents relatively low performance in hospital care relative to the other EU Member States. It is assumed that this correlates with a possible need for improving hospital care. The purple colour is assigned to countries with a level of performance below the EU median. To ease readiness, the individual indicators are further synthesized, also for the other areas of health care spending, (See Table A.9.2 in Annex 9) into one composite index of "hospital care" (see Annex 8 for methodological details). As an example, the results indicate a potential need for policy reform in the area of hospital care in Bulgaria. Bulgaria health care system seems relatively hospital centric: It has one of the highest share of health care spending on hospitals, high hospital bed density, low occupancy rates and an estimated very low level of day discharges. Thus, Bulgaria seems to have some potential to improve allocative efficiency of health spending out from the hospital towards other spending areas of care.
3) Ambulatory care: Ambulatory care, in contrast with inpatient hospital care, refers in general terms to primary care and outpatient secondary care. Primary care is generally understood as the care provided by physicians - usually general practitioners - and nurses, which are the initial point of consultation for patients in a health care system. Secondary care refers to work by medical specialists (e.g. cardiologists, urologists) and often occurs after a referral from a primary care physician. Primary care is usually provided outside of the hospital system, more so than secondary specialist care which in some Member States is mostly delivered in hospital outpatient departments.
The departing point for analysing ambulatory care indicators and notably primary care indicators is that countries with strong ambulatory and notably strong primary care provision may have been successful in reducing costs while maintaining or improving health status. However, if Member States wish to encourage the use of primary care as a means to ensure cost-effective provision of services, then measures have to be implemented to guarantee sufficient numbers and good geographic distribution of trained and practising primary care physicians and nurses.
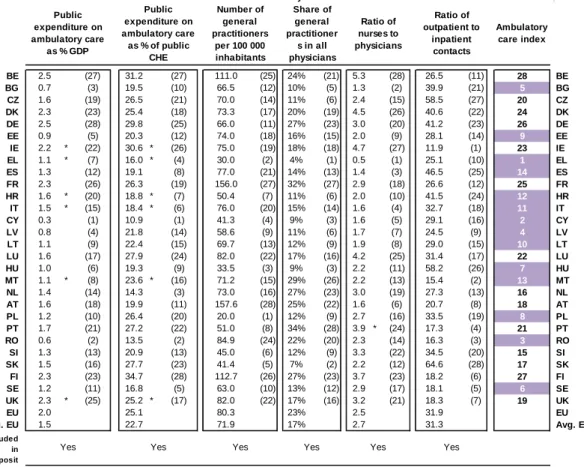
Therefore indicators of ambulatory and primary care include for example: public expenditure on ambulatory care as % of GDP; public expenditure on ambulatory care as % of public current health expenditure (CHE); the number of general practitioners (GPs) per 100 000 inhabitants; the share of general practitioners in all physicians; the ratio of nurses and midwives to physicians; and the ratio of outpatient to inpatient contacts per capita to mention a few. As in the previous section, the individual indicators are synthesized (See Table A.9.3 in Annex 9) into one composite index of "ambulatory care". As an example, the results indicate a potential need for policy reform in the area of ambulatory care in Cyprus: Few resources are spent on ambulatory care and there is a low number of general practitioners and nurses, potentially increasing the need for more costly treatment in the hospital sector.
The rationale for using such types of indicators is as follows. Relatively low numbers of GPs vis-à-vis other physicians and limited access to primary care facilities may result in long-waiting times for primary care consultations. This makes patients seek more expensive specialist and emergency care when not medically necessary (i.e. when in the presence of common illnesses). It also renders referral systems from primary to secondary care less effective and being bypassed by patients. This may result in additional costs, for example, through unnecessary consultations and (duplicated) medical tests, as well as through unnecessary health infections associated with use of hospital care. Low numbers of outpatient contacts may also indicate an unnecessary high supply/use of hospital care.
Therefore, Member States may be able to improve the fiscal sustainability and performance of their health systems by shifting care and therefore costs from hospital to ambulatory care, strengthening the role of and possibly increasing the number of general practitioners relative to specialists, and training and increasing the responsibilities of primary care nurses relative to physicians.
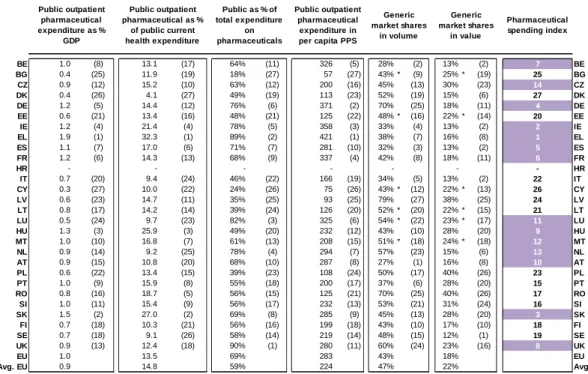
4) Pharmaceutical care: Pharmaceuticals include medicinal preparations, branded and generic medicines, patent medicines, serums and vaccines, vitamins and minerals and oral contraceptives. Demand for pharmaceuticals is sizeable and the potential benefits of pharmaceutical consumption significant. However, these benefits come at a substantial and increasing direct cost. Because pharmaceutical expenditure is increasing, pharmaceutical policies aiming at a cost-effective use of pharmaceuticals and ensuring expenditure control in this area are receiving stronger attention by Member States. Policy makers are growing more aware that, by regulating pharmaceutical markets correctly, savings can be achieved without compromising the quality of care.
Pharmaceuticals are consumed in the inpatient setting (mostly hospitals) and outpatient setting (mostly pharmacies). However, comparable cross-country data on pharmaceutical indicators mostly refers to the outpatient setting (i.e. associated with medicines bought in pharmacies and not those consumed during hospitalisation). Therefore, potential indicators in this area include: public expenditure on outpatient pharmaceuticals as % of GDP; public expenditure on outpatient pharmaceuticals as % of public current expenditure on health; public in total (private and public) expenditure on outpatient pharmaceuticals; public per capita spending on outpatient pharmaceuticals in purchasing power standards; and market share of generics in volume and in value. As in the previous section, the individual indicators are synthesized (See Table A.9.4 in Annex 9) into one composite index of "pharmaceutical spending". As an example, the results indicate a potential need for policy reform in the area of pharmaceutical care in Ireland: Ireland is a relatively high spender on outpatient pharmaceuticals (in terms of the different spending indicators) and has low penetration rates of generic medicines.
Very high spending on pharmaceuticals may point to the need to reform current pharmaceutical policies to improve health system performance while increasing the volume share of generics may help increase the fiscal space for other interventions.
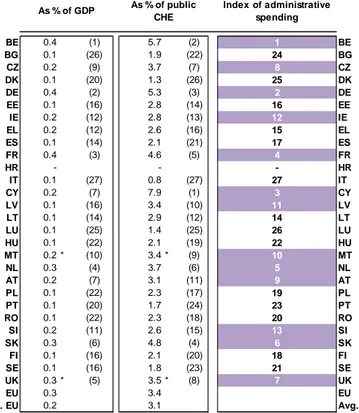
5) Administrative spending: To complement the previous indicators and their assessment, one may also look at the spending allocated to the system administration and insurance both as a share of GDP and a share of total current public spending on healthcare. As in the previous section, the individual indicators are synthesized (See Table A.9.5 in Annex 9) into one composite index of "administrative spending ". Public spending on administration and insurance relates to the expenditure by central and local authorities and social security institutions on activities such as formulation, planning, regulation, co-ordination and monitoring of overall health policies, programmes and budgets and the collection of funds and handling of claims of the delivery system. This is typically a small but non-negligible part of health expenditure. Therefore, high expenditure on administration may suggest the need to simplify/streamline administrative structures and clarify responsibilities across decision-making structures. As an example, the results indicate a potential need for policy reform in the area of administrative spending care in Belgium, spending relatively much on this area of health care spending.
6) Health status: Finally, in addition to assessing particular dimensions of service provision, one may need to look at measures of health status. A poor health status may result in higher demand for health services and therefore spending. Low health status flags the need to improve health which may require health promotion and disease prevention policies or indeed policies outside the health care sector (i.e. suggesting a more holistic Health in All Policies approach to improving health). In addition if a country is also underperforming in certain areas of health care service provision, then there may be a potential to introduce reforms, reduce costs or improve health with the same spending, or do both. As said, the assessment here does not establish an analytical link between health status and health spending, but only highlights possible problems and the potential for improvement.
Potential indicators of health status are many and include the usual objective indicators such as life expectancy at age one, infant mortality or amenable mortality. One may also complement these with other widely available subjective indicators such as self-perceived general health or limitations (see also the section on long-term care). As in the previous section, the individual indicators are synthesized (See Table A.9.6 in Annex 9) into one composite index of "health status". As an example, the results indicate a potential need for improving health status in Latvia. The Latvian population has a relatively low life expectancy, high amenable mortality rates and a high infant mortality rate.
Summarising potential reform areas in healthcare
Based on the comparative approach, as outlined above, one way to summarise the potential policy challenges in each of the areas of health care provision is to use composite indices. These composite indices capture correlations between the various individual indicators in each of these areas using standard statistical methods (see "Handbook of Constructing Composite Indicators", OECD 2008) (see Annex 8 for methodological details). They are constructed for the most relevant areas of public expenditure on health: hospital care, ambulatory care, pharmaceuticals and administrative spending. Values obtained in the composite indices may indicate a specific need to improve the performance in the respective domain relative to other EU Member States.
Table 4 summarizes the results based on a comparison of countries carried out using composite indicators. Cells highlighted in purple correspond to a particular challenge in the respective domain, such as: in 1) to a worse health status; in 2) to a combination of higher hospital expenditure and lower hospital activity; in 3) to a combination of lower expenditure on ambulatory care, lower numbers of GPs per 100 000 inhabitants, lower ratio of GPs and nurses to physicians and lower outpatient activity; in 4) to a combination of higher expenditure on pharmaceuticals, higher pharmaceutical price levels and a lower share of generic medicines in volume; and in 5) to a higher expenditure on administration and insurance. As such and as an example, the results indicate a potential need for policy reform in the area of pharmaceutical and administrative spending in Belgium.
As indicated, these results are based on a broad framework and do not replace a careful country-specific analysis of the respective health care system.13 More extensive information on country-specific features of healthcare systems, their characteristics and country-country-specific recommendations, can be found in the "Joint EC(ECFIN)-EPC Report on Health Systems" by DG ECFIN and the Economic Policy Committee. Therefore, the results developed here should be considered as an initial tool for detecting possible policy challenges the area of health care and do not replace a careful country-specific analysis of the respective health care system. A more detailed assessment based on additional pieces of information, not reviewed in the current framework analysis, may lead to more specific or additional/ different policy challenges.
13
More extensive information on country-specific features of healthcare systems, their characteristics and country-specific recommendations, can be found in the "Joint EC(ECFIN)-EPC Report on Health Systems" by DG ECFIN and the Economic Policy Committee.
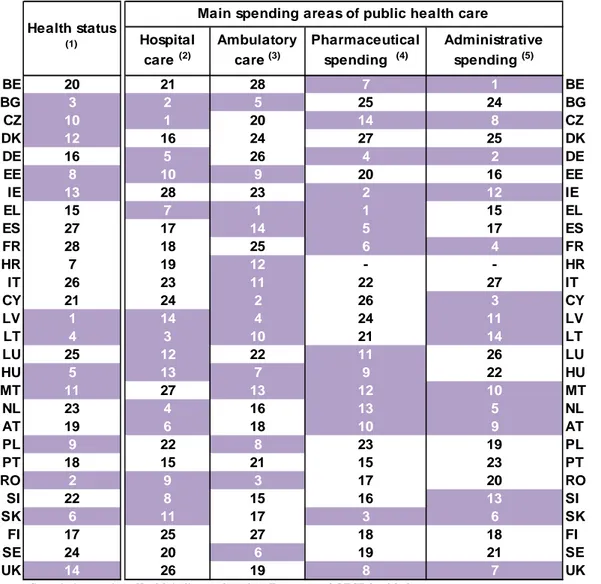
Table 4: Overview of main results: country classification for potential reform areas in healthcare
Source: Commission services. Health indicators based on Eurostat and OECD health data.
Notes: Each composite index is calculated as a weighted average of the individual indicators, as explained above and specified in Annex 9. A higher ranking corresponds: in 1) to a worse health status; in 2) to a combination of higher hospital expenditure and lower hospital activity; in 3) to a combination of lower expenditure on ambulatory care, lower numbers of GPs per 100 000 inhabitants, lower ratio of GPs and nurses to physicians and lower outpatient activity; in 4) to a combination of higher expenditure on pharmaceuticals, higher pharmaceutical price levels and a lower share of generic medicines in volume; and in 5) to a higher expenditure on administration and insurance. All countries above the median (the threshold) in each of the indices are flagged in purple.
(1) Health status index composed of:
Life expectancy at age 1 for females Life expectancy at age 1 for males Amenable mortality
Infant mortality rate per 1 000 life births (2) Hospital care index composed of:
Public hospital expenditure as % of GDP Public hospital expenditure as % of public CHE Acute hospital beds per 1 000 pop
Acute care bed occupancy rates
Average acute care length of stay in days** % of day in total discharges
(3) Ambulatory care index composed of:
Public ambulatory care expenditure as % of GDP Public exp. on ambulatory care as % of public CHE
Number of GPs per 100 000 inhabitants Share of GPs in total number of physicians Ratio of nurses to physicians
Ratio of outpatient to inpatient contacts per capita
(4) Pharmaceutical spending index composed of:
Public outpatient pharmaceutical expenditure as % of GDP
Public exp. on outpatient pharmaceuticals as % of public CHE
Public as % of total expenditure on pharmaceuticals
Expenditure in per capita PPS Generic market shares in volume (5) Administrative spending index composed of:
Public administrative expenditure as % of GDP Public exp. On administration and insurance as % of public CHE. BE 20 21 28 7 1 BE BG 3 2 5 25 24 BG CZ 10 1 20 14 8 CZ DK 12 16 24 27 25 DK DE 16 5 26 4 2 DE EE 8 10 9 20 16 EE IE 13 28 23 2 12 IE EL 15 7 1 1 15 EL ES 27 17 14 5 17 ES FR 28 18 25 6 4 FR HR 7 19 12 - - HR IT 26 23 11 22 27 IT CY 21 24 2 26 3 CY LV 1 14 4 24 11 LV LT 4 3 10 21 14 LT LU 25 12 22 11 26 LU HU 5 13 7 9 22 HU MT 11 27 13 12 10 MT NL 23 4 16 13 5 NL AT 19 6 18 10 9 AT PL 9 22 8 23 19 PL PT 18 15 21 15 23 PT RO 2 9 3 17 20 RO SI 22 8 15 16 13 SI SK 6 11 17 3 6 SK FI 17 25 27 18 18 FI SE 24 20 6 19 21 SE UK 14 26 19 8 7 UK Administrative spending (5) Health status (1)
Main spending areas of public health care Hospital care (2) Ambulatory care (3) Pharmaceutical spending (4)