Science Arts & Métiers (SAM)
is an open access repository that collects the work of Arts et Métiers Institute of
Technology researchers and makes it freely available over the web where possible.
This is an author-deposited version published in: https://sam.ensam.eu
Handle ID: .http://hdl.handle.net/10985/14599
To cite this version :
Corentin DEREURE, R. HALL, Forrest BABER, Didier LOISON, Emilien LESCOUTE, Jean-Pierre
GUIN, Jean Christophe SANGLEBŒUF, Laurent BERTHE, Mariette NIVARD, Ibrahim GUVEN
-Laser induced dynamic fracture of fused silica: Experiments and simulations - Journal of
Non-Crystalline Solids - Vol. 511, p.125-139 - 2019
Any correspondence concerning this service should be sent to the repository
Administrator : archiveouverte@ensam.eu
Laser induced dynamic fracture of fused silica: Experiments and simulations
C. Dereure
a, R. Hall
b, F. Baber
b, D. Loison
a, E. Lescoute
d, J.-P. Guin
a, J.-C. Sangleboeuf
a,
L. Berthe
c, M. Nivard
a, I. Guven
b,⁎aUniv Rennes, CNRS, IPR (Institut de Physique de Rennes)– UMR 6251, F-35000 Rennes, France bMechanical and Nuclear Engineering, Virginia Commonwealth University, Richmond, VA 23284, USA cPIMM, UMR8006 ENSAM, CNRS, CNAM, 151 bd de l'Hôpital, 75013 Paris, France
dCEA, DAM, DIF, 91297 Arpajon, France
A R T I C L E I N F O Keywords: Fused silica Laser shock Laser impact Dynamic fracture Impact dynamics Peridynamics A B S T R A C T
Fused silica samples were subjected to laser induced shock loading. Laserflux was varied in order to obtain different amounts and characteristics of damage in the samples. Three dimensional damage and fracture maps of two identical samples impacted by high and low laserflux values were obtained using both optical microscopy and X-ray computed micro-tomography. Three prevalent fracture and damage patterns were identified. Peridynamic approach was used to simulate the laser impact conditions on the samples in order to explain the causes of the observed fracture and damage morphologies. A proprietary shock physics code, ESTHER, was used to calculate the transient kinetic energy imparted to the samples based on the experimental laserflux values. The kinetic energy values were then integrated over time and provided target values to match for the peridynamic impact conditions. The main fracture patterns were captured by peridynamic simulations with reasonable quantitative accuracy. Explanations for initiation and propagation of each of the fracture patterns were pre-sented based on the peridynamic dynamic fracture simulations. Limitations of the computational approach and recommendations for future work is provided.
1. Introduction
Protection against hypervelocity impacts is a major issue in many fields of applications, among which are the spacecraft industry or the high-power laser facilities. Indeed, meteoroids and space debris can impact satellites at several thousands of kilometres per second, possibly damaging key equipment including optics, solar panels and electronics [1]. Comparably, some instruments equipping the Laser Megajoule (France) or the National Ignition Facility (USA) can be hit by numerous shrapnel and high velocity debris originating from the target [2].
Among the materials potentially subjected to hyper-velocity impact conditions, glasses occupy an important place, as they are widely used in the aforementioned industries. Fused silica (SiO2) in particular is the
basis of many of these glasses. However, studying glass behavior under direct projectile impact loading is a difficult task. Among the difficulties is the brittle nature of glass materials leading to fragmentation and pulverization of the sample. Laser-induced shocks can be used as a surrogate to generate the similar loading conditions [3,4], but with the advantage of allowing to recover the sample for post-mortem analysis. In both cases, the loading generates a shockwave in the material, fol-lowed by an unloading wave (also called rarefaction wave).
Shockwaves can generate permanent densification, which is a well-known phenomenon in quasi-static loading ([5,6]) but is still an on-going work under dynamic conditions ([7,8]). Shockwaves can also generate damage, which has different shapes and positions in the shocked specimen depending on the shooting conditions. Some samples were damaged on the front face, others underwent spalling damage on the rear face, and some were also damaged in their bulk. Spalling da-mage ([9,10]) is caused by the dynamic tension induced inside a sample due to the interaction of the release wave reflected from the free surface with the incident unloading wave. It produces one or several fragments ejected from the free surface. Front-face damage on the other hand is produced by stress gradient on the laser-irradiated zone. Failure waves ([11,12]) can also be observed in some cases of shock-loaded glass. Existing studies on the shock-induced damage in fused silica are mainly about crater formation [13], failure waves and spalling [14], but give no insight on the initiation and propagation of damage inside the ma-terial.
In order to gain a better understanding of the shock behaviour of fused silica, a series of laser shock experiments were performed using the ELFIE facility of the Laboratoire d'Utilisation des Lasers Intenses (LULI) at the French École Polytechnique. Fused silica samples were
⁎Corresponding author.
E-mail address:iguven@vcu.edu(I. Guven).
subjected to laser induced shock and subsequent damage. The shock-waves from laser impacts induced various types of modifications into the silica samples [15]. Two otherwise identical samples were selected for further computational analyses; one was subjected to higher laser flux and the other to lower. The samples were then characterized using optical microscopy and X-ray computed micro-tomography (called “micro-CT” henceforth) for quantification of fractures and damages. A number of distinct damage modes were identified. Peridynamic (PD) approach [16]–[18] was used to quantitatively analyze the damage initiation and propagation in the samples. Peridynamics is a non-local continuum mechanics approach particularly well-suited for exploration of dynamic fracture problems with complex patterns of multiple cracks [19,20]. Explanations for multiple distinct failure patterns were pro-vided using the peridynamic simulations.
The manuscript is organized as follows: Section 2 describes the samples, experimental setup, and characterization methods. A brief introduction to the peridynamic approach, the model used and the description of how the laser impact load is approximated are given in
Section 3. Experimental observations and simulation results are pre-sented inSection 4. Detailed analyses of different failure modes present
in the experiments through peridynamic simulations along with lim-itations of the current approach are given inSection 5. Finally,Section 6covers the conclusions and outlook.
2. Material and methods 2.1. Samples
The samples consisted of fused silica (spectrosil®2000) parallelepi-peds of approximately 8 × 8 mm2and 1.5 to 3 mm thick. Samples were
cut using a diamond saw to these dimensions to be compatible with the loading chamber dimensions. All surfaces were polished with diamond disks followed by diamond suspensions down to one micron size par-ticle. A thin layer (10–15 μm thick) of pure aluminium was vapor de-posited on the front face of each sample as illustrated inFig. 1.
The fused silica samples were coated with a thin layer of aluminium for generation of a plasma cloud. During the laser-aluminium interac-tion, a thin layer of material is ablated into a plasma cloud which ex-pands towards the laser source, generating a shockwave in the silica sample. Compared with other shock-generating methods as plate im-pact, the benefit of laser impulses is that the shock pressure is only applied to the laser-impacted zone followed by its rapid damping during propagation, which allows to reach high pressures without da-maging the glass in a way that it is no more recoverable for post-mortem investigation. Two specific samples were chosen for further computational analyses. The identical samples were shocked by a pi-cosecond laser impulse in different flux domains: One was shocked in the highflux domain (6.01 TW/cm2, later called“sample HF”, and the
other in the lowflux domain (0.61 TW/cm2, later called“sample LF”).
Their thicknesses was 1.84 mm. 2.2. Experimental setup
A shockwave is formed by the expansion of the plasma generated by a laser-matter interaction. In order to have both as much control and repeatability as possible a thin vapor deposited layer of pure aluminium is used for laser-matter interaction. Laser shots were done at the ELFIE national facility (LULI laboratory, Ecole polytechnique, Palaiseau, France). The ELFIE laser source has the following characteristics: a 1057 nm wavelength energy up to 50 J with an impulse whose half width at mid height is 600 ps, focused on a 1.27 mm diameter spot on the front face of the target. Special care was given to avoid any local over-intensity in the laser spot. The pressure against time loading profile on the front face was assessed from one-dimensional laser-matter simulations with Esther code ([21,22]). The laser shot experi-ment takes place under UHV vacuum conditions. The samples were
recovered from laser shot experiments for post-mortem analyses. 2.3. Characterization methods
Optical microscopy was performed using a Keyence VHX 5000 mi-croscope. Micro-CT measurements were conducted with a SkyScan 1173 X-ray to have a complete description of damage in the silica samples impacted by laser. The micro-CT investigation was done with a voxel resolution of 6.5μm and an angle step of 0.2°. During the scan, the X-ray tube voltage and current were set to 80 kV and 80μA, re-spectively. The measurements were executed without anyfilter, and for each scan aflat field correction was applied. Also, in order to enhance the contrast, the HF sample was submerged in a dye penetrant solution for 24 h in primary vacuum conditions prior to the scan. This penetrant was composed of 15 g of zinc iodide, 2.5 ml of distilled water, 2.5 ml of isopropyl and 2.5 ml of Kodak photo solution. The micro-CT scan images were then reconstructed using the NRecon software and the post-processing was performed with CTvox and Data Viewer. 3. Computational simulation method: peridynamics 3.1. Overview
Traditional mechanical simulation formulations are limited in their approach of damage [19]. Damage in a solid generates discontinuities such as crack faces that are not straight-forward to address under the classical continuum mechanics stress-strain formalism. Current problem under consideration requires a simulation method that can handle a large number of concurrently occurring discontinuities that may grow in complex patterns under dynamic conditions, without prior knowl-edge of their origins. In these regards, peridynamic formulation is well-suited for this study, as it is designed to predict damage under dynamic conditions. Therefore peridynamic (PD) approach [16–18] was used in
Fig. 1. Illustration of the experimental setup and of the generation of a shockwave by means of a laser impulse. The sample is placed in a vacuum chamber in which it is impacted by the laser. A thin layer of aluminium is ablated by the laser impact, forming a plasma cloud that expands towards the laser source. The counter-reaction on the sample generates a very high pressure which in turn generates a shockwave.
this study to quantitatively analyze the damage initiation and propa-gation in laser-shocked silica glass. Peridynamic theory is a non-local reformulation of continuum mechanics using integral forms, which removes the mathematical artifacts of singularities arising from spatial derivatives when geometric discontinuities such as cracks or material interfaces are present in the solution domain. The bond-based im-plementation of peridynamics is used in this study, as introduced by Silling [16]. A material point interacts with other material points in its vicinity of afinite radius (δ, horizon); not only the nearest neighbors, but also those that are farther are considered in the family that affects the deformation of a material point (Fig. 2). The mutual influence of
material points beyond each other's horizon is considered to diminish. The horizon parameter is an important part of the non-local formula-tion, allowing a length parameter to be part of the material behavior thus facilitating multi-scale analyses. When the material system under consideration has an underlying heterogeneity such as inclusions or microstructure, the horizon must be sufficiently small such that these features are represented with reasonable accuracy. Additionally, in the absence of material heterogeneity considerations, crack branching during dynamic fracture requires special care for horizon value selec-tion. An extensive discussion on this topic is included in [23]. The equation of motion for a material pointx at time t is written in the following form:
∫
∂ ∂ = − ′ − ′ ′ − + ρ t t t t u T x x x T x x x b x { ( , ; ) ( , ; )} ( , ) H 2 2 (1)whereρ and b denote the mass density and body force vector, respec-tively. In Eq. (1), H is the neighborhood of point x in which the members of its family,x′, are present. The displacement vectorfield u at pointx results from the interaction between the material point x and points x′ due to the pairwise force state vectors T(x, t; x− x′) and
T(x′, t;x′− x). Details of the formulation and their relationships to en-gineering material properties are discussed in great detail in [17,18]. It is worth noting that the term (x− x′) represents the relative position
vector between pointsx and x′. Similarly, a relative displacement vector is calculated in the form of (u′− u) in which u′ is the displacement
vector of the pointx′. Using these definitions, one can define a scalar quantity, termed stretch, between two interacting material pointsx and x′as = − ′ − ′ − − − ′ − ′ s x x u u x x x x |( ) ( )| |( )| |( )| (2)
which is akin to normal strain in classical continuum theory.
The constitutive relationships between the bond force and stretch between material points have been derived for various material models (see [18,24,25] among others). As the solution domain is subjected to external stimuli leading to its deformation, forces and stretches between material points arise. In the current work, a linear-flat relationship
between the bond force and bond stretch is assumed as illustrated in
Fig. 3. In this material model, bond force and stretch are linearly related to each other up to a certain force value after which the bond cannot carry additional load while able to further deform. The deformation of the bond may continue to a value that leads to the termination of the bond; the stretch value scrat this state is called the critical stretch. Silling
and Askari [26] formulated a relationship between the fracture energy G0and bulk modulus K of the material, and its peridynamic critical
stretch as = s G Kδ 5 9 . cr 0 (3) It should be noted that the critical stretch given in Eq.(3)is valid in the general three-dimensional formulation. When the two-dimensional bond-based peridynamic formulation is used, the critical stretch takes the following form (Section 6.1 in [18]):
= s πG Kδ 3 . cr 0 (4) Whether three- or two- dimensional formulation is used, the for-mulae given in Eqs.(3) and (4)are obtained using idealized peridy-namic bond breakage configurations, and meant for providing an in-formed value. Methods for evaluating accurate values of critical stretch in peridynamics is an active research area.
If a bond reaches theflat portion but not the critical stretch, the unloading takes place from its current stretch value following a path parallel to the original loading curve. The input material parameter that decides the force level where theflat portion starts is referred to as, for lack of a better term, yield stress (σy) while recognizing that the current
material model is not a rigorous implementation of plastic behavior. The solution domain is discretized into smaller volumes represented by a material point in the center. The current implementation of the bond-based peridynamics uses cubic volumes of the same size in the entire solution domain. As the domain deforms, bonds exceeding the critical stretch value break permanently, which leads to redistribution of forces to the nearby bonds. In turn, those bonds may also break under the added load. During the peridynamic simulation, the number of bonds connected to each material point is monitored at every time step. A scalar parameter, damage, is defined at every material point such that its value is found by the ratio of number of broken bonds to the initial number of bonds at the material point. At the beginning of a simulation, damage value is zero while a value of unity indicates a material point that is disconnected from all of its original family members. This scalar damage parameter is not sufficient for deciding a crack and crack faces are present in the domain. There must be a group of material points having similar damage values in the form of a continuous curve. Once such a continuity is present in the results, the question of what the value of damage should be that describes a crack face arises. In this study, a value of damage greater than 0.4 is assumed to indicate potential sites
Fig. 2. Two-dimensional illustration of bond-based peridynamics. The horizon value in this case isδ = 3 × grid spacing. The central material point (in red) is linked to all the material points (in green) contained in a δ radius sphere centred on it. (For interpretation of the references to colour in thisfigure le-gend, the reader is referred to the web version of this article.)
for a crack faces. The rationale for using a value smaller than 0.5 is as follows: Consider a material point on a crack face. It represents a small cubic volume with its sides equal to the grid spacing. Prior to crack formation, in its pristine state, this point has all of its bonds intact, emanating from it to all the other material points in its family (those points within the sphere with a radius of horizon). Once the deforma-tion and failure of bonds take place, the material point becomes a crack face by most of its bonds on one side (crack side) being broken while the bonds on the other side remaining intact. Because the material point is assumed to be on the crack face, its bonds that are parallel to the crack plane are also likely to be intact. Therefore more than half of the bonds of a material point on the crack face are likely to be intact, which puts the damage value somewhere between 0.4 and 0.5. If a larger damage value (~0.5) is used to qualify for a material point to be on a crack face, the measured crack lengths would be smaller as compared to those of a damage value less than 0.5. It is important to note that this definition of crack face is a post-processing action and that it does not affect the peridynamic solution.
The material points that are disconnected through bond breakage mayfind themselves on opposing crack faces. This is likely to happen when internal fractures such as those that are the subject of this study are present. The newly formed crack faces must not interpenetrate. In the current implementation, at every time step, the immediate vicinity of each material point is checked for other points that are not connected to the material point under consideration. When this is detected, con-tact conditions take effect. A contact algorithm (Section 10.1.2 of [18]) that calculates the dynamic contact force between material points that are not connected by peridynamic bonds has been implemented. When bonds between material points break, those points interact with each other through this contact condition. The contact detection and force calculations are independent of whether the crack is classified as mode I, II or III. However, the contact algorithm does not include friction in the current implementation.
3.2. Peridynamic model
Peridynamic simulations of both HF and LF samples were performed by using a 2-D rectangular peridynamic grid of spacing 8μm with the horizontal dimension of 6 mm and a vertical dimension of 1.824 mm, as sketched inFig. 4, resulting in nearly 171,000 material points. A hor-izon value of 24.12μm (3.015 times the grid spacing) was selected. For glass materials, the maximum horizon size was suggested by [23] to be within 0.5 mm to 1.5 mm. The physical dimensions of the problem under consideration as well as the fracture-related length parameters characterized in Section 4are considered to be within length scales where the classical continuum mechanics is valid, as discussed by [23]. This means the grid spacing value in conjunction with the horizon se-lection, has little effect on the solution. However, the grid spacing value will dictate the smallest crack lengths that can be resolved in the so-lution. A convergence case study had been performed in the current work to confirm that the main fracture morphologies predicted by a range of grid spacing values were close in size and orientation; the grid spacing size of 8 μm was found to be sufficiently refined while re-maining computationally efficient. The material points located on the cylinder's circumferential vertical boundary are constrained from movement in x and y directions while they are free to move up or down. The rectangular peridynamic domain is entirely comprised of silica
glass to match the experimental conditions. In the simulations, mass density ofρ = 2.2 g/cm3and bulk modulus of K = 36.3 GPa was used for the silica glass [27]. In this study, the stiffness of the peridynamic bonds are identical under tension and compression. However, the bonds are not allowed to fail under compression; bond breakage occurs only under tension. Although the peridynamic material model that was de-scribed in the previous subsection is linearflat, the material behavior for fused silica is specified as linear-only by specifying an arbitrarily large value for yield stress,σy= 24 GPa, that has no physical meaning.
The critical stretch is calculated using Eq.(4) with the fracture energy ranging from 3.7 to 5 J/m2as tabulated in [28]. The fracture energy value of 3.76 J/m2 was found to yield satisfactory results
leading to a critical stretch value of scr= 2.12 × 10⁻³.
3.3. Laser shock loading calculations
As shock pressure and particle velocity are linked through the Hugoniot curve [29], the applied transient velocity was obtained from the laser-matter interaction simulation provided by the Esther code [21,22]. In order to obtain the transient shock pressure and velocity time curves the interaction between the simulated shockwave and the Al-SiO2interface was considered [30].
The one-dimensional materials A and B shown inFig. 5, assumed to be perfectly bonded, are in thermodynamic state 0 (pressure P0= 0 and
particle velocity u0= 0) before matter interaction. After the
laser-matter interaction on material A, due to the shockwave propagation, part of material A is in thermodynamic state 1 (shock pressure P1and
u1), while the rest of the system remains in state 0 as represented in
Fig. 5a. When the shock reaches the A-B interface two equilibrium conditions must be satisfied:
= =
PA P and uB A uB (5)
Because A and B are different materials having different densities (ρAandρB) and sound velocities (CAand CB), they exhibit two different
shock impedances (ZAand ZB, Zi=ρiCiwith i = A, B). This may lead to
two different scenarios:
•
If ZA> ZBthen a shock is transmitted in material B and a releasewave is reflected in material A.
•
If ZA< ZB then a shock is transmitted in material B and anothershock is reflected in material A.
In the current study, material A is vapor deposited aluminium, and material B is silica. Impedances of aluminium and silica are 14.84 kg/s/ cm3 and 12.98 kg/s/cm3, respectively, therefore when the initial
shockwave interacts with the interface a shock is transmitted in silica and a release wave is reflected in the aluminium.
The pressure and velocity values of the thermodynamic state 2 can be determined by utilizing the Hugoniot curve of each material as shown inFig. 5b. Note that inFig. 5b that HF stands for High-Flux and LF stands for Low-Flux. Material A goes from state 1 to state 2 by the reverse Hugoniot curve (HA-). This state 2 also propagates in material B,
initially at state 0, by the Hugoniot curve (HB+). State 2 is defined by
the intersection of (HA-) and (HB+).
As the Hugoniot curve of silica is known from literature data [31–34], from the shock pressures in the aluminium layer computed by the Esther code, transmitted shock pressure in the silica glass samples can be calculated. In the case of HF sample, the shock pressure reached is higher than the values existing in the literature (seeFig. 5b). Thus Hugoniot curve of the silica was extrapolated using a second degree polynomial in order to estimate the pressure level.
The transient velocity values for both samples HF and LF at the laser impact site were then estimated by Esther code as plotted inFig. 6; each curve represents the material velocity at the impact side of the fused silica in the 1-D approach. The bond-based peridynamic approach uti-lized in the current work is not suitable to solve a problem involving
Fig. 4. Two-dimensional peridynamic model domain. The small rectangular region (orange-shaded) on the top side represents the laser-impacted region.
changes in density, pressure and temperature as governed by equations of state. Therefore, mechanical impact was used as a surrogate me-chanism to introduce the laser impact onto the fused silica. This ap-proximation may be considered suitable as laser impulses were already used as surrogate to hypervelocity impacts [4]. The impactor was made of a near-rigid material with a density ofρ = 2.649 g/cm3, a yield stress of σy= 800 MPa, and a bulk modulus of K = 548 GPa. Further, the
impactor was not allowed to fail in an effort to minimize the different mechanisms of energy dissipation associated with the impactor; this simplifies for identifying and keeping track of how the energy is par-titioned during the impact.
The required impactor velocity in peridynamic simulations was found by utilizing the concept of action [35] in conjunction with the Esther simulations. The action S is defined by
∫
∫
= = −
S Ldt (Ec Ep)dt (6)
where t is time, L is the Lagrangian, Ecis the kinetic energy and Epis the
potential energy. The goal is tofind mechanical impact conditions that transfers a certain amount of energy, dictated by Esther simulations, over time to the substrate. Therefore, the definition of action given in Eq.(6)is modified to include only the action of the kinetic energy. It is assumed that the particle velocity of the impact face predicted by Esther is uniformly observed across the laser spot. Based on the particle ve-locity and the duration of the loading, action of the kinetic energy for a single layer of material points underneath the laser spot is found; this quantity is denoted by SEstherHFand SEstherLFfor high and lowflux laser
impact cases, respectively. Peridynamic impact simulations were then performed to match these target action of the kinetic energy values by changing the initial impactor velocities iteratively. In the peridynamic simulations, the kinetic energies of the single layer of material points underneath the laser spot were numerically integrated over time and compared to the target Esther values in each iteration for convergence. The Esther action of kinetic energy values were found to be: SEstherHF= 3.36 × 10⁻¹²Js and SEstherLF= 2.29 × 10⁻¹³Js.
A number of impactor shape profiles were tested to obtain those that captured most of the experimental damage pattern;Fig. 7shows the impactor shapes tested for LF and HF laser impact cases. Uniformly distributed impactors (a cylinder) led to fracture patterns that are not satisfactory. Impactor profile that is comprised of a solid cylinder combined with a ring having a wider radius, shown in Fig. 8a, was found to capture experimental fracture morphologies observed in HF laser impact case. It is hypothesized that densification at the center of impact disperses mechanical energy simultaneously leading to shearing at the edge of the densified region, which in turn facilitates availability of more energy around the edge to propagate and damage the sample. Incorporation of densification in the model is the subject of another study. Similarly, for the LF impact, the impactor shape profile that captures most closely the experimentally observed damage is presented inFig. 8b. The impactor profiles used in the peridynamic analyses for
LF and HF are different. In actuality, the difference between the spa-tiotemporal distribution of plasma-induced surface pressure might be a significant contributing factor to the differences between the damage morphologies observed in LF and HF samples. In an earlier work [36] plasma images were captured through high speed photography invol-ving different levels of laser intensity. At low laser intensity, a uni-formly luminous plasma throughout the impact event was observed while the high intensity laser impact led to uniformly luminous plasma in the early stages of the impact event followed by a clear ring for-mation later. A few peridynamic impactor profiles were experimented with using these results as suggestions for a starting point leading to the formations HF given inFig. 8 to be suitable for the problem under
Fig. 5. a) Principle of transmission and reflection of a shockwave when it in-teracts with an interface between two different materials. b) Transmitted shock and reflected release wave in samples High-Flux (HF) and Low-Flux (LF). State 2 in sample HF was determined through extrapolation of the silica glass Hugoniot curve based on literature data.
Fig. 6. Transient velocity profiles that were estimated using ESTER code on the front-face for samples HF and LF.
consideration. Schematics of what the peridynamic impactor con fig-uration for the HF sample would mean in terms of the surface pressure on the sample are presented inFig. 9. The three-dimensional pressure distribution at an instance on the surface is shown inFig. 9a as applied by the peridynamic impactors of Fig. 8a andFig. 9c. A view of the sketch exposing the half-symmetry plane is included in Fig. 9b for clarity. It should be noted that the peridynamic impactors lead to sur-face pressure profiles that are varying in time as schematically shown in
Fig. 9d. Although not sketched, the pressure distribution due to the peridynamic impactor configuration for the LF sample shown inFig. 8b can be constructed both in space and time.
4. Results
4.1. Experimental results
The post mortem analysis of the silica samples revealed that the shocked samples displayed a wide variety of damage types on both the front and the rear faces. Some had both the front and back faces
shattered while some had damage only on their front face; a few had no damage at all. From this set of different experiments two geometrically nearly-identical samples were selected. The difference between the two tests was the energy level of the laser impact. One of the samples was impacted using highflux domain (6.01 TW/cm2, HF sample henceforth) and the other using lowflux domain (0.61 TW/cm2, LF sample
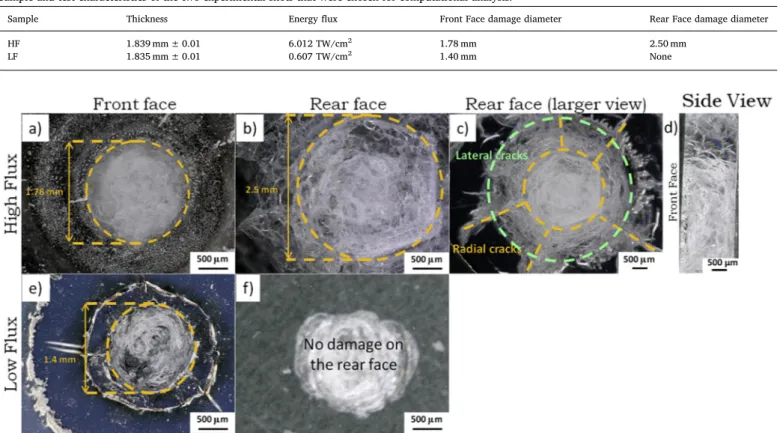
hen-ceforth).Table 1lists the numerical values of energyflux and thickness for each sample. The HF sample was damaged on both front and rear faces while LF sample was only damaged on the front face as presented inFig. 10. The top row of Fig. 10 shows optical microscope images of the front face (Fig. 10a), rear face (Fig. 10b), magnified rear face
(Fig. 10c), and side view (Fig. 10d) of HF sample. Similarly, the bottom row presents the front (Fig. 10e) and rear (Fig. 10f) face images. The diameter of the damaged areas on the front faces of samples HF (Fig. 10a) and LF (Fig. 10e) are 1.78 mm and 1.4 mm, respectively. The rear face of sample HF displays heavy spalling damage, with a 2.5 mm diameter circular area of ejected matter (Fig. 10b and c) with a whi-tened multi-fractured surface. It also has obvious signs of internal da-mage underneath the surface. There is no visible dada-mage neither on the rear face of LF sample nor internally as the front face damage can be readily observed from the back surface (Fig. 10f).Table 1recapitulates the characteristics of both samples HF and LF.
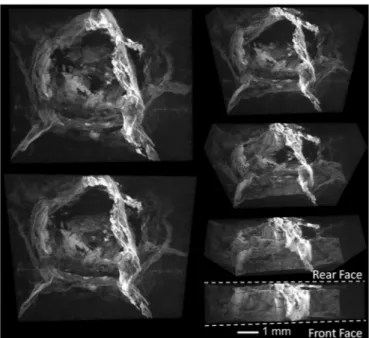
The X-Ray micro-CT scan results for sample HF visualized in 3D from different angles of view inFig. 11, starting from a plan view (top left) progressively changing to a side view (bottom right). The mor-phology presented inFig. 11reveals several internal damage modes in a quantifiable clarity that is not possible using optical microscopy. A specific cross-sectional side view is shown inFig. 12. Underneath both front and rear face damage zones there are two networks of cracks parallel to the faces, labelled as H-cracks to represent horizontal cracks. There is also a system of vertical and tilted cracks that may or may not connect with each other; which are labelled as V-cracks and T-cracks, respectively. It is likely that what are labelled as the (i) horizontal, (ii) vertical, and (iii) tilted cracks are referred to in literature as (i) lateral, (ii) mode II shear, and. (iii) Hertz cone-like cracks, respectively. Nonetheless, they are labelled as H, V and T cracks throughout this manuscript for clarity. In addition to the fractures through the thick-ness, the CT-scan showed the presence of radial cracks initiating along the boundary of the column-shaped zone and propagating towards the free side surfaces. In order to quantify the fracture morphology, a total of eight cross-sections of the HF sample have been examined.Fig. 13
shows the top/plan view of the X-ray micro-CT of the sample on the left with the orientations of the cross-sectional side views shown on the right side of thefigure. In all of these cross-sectional views the hor-izontal, vertical and tilted cracks are present. The vertical central axis in all eight planes are identical. Inspection of the cross-sectional side views at eight planes shows the variability and non-uniformity of the
Fig. 7. Impactor shape profiles explored in search of close correlation against the experimentally observed damage morphologies; left and right columns show LF and HF cases, respectively.
fracture morphology in three dimensions. The quantified characteristics are given in a later subsection (4.3).
4.2. Peridynamic simulation results
Peridynamic simulations of HF and LF samples were performed using the grid and boundary conditions described in Section 3. The damage contours at the end of simulations for HF sample are presented in Fig. 14 with the corresponding samples of different planes from micro-CT shown earlier in Fig. 13. The peridynamic simulation cap-tured the V- and T- cracks as well as the rear-face H-cracks. Although a
considerable amount of front-face damage is predicted, the morphology of the damage is not a perfect match for the experimentally observed front-face damage. One plausible explanation for the mismatch is that the peridynamic simulation does not take into account the equations of state governing the shock conditions dominant in the immediate vici-nity of the laser impact.
The damage contours for LF sample obtained through peridynamic simulation are shown inFig. 15. The simulation predicts damage to the front (impacted) face of the sample with no other damage morphology elsewhere, consistent with the experimental observation.
It is important to note that the simulation results are sensitive to the
Fig. 9. Physical interpretation of the peridynamic impactor loading used in the PD simulations for HF laser impact case: (a) Peridynamic pressure dis-tribution on the sample surface due to the impactors at an instant, (b) cross-sectional view of the sample and the pressurefield, (c) equivalent peridynamic impactors to simulate the nonuniform transient pressure, and (d) schematic representation of time variation of surface pressure.
Table 1
Sample and test characteristics of the two experimental shots that were chosen for computational analysis.
Sample Thickness Energyflux Front Face damage diameter Rear Face damage diameter
HF 1.839 mm ± 0.01 6.012 TW/cm2 1.78 mm 2.50 mm
LF 1.835 mm ± 0.01 0.607 TW/cm2 1.40 mm None
Fig. 10. Optical microscope pictures of the front (left) and rear (middle and right) faces of samples HF (top) and LF (bottom) laser impacts taken with a x100 zoom on pictures a), b), d), e), f) and a x50 zoom on picture c). Picture f) shows only the front-face damage by transparency through the glass, the rear-face being intact. The front and rear-face damages are highlighted by circles. On c) the radial cracks are outlined by dotted lines. The grey areas near the damaged zones on the front-faces on a) and e) are the remnants of the aluminium coating. The damage visible on e) is the internal damage seen by transparency through the side of the whole sample.
impactor shape profiles used. Although the action of the kinetic energy values for different impactor shape profiles match each other (and also the Esther values as described inSection 3.3), the damage predictions may be drastically different. This is demonstrated inFig. 16a for HF laser impact case where damage contour map resulting from a slightly different impactor profile is shown; the action of the kinetic energy value is the same as that ofFig. 14. Similarly for LF laser impact case (Fig. 16b) the solid cylinder impactor profile generates damage map that includes back face manifestation contrary toFig. 15and the ex-periments. The simulations using the impactor shape profiles inFig. 7
produced damage predictions with varying differences against the prediction shown inFigs. 14 and 15, which were deemed to be the most closely correlated with the experimental observations. These results underline the need for further experimental characterization of spa-tiotemporal variation of the surface pressure generated by laser impact.
4.3. Predictions against experiments
The experimentally observed and peridynamic predicted fracture morphologies of HF sample presented inFigs. 13 and 14are similar in terms of general shape. As previously mentioned, V-cracks, T-cracks and rear-face H-cracks are present in both with some differences. The main difference is that the front-face H-cracks are not reproduced by the simulation. Instead the simulated front-face damage is concentrated under the impactors, while some of the material points on the front-face between the impactors are almost intact. This is most likely due to the
actual material behavior in thefirst few micrometers of depth along the front face governed by shock physics equation of state that the simu-lations do not explicitly model.
In order to quantify the damage and fracture characteristics, the horizontal, vertical and tilted cracks are highlighted inFig. 17on the cross-sectional views of micro-CT images presented in Fig. 13. The specific damage characteristics measured are sketched onFig. 18. De-finitions of the parameters shown in Fig. 18 are given inTable 2. Based on these damage characteristics, peridynamic predictions are compared against the experimental measurements as listed in Table 3. The average experimentally measured horizontal crack radius H1 is 1920 μm with the corresponding peridynamic prediction of 1875 μm. The distance between the two opposing starting points of the vertical cracks near the front, H4, is predicted as 2290μm as opposed to the average experimental value of 2874 μm. Another important measure is the distance between the two opposing tilted cracks, H6, which is experi-mentally measured as 1558μm on average compared to the peridy-namic prediction of a range of 1247− 2376 μm. The percent difference between the experiments and predictions for H1, H4 and H6 are cal-culated as 2.4%, 20.3% and 34.4%, respectively. When calculating the percent difference that involves a range of a parameter, the arithmetic average of the minimum and maximum values of that parameter is used. Additionally, the rear face damage depth related distances H2 and H5 as well as the horizontal distance travelled by the rear face hor-izontal crack after it turns towards the free surface, H3, exhibit greater differences between the experiments and simulations. These distances are small compared to the other distances measured (H1, H4 and H6) therefore the differences between the experiments and simulations lead to higher percent difference values. Finally, there are two characteristic angles of interest measured between the vertical axis and (i) the vertical cracks (V1), and (ii) the tilted cracks (T1) as indicated inFig. 18. The percent difference between the experiments and the simulations for V1 and T1 are calculated to be 33.9% and 18.3%, respectively.
The fracture paths identified inFig. 17in the eight vertical planes are combined and plotted on top of each other, shown inFig. 19a, to establish the variability of the damage morphologies observed. In ad-dition, the peridynamic predicted fracture paths are plotted in dark on top of the experimentally observed fracture paths plotted in lighter grey inFig. 19b.
In the case of the LF sample, in both the experiment and simulation, the only damaged zone is located on the front-face, directly under the impact. The diameter is measured in experiment as 1400μm as com-pared to the prediction by the peridynamic simulation as 1120 μm, leading to 25% difference.
The peridynamic approach was able to capture the majority of the experimentally observed damage morphologies qualitatively. The spalled region, the V-cracks, T-cracks and rear-face H-cracks of the HF shot were present, as well as the surface damage zone on the LF sample. In addition, the order of magnitudes of the characteristic dimensions are close to each other. Considering the complexity of the multi-mode damage manifestation in the sample, irregular sample geometry, and uncertainties involved in quantitative understanding of the energy imparted on the sample by the laser plasma explosion, the peridynamic predictions are satisfactory. Simulations of other samples tested under conditions different than the current HF and LF would improve the knowledge and understanding of the laser-matter interaction and
Fig. 11. Rotation of a 3D view of the damage in the bulk of sample HF mea-sured by micro-CT (images done by CTvox). Both front and rear face of the actual sample are not visible. Top left corner: view of the damage from the front surface rotating progressively to a side view in the lower right corner. (Scale bar shown for only the bottom right due to other images having perspective pro-jection– the left column is zoomed in while the right column has the same scale).
Fig. 12. Damage types and dimensions observed on sample HF micro-CT scan. A cross-sectional view in the x2– x3plane, with both front and faces outlined. The front and rear-face surrear-face damage are visible in the centre of the picture and the V, T and H-cracks are labelled.
subsequent damage initiation and propagation. 5. Discussion
Simulations performed using the peridynamic approach provide data for convenient visualisation of the wave propagation and of the damage extent in the grid at multiple time steps. In the following subsections, the shockwaves are visualized by plotting the contours of horizontal (x1) and vertical (x3) velocity components in combination
with the damage contours. These velocity and damage overlapping plots allow exploration of how the propagation of the waves is corre-lated with the initiation and propagation of H-, V- and T- cracks.
The generation of the front-face damage on the simulation of LF sample happens during the impact. The shockwaves that are formed at
this moment reach the rear-face, but their reflection do not generate rear-face damage observed in the HF simulation. Therefore, only the HF sample results are analyzed in the following subsections.
Fig. 13. Micro-CT cross-sections of HF sample. On the left, a top view (x1– x2plane) of the sample is shown with eight different planes passing through x3-axis. On the right, the side views of each of the eight vertical planes with the horizontal, vertical and tilted cracks are presented.
Fig. 14. Damage contours from the peridynamic simulations for the HF sample.
Fig. 15. In HF sample, (a) damage contours from peridynamic simulations, and (b) the fracture morphology observed using micro-CT.
Fig. 16. Damage contours from peridynamic simulations for (a) HF and (b) LF laser impact cases with different impactor shape profiles.
5.1. Initiation of vertical cracks (V-cracks)
Series of plots given inFig. 20show damage and x3vertical velocity
contours under the ring impactor immediately after the beginning of the impact event. The cracks initiate near the edges of the impactor due to shearing in the vertical direction, and propagate downwards. As the elastic waves from multiple contact points between the impactor and the target intersect, a complex system of fractures with a vertical symmetry plane appears directly underneath the impactor. Once the elastic waves initiated by the cylindrical impactor at the center of the top surface arrive and intersect with the existing crack system, a single prominent V-crack appears and propagates downwards. The initial propagation of the V-crack stops approximately 280 ns after the impact.
5.2. Initiation of horizontal cracks (H-cracks)
When the initial shockwave hits the rear-face, damage starts to appear underneath the rear surface. Shock theory [29] states that the interaction between the reflected wave and the incident release wave generates tension, which can itself create spalling. The rear-face frac-ture that appears on the simulation immediately after the reflection of the shockwave is therefore most likely due to this phenomenon. But, as
Fig. 17. Horizontal, vertical and tilted cracks observed in micro-CT scan of HF sample highlighted with thicker lines shown in selected eight vertical planes passing through x3-axis. The orientation of the vertical planes are shown in the top view of the sample on the left.
Fig. 18. Specific parameters defined for quantification of damage character-istics.
Table 2
Descriptions of the parameters defined inFig. 18.
Parameter Description
H1 Radius of the rear face horizontal cracks.
H2 Depth of the rear face horizontal crack measured from the rear face surface.
H3 Horizontal distance between rear face horizontal crack turning point and its intersection with the rear face. H4 Distance between the two opposing starting points of the vertical cracks near the front (impacted) face. H5 Depth of the rear face spalled region measured from the rear face surface.
H6 Distance between the two opposing tilted cracks.
V1 The angle between the vertical cracks and the vertical axis measured near the front (impact) face. T1 The angle between the tilted cracks and the horizontal axis measured near the rear face.
Table 3
Quantified fracture characteristics of HF sample observed in the experiment and corresponding simulation predictions. Definitions of the parameters are given inFig. 18along with their descriptions inTable 2.
Parameter Experiment Simulation % difference H1 1920 ± 212μm 1875μm 2.4% H2 379 ± 11.5μm 246μm 35.2% H3 493 ± 181μm 173μm 184.8% H4 2874 ± 275μm 2290μm 20.3% H5 0–200μm1 69− 118 μm 69.5%2 H6 1558 ± 190μm 1247–2376μm3 34.4%2 V1 19.4 ± 16.2° 14.5° 33.9% T1 62.7 ± 16.8° 53.0° 18.3% 1 The experimental rear-face damage depth is highly heterogeneous, there-fore the range is given.
2 This number was calculated by considering the maximum values of both experiment and simulation.
3
The H6 value in the simulation varies between the V-cracks (lower) and the T-cracks (higher).
seen inFig. 21, after the initial clear spall fracture, a network of thinner cracks appear above it, which are also due to the tension caused by the crossing of the waves. These additional cracks are the H-cracks that slowly grow into those earlier seen inFig. 14.
5.3. Initiation of tilted cracks (T-cracks)
Peridynamic simulations indicate that the T-cracks are extensions of the horizontal cracks (H-cracks). Their initiation points are located at the horizontal extremities of the H-cracks.Fig. 22a shows contours of horizontal (x1) velocity and damage, plotted on top of each other, at
761 ns, marking the beginning of the T-crack initiation. Observation of the wave propagation prior to initiation helps identifying the me-chanism leading to T-cracks curving up;Fig. 22b shows the snapshots of x1velocity and damage contours at 533, 663, 694, 728, 761 and 793 ns.
These cracks appear when two specific waves cross each other: the shockwave initiated on the far right end of the ring-impactor and re-flected on the side, and the release wave initiated on the edge of the central cylindrical impactor (as shown inFig. 22a)). The wave re flec-tion pattern at the V-crack initiaflec-tion time makes it difficult to see the intersection of individual waves clearly. In order to verify this hy-pothesis, the locations of the aforementioned shock and release wave fronts originating at different locations were quantified.
The velocities of these waves were measured in the simulation. The
shockwave front travels at Cs= 5.16 km/s, and the release wave front
at Cr= 3.07 km/s. In order for the two waves to meet at the V-crack
initiation site, they have to cover the distances indicated by arrows in
Fig. 22a. These distances were found to be Ls= 3.581μm ± 0.027
(shockwave initiated on the far end of the ring-impactor and reflected on the side) and Lr= 2.080 ± 0.018μm (the release wave initiated on
the edge of the cylindrical impactor). Based on the measured distances and wave velocities, the predicted times for the waves to arrive at the initiation site were found to beΔts= 0.694 ± 0.005μs for the shock
wave to cover the distance Ls, andΔtr= 0.678 ± 0.006μs for the
re-lease wave to cover Lr. These numbers are compared to the times
be-tween the impact and the moment when the T-cracks start curving up in the peridynamic simulations, which are observed to be Δts, PD= 0.705 ± 0.010 μs for the shockwave, and Δtr, PD= 0.686 ±
0.010μs for the release wave. The difference between the time to T-crack initiation based on the velocity/distance relationship for the shock and release waves and the actual predicted value are within their uncertainty ranges.
5.4. Propagation of vertical and tilted cracks
The mechanisms described inSubsections 5.1 and 5.3are only as-sociated with the initiation of the vertical and tilted cracks. Indeed, the simulation shows that their growth rate is not constant. Instead their growth happens in bursts, with periods when their length is constant and periods when they propagate.
As illustrated inFig. 23a, the V-cracks end their initial extension from t = 280 ns after impact until t = 1424 ns. A growth step is be-tween t = 1424 ns and 1567 ns, after which their growth stops again. The behaviour of the T-cracks follows a similar pattern. Their initial growth stops at t = 793 ns after impact, until t = 923 ns. At this mo-ment they start growing at a steady rate until t = 1242 ns. This is il-lustrated inFig. 23b. After the latest times shown inFig. 23, the wave reflection patterns become highly complicated preventing clear asso-ciation of individual waves and crack propagation steps. But this pro-gression in bursts indicate that the growths of vertical and tilted cracks are due to the meeting of lingering reflected waves. Because of the several cracks and the two-dimensional effects, there are numerous waves propagating in the material. It is hypothesized that meeting of lingering waves in certain directional configurations in the vicinity of an existing crack tip may create favourable conditions for propagation of the V and T-cracks.
Fig. 19. (a) Experimentally observed fracture paths in HF sample on eight vertical planes examined plotted on top of each other, and (b) the peridynamic fracture predictions (dark) plotted on top of the experimentally observed fractures (light grey).
Fig. 20. Time series of a V-crack under the ring-impactor during its initiation. In these plots, the damage parameter is superimposed to the x3velocity of the material points. The indicated time is counted after the impact. Although velocities and damage are displayed using the same LUT the former appears as a half tone background while the damage and notably cracks do appear as a bright blue-green localized contrast, which makes them distinguishable. (For interpretation of the references to colour in thisfigure legend, the reader is referred to the web version of this article.)
6. Conclusion
The mechanisms suggested by the peridynamics simulations give a possible scenario for the generation of the V-cracks, T-cracks and rear-face H-cracks. De Rességuier [37] also observed T-cracks and rear-face H-cracks in soda-lime glass shocked by laser impulse. The H-crack in-itiation mechanism suggested by [37] relates to the spalling phenom-enon in glass. Spalling happens when the release waves 1 and 1′ in
Fig. 24cross each other at the xrposition and generate tension stress
superior to the spall stressσrfor a specific time Δtr, as represented on
the diagrams ofFig. 24. When fracture occurs, the compression waves 2 and 2′ are formed, moving at the speed CL, and “relax” the tension
stresses. In metals these waves are faster than the release waves, and therefore spalling damage is limited to the surrounding of xr(Fig. 24).
But in glasses, the velocity of waves 1 and 1′ presented in [37] is close to the sound speed CL, so relaxation is more progressive. The entire grey
area ofFig. 24is then subjected to an almost identical traction history.
This causes multiple cracking in this zone, and the generation of new compression waves that gradually relax the stresses.
This explanation is in accordance with the peridynamics simulation. Indeed, the H-cracks appear when the initial shockwave interacts with the rear-face. The theory presented in [37] and the simulation show the same phenomena at the same moment.
De Rességuier [37] also proposed an explanation for T-cracks, based on the “crack-branching” phenomenon. It is characteristic of brittle materials, and happens when the propagation speed reaches the max-imum limit. If the traction stress continues to increase, then the crack separates in two secondary cracks, as illustrated inFig. 25. They pro-pagate at a lower speed and with a different angle as compared to the initial direction of the crack.
There is indeed a secondary crack in the CT-scan and on thefinal peridynamic damage that has approximately the same origin point than the T-cracks. But in the crack-branching phenomena the two secondary cracks appear simultaneously. Yet, inFig. 23b, it can be clearly seen
Fig. 21. Initiation of the rear-face H-cracks in the simulation. The damage parameter is superimposed to the x3velocity of the material points to see the shockwave. The shockwave front is clearly seen on the top plot, and the damage starts appearing on the middle plot (377 ns); the indicated time is counted after the impact.
Fig. 22. Mechanisms of the generation of the T-cracks. The damage parameter is superimposed to the x1velocity of the material points to enhance the traction on the horizontal axis. a) View of the whole target to show the general phenomenon. b) Detailed view of the moment when the T-crack starts to curve up. The indicated time is counted after the impact.
that the T-crack appears before the secondary crack. It should be noted that the explanations proposed by De Rességuier in [37] regarding crack branching refer to idealized situations where an already existing crack perpendicular to the direction of a monotonic and persistent loading branches. By the time T-cracks evolve from the H-cracks in the peridynamic simulations, the wave landscape is highly complex and transient, which is likely the case in-situ. While De Rességuier [37] provides valuable insight under highly idealized configurations, its di-rect quantitative application to the problem under consideration may
be questionable. Further, in [37], De Rességuier did not observe ex-tensive front-face damage in laser-impacted soda-lime glass. In his work, the front-face damage is limited to the irradiated surface and a very thin layer under it. This is different from the current observations in silica glass, where the front-face manifests damage even under low flux impulses.
Presence of failure waves was not encountered in experiments or in peridynamics simulations in the current work. According to Brar et al [38] failure waves are specific waves that propagate in a stressed brittle
Fig. 23. Illustration of the non-constant growth rate of the V-cracks (a) and the T-cracks (b). The damage parameter is superimposed to the x1velocity of the material points to enhance the traction on the horizontal axis. All times are counted after the impact.
material, where the material is intact ahead of the wave and commin-uted behind it. They are slower than the shockwave (as illustrated in
Fig. 26). Kanel et al ([12,39]) studied this phenomenon and compared it to a detonation wave. But their exact origin and nature are unknown, and are subject to debate. As none of the shocked samples was re-covered in a pulverised state it is certain that this phenomenon was not observed in the present study.
Overall, the 2-D peridynamics simulation is in good agreement with the experimental results found in this study and in [37]. It revealed that the origin of some of the internal damage (the H-cracks) are caused by the initial shockwave propagation and to the brittleness of the material. On the other hand, the T-cracks are caused by wave reflections on the sides, and are therefore linked to the geometry of the target. Therefore, according to the peridynamic simulations, targets larger than the ones used in this study may have T-cracks with different geometric char-acteristics or may not be present at all. This is the subject of future testing.
The peridynamic implementation used in this study has a number of limitations. First, the temperature effects present in shock events are not represented in the current peridynamic analyses. In addition, rate sensitivity of the material properties including critical stretch is not taken into account. Finally, in the current study, a material is defined by its density, bulk modulus, yield stress and critical stretch. Although some work has been performed in the area of implementation of equations of state in peridynamics [40], current work does not include such formulation. As a result, densification of the silica under shock loading is not represented in the model.
The representation of laser impact loading conditions in a
mechanical simulation remains an open question. In the current work, laser conditions (power, spot size, duration) are used in a 1-D shock physics code to predict the impact surface particle velocity variation. Peridynamic approach was used to provide possible explanations on the specific mechanisms at play in initiation and propagation of different fracture modes. While maintaining relationship with the 1-D shock physics predictions, 2-D peridynamic simulations were able to capture most fracture morphologies observed in the experiments qualitatively, and to a certain degree quantitatively. In order to increase thefidelity of peridynamic approach in its application to laser impact damage problems, a number of additional items should be considered: (1) In-situ measurement of surface velocities, both the impact and free sur-faces if possible, (2) exploration of surface pressure distribution, both in space and in time, during the laser impact, (3) implementation of equation of state behaviour for silica in peridynamic framework in order to be able to take into account the densification behavior, (4) incorporation of rate sensitivity of critical stretch and thermal effects in the peridynamic simulations, and (5) performing peridynamic simula-tions of silica samples impacted under different laser conditions. Acknowledgements
The authors gratefully acknowledge on the one hand the French Agence Nationale de la Recherche for itsfinancial support through the program GLASS ANR-14-CE07-0020 and on the other hand the French ministry for research for a ½ PhD grant support. We would like to ac-knowledge Luli laboratory and specifically the team support of the ELFIE facility for their professionalism and their kindness. We are also in debt for H. Orain for his help regarding the preparation of the glass samples.
References
[1] B.G. Cour-Palais, Career in applied physics: apollo through space station, Int. J. Impact Eng. 23 (1 I) (1999) 137–168.
[2] M. Tobin, et al., Using silica aerogel to characterize hypervelocity shrapnel pro-duced in high power laser experiments, Int. J. Impact Eng. 29 (2003) 713–721. [3] P.E. Nebolsine, Laser simulation of hypervelocity impact, 14th Aerosp. Sci. Meet.
1976, p. 52.
[4] A.N. Pirri, Theory for laser simulation of hypervelocity impact, Phys. Fluids 20 (2) (1977) 221–228.
[5] P.W. Bridgman, I.Šimon, Effects of very high pressures on glass, J. Appl. Phys. 24 (4) (1953) 405–413.
[6] T. Rouxel, H. Ji, T. Hammouda, A. Moréac, Poisson's ratio and the densification of glass under high pressure, Phys. Rev. Lett. 100 (22) (Jun, 2008) 225501. [7] J. Arndt, U. Hornemann, W.F. Müller, Shock-wave densification of silica glass, Phys.
Chem. Glasses 12 (1971) 1–7.
[8] M. Okuno, B. Reynard, Y. Shimada, Y. Syono, C. Willaime, A Raman spectroscopic study of shock-wave densification of vitreous silica, Phys. Chem. Miner. 26 (4) (1999) 304–311.
[9] T. de Rességuier, F. Cottet, Spallation of glass materials under laser induced shocks, J. Phys. IV 4 (1994).
[10] T. de Resseguier, F. Cottet, A. Migault, A 1D model for glass dynamic behaviour under explosive loading, AIP Conf. Proc. 309 (1994) 1071–1074.
[11] G.I. Kanel, Failure waves in shock-compressed glasses, AIP Conf. Proc. vol. 845 II, 2006, pp. 870–875.
[12] G.I. Kanel, et al., Phenomenological description of the failure waves in glasses, AIP Conf. Proc. 955 (2007) 751–754.
[13] Y. Michel, J.M. Chevalier, C. Durin, C. Espinosa, F. Malaise, J.J. Barrau, Hypervelocity impacts on thin brittle targets: experimental data and SPH simula-tions, Int. J. Impact Eng. 33 (1–12) (2006) 441–451.
[14] M.J. Davis, Laser-Shock-Induced Spall and the Intrinsic Strength of Glass, 373 (2016), pp. 364–373.
[15] R. Renou, et al., Investigating ramp wave propagation inside silica glass with laser experiments and molecular simulations, Tech. Mech. 38 (1) (2018) 97–103. [16] S.A. Silling, Reformulation of elasticity theory for discontinuities and long-range
forces, J. Mech. Phys. Solids 48 (1) (2000) 175–209.
[17] S.A. Silling, M. Epton, O. Weckner, J. Xu, E. Askari, Peridynamic states and con-stitutive modeling, 88 (2007) no. 2.
[18] E. Madenci, E. Oterkus, Peridynamic theory and its applications, Springer US, 2014. [19] A. Agwai, I. Guven, E. Madenci, Predicting crack propagation with peridynamics: a
comparative study, Int. J. Fract. 171 (1) (Oct, 2011) 65–78.
[20] B. Kilic, Peridynamic Theory for Progressive Failure Prediction in Homogeneous and Heterogeneous Materials, The University of Arizona, 2008.
[21] J.P. Colombier, P. Combis, F. Bonneau, R. Le Harzic, E. Audouard, Hydrodynamic
Fig. 25. Illustration of the crack-branching phenomenon, which occurs in brittle materials submitted to very high tension stresses. The crack starts on the left edge, and propagates towards the right. It then separates when its propa-gation velocity reaches a certain limit.
Fig. 26. Distance-time diagram (taken from [38]) illustrating the way a failure wave propagates and impacts the other waves in the material.
simulations of metal ablation by femtosecond laser irradiation, Phys. Rev. B Condens. Matter 71 (16) (2005) 1–6.
[22] S. Bardy, et al., Numerical study of laser ablation on Aluminium for shock waves applications development of a suitable model by comparison with recent experi-ments, Opt. Eng. 56 (1) (2016) 1–15.
[23] F. Bobaru, W. Hu, The meaning, selection, and use of the peridynamic horizon and its relation to crack branching in brittle materials, Int. J. Fract. 176 (2) (2012) 215–222.
[24] J.T. Foster, S.A. Silling, W. Chen, Viscoplasticity using peridynamics, Int. J. Numer. Methods Eng. 81 (August 2009) (2010) 1242–1258.
[25] S.A. Silling, R.B. Lehoucq, Peridynamic theory of solid mechanics, Adv. Appl. Mech. 44 (2010) 73–168.
[26] S.A. Silling, E. Askari, A meshfree method based on the peridynamic model of solid mechanics, Comput. Struct. 83 (17–18) (Jun, 2005) 1526–1535.
[27] W. Pabst, E. Gregorová, Elastic properties of silica polymorphs - a review, Ceramics-Silikáty 57 (3) (2013) 167–184.
[28] J.P. Lucas, N.R. Moody, S.L. Robinson, J. Hanrock, R.Q. Hwang, Determining fracture toughness of vitreous silica glass, Scr. Metall. Mater. 32 (5) (1995) 743–748.
[29] M.A. Meyers, Dynamic Behavior of Materials, John wiley and sons (1994). [30] L. Davison, Fundamentals of Shock Wave Propagation in Solids, (2008).
[31] C.L. Mader, et al., P. Staney (Ed.), Los Alamos Series on Dynamic Material Properties, Marsh, 1980.
[32] H. Sugiura, Dynamic response of fused quartz in the permanent densification re-gion, J. Appl. Phys. 52 (5) (1981) 3375.
[33] L.C. Chhabildas, D.E. Grady, Shock loading behaviour of fused quartz, APS Meetings Abstracts, 1983.
[34] C.S. Alexander, L.C. Chhabildas, W.D. Reinhart, D.W. Templeton, Changes to the shock response of fused quartz due to glass modification, Int. J. Impact Eng. 35 (12) (2008) 1376–1385.
[35] L.N. Hand, J.D. Finch, Analytical Mechanics, (1998).
[36] R. Fabbro, P. Peyre, L. Berthe, X. Scherpereel, Physics and applications of laser-shock processing, J. Laser Appl. 10 (6) (1998) 265–279.
[37] T. de Rességuier, Etude expérimentale et numérique du comportement de matériaux de type verre soumis à des ondes de choc, (1993).
[38] S.J. Bless, Failure Waves in Glass, (1992), pp. 1002–1004.
[39] G.I. Kanel, A.A. Bogatch, S.V. Razorenov, Z. Chen, Transformation of shock com-pression pulses in glass due to the failure wave phenomena, J. Appl. Phys. 92 (9) (2002) 5045–5052.
[40] S.A. Silling, M.L. Parks, J.R. Kamm, O. Weckner, M. Rassaian, Modeling Shockwaves and Impact Phenomena with Eulerian Peridynamics, (2017).


![Fig. 24. Schematic representation of the spalling phenomenon (a) in metallic materials and (b) in glass-type materials according to [37].](https://thumb-eu.123doks.com/thumbv2/123doknet/7382437.215665/14.892.148.744.89.575/schematic-representation-spalling-phenomenon-metallic-materials-materials-according.webp)
