1 Title: METABOLIC RESPONSES TO TEMPERATURE STRESS UNDER 1
ELEVATED pCO2 IN THE SLIPPER LIMPET CREPIDULA FORNICATA
2 3
NOISETTE F*, RICHARD J, LE FUR I, PECK LS, DAVOULT D, MARTIN S 4
5 6
NOISETTE Fanny (fanny.noisette@sb-roscoff.fr) 7
LE FUR Ines (Ines.LEFUR@eaurmc.fr) 8
DAVOULT Dominique (davoult@sb-roscoff.fr) 9
MARTIN Sophie (sophie.martin@sb-roscoff.fr) 10
1 Sorbonne universités, UPMC Univ Paris 06, UMR 7144, Station Biologique de Roscoff,
11
Place Georges Teissier, 29680 Roscoff Cedex, France
12
2 CNRS, UMR 7144, Station Biologique de Roscoff, Place Georges Teissier, 29680 Roscoff
13
Cedex, France
14 15
RICHARD Joëlle (Joelle.Richard@univ-brest.fr) 16
3 Université de Bretagne Occidentale, Institut Universitaire Européen de la Mer, Laboratoire
17
des Sciences de l'Environnement Marin (UMR CNRS 6539), Technopôle Brest-Iroise, Place
18
Copernic, F-29280 Plouzané, France.
19
4 Natural Environment Research Council British Antarctic Survey, High Cross, Madingley
20
Road, Cambridge CB3 0ET, United Kingdom
21 22
PECK Lloyd S. (lspe@bas.ac.uk) 23
4 Natural Environment Research Council British Antarctic Survey, High Cross, Madingley
24
Road, Cambridge CB3 0ET, United Kingdom
25 26
Short running head: C. fornicata respiration under high pCO2
27 28 29 30 31 32
* Corresponding author: Fanny NOISETTE
Email: fanny.noisette@sb-roscoff.fr
Postal address: Station Biologique de Roscoff, Place Georges Teissier, 29 680 ROSCOFF (France) Phone number: +33 298292333
2 ABSTRACT
33 34
In the current context of environmental change, ocean acidification is predicted to affect the 35
cellular processes, physiology and behavior of all marine organisms, impacting survival, 36
growth and reproduction. In relation to thermal tolerance limits, the effects of elevated pCO2
37
could be expected to be more pronounced at the upper limits of the thermal tolerance window. 38
Our study focused on Crepidula fornicata, an invasive gastropod which colonized shallow 39
waters around European coasts during the 20th century. We investigated the effects of 10 40
weeks’ exposure to current (380 µatm) and elevated (550, 750, 1000 µatm) pCO2 on this
41
engineer species using an acute temperature increase (1°C 12h-1) as the test. Respiration rates 42
were measured on both males (small individuals) and females (large individuals). Mortality 43
increased suddenly from 34°C, particularly in females. Respiration rate in C. fornicata 44
increased linearly with temperature between 18°C and 34°C, but no differences were detected 45
between the different pCO2 conditions either in the regressions between respiration rate and
46
temperature, or in Q10 values. In the same way, condition indices were similar in all the pCO2
47
treatments at the end of the experiment but decreased from the beginning of the experiment. 48
This species was highly resistant to acute exposure to high temperature regardless of pCO2
49
levels, even though food was limited during the experiment. C. fornicata appears to have 50
either developed resistance mechanisms or a strong phenotypic plasticity to deal with 51
fluctuations of physico-chemical parameters in their habitat. This suggests that this invasive 52
species may be more resistant to future environmental changes compared to its native 53
competitors. 54
55
Keywords: CO2 stress, invasive species, ocean acidification, Q10, respiration, temperate
56
waters 57
3 INTRODUCTION
58 59
As part of global change, ocean acidification is caused by increasing anthropogenic 60
CO2 emissions which have increased since the beginning of the industrial revolution
61
(Solomon et al., 2007). Future pCO2 increases are predicted to reduce the pH of surface
62
waters by 0.3 - 0.4 units by the end of the century (Caldeira & Wickett, 2003). Such decreases 63
will produce changes in carbon and carbonate seawater chemistry through decreased 64
carbonate ion concentrations (CO32-) and a lower calcium carbonate saturation state (Ω).
65
These changes are predicted to have major consequences for marine life (Fabry et al., 2008; 66
Kroeker et al., 2013b) and, especially, could have broad impacts on physiological functions of 67
heterotrophic marine organisms (Pörtner, 2008; Hofmann & Todgham, 2010). 68
The decrease in pH is likely to have a wide range of effects on marine invertebrates 69
via shifts in acid-base homeostasis, changes in metabolism and energy balance (Pörtner et al., 70
2005), leading to effects on somatic growth (Berge et al., 2006; Thomsen & Melzner, 2010), 71
respiration (Melatunan et al., 2011; Schalkhausser et al., 2013), excretion (Liu & He, 2012), 72
calcification (Gazeau et al., 2007; Wood et al., 2008; Watson et al., 2012) or feeding rates 73
(Bamber, 1990; Navarro et al., 2013). Many marine invertebrates exposed to elevated pCO2
74
have exhibited metabolic depression (Willson & Burnett, 2000; Michaelidis et al., 2005; 75
Navarro et al., 2013) as a decrease in respiration rate while others have remained unaffected 76
(Gutowska et al., 2008; Lannig et al., 2010; Clark et al., 2013) or even increased their 77
metabolic rate (Wood et al., 2008; Beniash et al., 2010). These responses are highly species-78
specific and may vary with organism size (Beniash et al., 2010). The resilience of the species 79
studied, and the capacity to regulate metabolism under stressful conditions are also important 80
(Pörtner, 2008). These physiological impacts are likely to have broad effects on the survival, 81
growth and reproduction of marine species (Shirayama & Thornton, 2005; Byrne, 2011), 82
4 which would lead to changes in community structure from altered diversity and abundances 83
(Hale et al., 2011; Kroeker et al., 2013a). 84
These physiological impacts are likely to be modulated by temperature because 85
temperature is a primary driver of physiological function in ectotherms (Hofmann & 86
Todgham, 2010). Increasing temperature affects the rate of all biochemical reactions, and 87
hence cellular processes and physiological functions (Clarke, 1983; Pörtner, 2012), increasing 88
metabolic costs within a limited thermal tolerance window (Peck et al., 2002; Marshall et al., 89
2003). The interactive effects of increased temperature and elevated CO2 concentrations are
90
predicted to impair physiological processes (Clarke, 2003; Pörtner, 2008) by narrowing the 91
thermal tolerance window of the organisms (Metzger et al., 2007; Lannig et al., 2010) and 92
elevating vulnerability to extreme temperature (Schalkhausser et al., 2013). 93
In a context of global change, non-indigenous species are expected to be favored in 94
their introduced area (Dukes & Mooney, 1999; Occhipinti-Ambrogi, 2007) mainly because 95
robustness to abiotic variation is often a trait that determines the success of invasive species 96
(Hellmann et al., 2008; Lenz et al., 2011). Climatic changes in the physical environment will 97
be likely to affect the distribution, spread, abundance, impacts and interactions of species, 98
possibly to the advantage of introduced organisms (Occhipinti-Ambrogi, 2007). Thus our 99
study focused on the response of an invasive Calyptraeidae gastropod living on western 100
European coasts, but which originates from North East America. The slipper limpet, 101
Crepidula fornicata (Linné 1758) was introduced in Europe at the end of the 19th century, 102
mainly with oysters (Crassostrea gigas) which were imported for farming (Blanchard, 1995), 103
and has subsequently colonized European coasts from southern Sweden to southern France 104
(Blanchard, 1997). C. fornicata has significant impacts on biodiversity and ecosystem 105
functioning where it has established (De Montaudouin et al., 1999; Decottignies et al., 2007; 106
Martin et al., 2007). It lives in shallow sites, especially in bays and estuaries where very high 107
5 densities of over one thousand individuals m-2 have been reported (Blanchard, 1995). C. 108
fornicata is known to be strongly resistant to environmental variations, particularly
109
temperature and salinity (Blanchard, 1995; Blanchard, 1997; Diederich & Pechenick, 2013). 110
In light of the different ecological and physiological characteristics of C. fornicata, it is 111
important to investigate the impact of future pCO2 levels, and determine its resistance
112
capacities to high levels of stress to assess the likely future impact of this engineer species in 113
the ecosystems to which it was introduced. 114
The present study was designed to investigate the metabolic responses of C. fornicata 115
to high pCO2 conditions during temperature stress. Short-term experimental approaches using
116
faster temperature elevations than natural changes provide valuable insight into physiological 117
responses of marine invertebrates in term of their ability to resist high levels of stress or their 118
lethal temperature (Sokolova & Pörtner, 2003; Peck et al., 2004; Pörtner et al., 2006; Richard 119
et al., 2012). Following the hypothesis that CO2 stress will increase sensitivity to temperature 120
change, we evaluated changes in oxygen-consumption of C. fornicata individuals previously 121
reared under elevated pCO2 for 10 weeks during a rapid temperature increase (1°C 12h-1).
122
Respiration rates were measured as a proxy for metabolism on males (small individuals) and 123
females (large individuals), as in this species there is sexual dimorphism in size 124
125
MATERIAL & METHODS 126
127
Biological material
128
Crepidula fornicata stacks were collected by SCUBA divers on 4 February 2010, in 129
Morlaix Bay (northwest Brittany, France), at the “Barre des Flots” site (3°53.015'W; 130
48°40.015'N) at a depth of 10 meters and at an in situ temperature of 11.6°C (SOMLIT: 131
Service d’Observation de la Mer et du LITtoral data). They were transferred directly to
6 aquaria at the Station Biologique de Roscoff where they were held in natural unfiltered 133
seawater at a temperature around 10°C, until they were used in experiments starting on 10 134
March 2010. 135
Males and females at the top and the bottom of stacks respectively, were selected, 136
separated and individually labelled. Small males (23.31 ± 0.16 mm length), which were still 137
slightly mobile, were placed individually on 3 cm Petri dishes one month before the beginning 138
of the trials. Dead individual shells at the base of stacks were kept as the substratum under the 139
largest living immobile females (47.53 ± 0.25 mm length). In C. fornicata, size cannot be 140
discriminated from sex because this is a protandrous hermaphroditic organism, changing sex 141
with age and size (Coe 1938). All individuals were gently brushed to remove epibionts and 142
biofilm from their shells before proceeding to the metabolic measurements. 143
Condition indices (CI) were calculated on a pool of 20 specimens in March, before the 144
beginning of the experiment, and on all remaining living and recently dead individuals (male 145
n = 74; female n = 99) at the end of the temperature increase on 29 May 2010. Shell dry 146
weight (DWShell), shell length and tissue dry weight (DWTissue) were determined separately on
147
each individual after drying at 60°C for 48h. Specimens were then ignited in a muffle furnace 148
at 520°C for 6 h, with tissue ash-free dry weight (AFDWTissue) being obtained by difference.
149
CI were calculated as: 150
CI = (AFDWTissue / DWShell) × 100.
151
Mortality was checked daily during the experiment. Individuals with no reaction when 152
the foot was stimulated were classed as dead and removed from the tanks. 153
154
Experimental conditions and set-up
155
After distributing randomly in each of twelve 10-L aquarium tanks comprising the 156
experimental flow-through system (as described in Noisette et al., 2013), 120 males and 120 157
7 females (i.e. 10 individuals of each sex per aquarium) were held under different pCO2
158
conditions between 13 March and 29 May 2010. At the beginning of the experiment, pH was 159
gradually decreased (by bubbling CO2) over four days at 0.1 pH units day-1 from 8.1 until the
160
required pH was reached. Specimens were subsequently held for ten weeks in four different 161
pCO2 conditions: a current pCO2 of 380 µatm (pHT = 8.07), and three elevated pCO2 levelsof
162
550 µatm (pHT = 7.94), 750 µatm (pHT = 7.82) and 1000 µatm (pHT = 7.77). The elevated
163
pCO2 values corresponded to different scenarios predicted by the Intergovernmental Panel on 164
Climate Change (IPCC) for the end of the century (Solomon et al., 2007) and were selected 165
according to the recommendations of Barry et al., (2010). pCO2 was adjusted by bubbling
166
CO2-free air (current pCO2) or pure CO2 (elevated pCO2) in four 100 L header tanks (1 per
167
pCO2 condition) supplied with natural unfiltered seawater pumped from the sea, directly at the 168
foot of the Station Biologique de Roscoff. Seawater was continually delivered by gravity from 169
each header tank to three aquaria per pCO2 condition at a constant rate of 9 L h-1 (renewal
170
rate: 90% total aquarium volume h-1).pCO
2 was monitored and controlled by a feedback
171
system (IKS Aquastar, Karlsbad, Germany) that regulated the addition of gas in the header 172
tanks. pH values of the pH-stat system were adjusted from daily measurements of pH on the 173
total scale (pHT) in the aquaria using a pH meter (HQ40D, Hach Lange, Ltd portable LDOTM,
174
Loveland, Colorado, USA) calibrated using Tris/HCl and 2-aminopyridine/HCl buffers 175
(Dickson et al., 2007). The twelve aquaria were placed in four thermostatic baths where 176
temperature was controlled to ± 0.2 °C using 100 - 150 W submersible heaters. 177
Before the rapid temperature increase experiment, C. fornicata individuals were 178
maintained in the different pCO2 treatments for 10 weeks while temperature was raised
179
successively to mimic the natural rate of temperature change from winter to summer. 180
Temperature was maintained at 10°C from the beginning of the trial to 29 March. It was 181
raised to 13°C from 5 to 19 April and to 16°C from 26 April to 18 May 2010. To reach these 182
8 set levels the temperature was increased by 0.5°C day-1 until the new set temperature was 183
achieved. During the experiment, animals were naturally fed by the phytoplankton provided 184
by unfiltered seawater. 185
The rapid temperature increase experiment was conducted between the 18 and 29 May 186
2010. In all four pCO2 treatments, temperature was increased from 16 to 36°C at 1°C 12h-1. C.
187
fornicata oxygen consumption was measured (see below) both in small and large individuals
188
in the different pCO2 treatments during this rapid temperature increase.
189 190
Seawater parameters
191
Seawater parameters were monitored throughout the experiment. pHT and temperature
192
were recorded daily in each of the 12 aquaria using a pH meter (HQ40D, Hach Lange, Ltd 193
portable LDOTM, Loveland, Colorado, USA). Total alkalinity was determined every 3 weeks 194
by 0.01N HCl potentiometric titration on an automatic titrator (Titroline alpha, Schott SI 195
Analytics, Mainz, Germany). Seawater carbonate chemistry, i.e. exact CO2 partial pressure
196
(pCO2) and saturation state of aragonite were calculated in each pCO2 condition using
197
CO2SYS software (Lewis & Wallace, 1998) using constants from Mehrbach et al., (1973)
198
refitted by Dickson & Millero, (1987). Mean values (± standard error, SE) of the parameters 199
in each pCO2 treatment are presented in Table 1.
200 201
Oxygen consumption measurements
202
During the rapid temperature increase trial (18 - 29 May 2010), oxygen consumption 203
of 6 randomly selected labeled individuals of each sex (2 per aquaria) was measured in each 204
of the pCO2 treatments every two days, at 18, 22, 26, 30 and 34°C. Respiration rates were
205
determined using closed incubations in 75 mL (males) or 180 mL (females) acrylic chambers 206
(Engineering & Design Plastics Ltd, Cambridge, UK) filled with water from the same 207
9 aquarium (see methods in Morley et al., 2007). Chambers were placed in their respective 208
aquaria during incubations to keep the temperature constant. Incubations varied between 1 h 209
and 3 h depending on temperature and were halted before oxygen saturation fell below 80% 210
saturation. Control incubations without animals (n = 1 control incubation / aquarium / 211
measurement) were carried out to allow correction for microbial activity in seawater. 212
Respiration rates were calculated from the differences in measurements of oxygen 213
concentration during trials and controls using a non-invasive fiber-optical system (FIBOX 3, 214
PreSens, Regensburg, Germany) made up of an optical fibre and reactive oxygen spots 215
attached to the inner wall of the chambers. These spots were calibrated with 0% and 100% 216
oxygen buffers made from the manufacturer instructions. 0% O2 buffer was prepared by
217
dissolving 10 g of Na2SO3 in 1 L of seawater and 100% O2 buffer was prepared by bubbling
218
air in 1L of seawater for 20 min to achieve oxygen saturation. Previous experiments had 219
demonstrated that oxygen consumption remained linear during all the incubation periods. 220
Chamber contents were mixed gently by inverting chambers several times before each oxygen 221
measurement. Respiration (R) rates (in µmol O2 g-1 AFDW h-1) were corrected for oxygen
222
consumption in controls and calculated as: 223
R = – (ΔO2 × V) / (Δt × AFDWTissue)
224
where ΔO2 (µmol O2 L-1) is the difference between initial and final O2 concentrations during
225
the incubation, V (L) is the chamber volume minus the individual C. fornicata volume, Δt (h) 226
is the incubation time and AFDWTissue (g) is the tissue ash free dry weight of the slipper
227
limpet incubated. 228
Q10 coefficients were calculated by using the standard equation:
229
Q10 = (RH/ RL) 10 / (TH – TL)
230
where TL and TH were the lowest and highest temperature reached and RL and RH the
231
respiration rates in these temperature respectively. 232
10 233
Statistical analyses
234
All statistical analyses were performed using R version 2.15.0 (R Core Team 2013) 235
and STATISTICA software. A logistic regression (general linear model, GLM) was applied 236
to test the differences in mortalities between the different pCO2 treatments and between sex
237
with temperature as the linear variable. The effects of pCO2, sex and the interaction of these
238
two factors on condition index (CI) at the end of the experiment and on Q10 values were
239
investigated by 2-way analysis of variance (ANOVA). Linear regressions between respiration 240
rates and increasing temperatures were fitted in the four different pCO2 treatments for males
241
and females separately. Differences between pCO2 treatments were explored using an
242
ANCOVA with pCO2 and sex as fixed factors and temperature as co-variable.. Normality was
243
assessed using the Kolmogorov-Smirnov test and Levene’s test was used to ensure that 244
variances were homogenous. All the results are presented as mean ± standard error (SE). 245
246
RESULTS 247
248
Mortality occurred between 34 and 36°C for females and 22 and 36°C for males 249
(Figure 1). There were no significant differences in mortality between the different pCO2
250
treatments (GLM, df = 3, F = 0.680, p = 0.565) or between sex (GLM, df = 1, F = 0.580, p = 251
0.449). Moreover, the interaction between factors pCO2 and sex of the individuals was not
252
significant (GLM, df = 3; F = 0.21; p = 0.888). At pCO2 levels of 380, 550, 750 and 1000
253
µatm, the total mortality at the end of the temperature increase was 29, 19, 19, and 24 for 254
females and 28, 6, 8, and 6 for males . At the end of the acute temperature increase, nearly 255
twice the number of females had died (91) compared with the males (48) (χ² test, p < 0.05), all 256
pCO2 levels included. 257
11 . The mean condition indices before the start and at the end of the experiment are 258
presented on Figure 2. There were no effects of pCO2 , sex or the interaction of these two
259
factors on the condition index at the end of the trial (Table 2). However, the condition index 260
from the beginning of the experiment (3.00 ± 0.27) was different from the mean condition 261
index including all pCO2 conditions (2.11 ± 0.07) at the end of the trial (t-test, df = 181, t =
262
3.159, p = 0.002), which means that CI in both males and females decreased significantly 263
from the start to the end of the experiment (Figure 2). 264
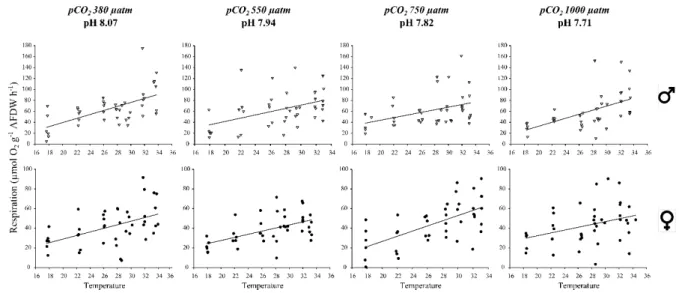
Female respiration rates varied between 0.51 µmol O2 g-1 AFDW h-1 at 18°C and
265
pCO2 of 750 µatm and 91.62 µmol O2 g-1 AFDW h-1 at 32°C and pCO2 of 380 µatm. Males
266
had higher rates, which ranged between 5.13 µmol O2 g-1 AFDW h-1 at 18°C and pCO2 of 380
267
µatm and 175.51 µmol O2 g-1 AFDW h-1 at 32°C and pCO2 of 380 (Figure 3).
268
Relationships between respiration rate and temperature were linear at each pCO2 level
269
(Figure 3). Respiration rose significantly with increasing temperature in all pCO2 treatments,
270
for both males and females (Table 3, all p-values < 0.02). There were no significant 271
differences between the slopes of the different regressions among the pCO2 treatments or
272
between sexes (analysis of slopes, df = 3, F = 1.1, p = 0.346). The intercepts of the different 273
regressions also did not significantly vary among pCO2 (ANCOVA, df = 3, F = 0.350, p =
274
0.789), but there were difference between males and females (ANCOVA, df = 1, F = 62.63, p 275
< 0.001). 276
Q10 values ranged from 1.24 to 2.40 for females and from 1.36 to 2.77 for males
277
among the different pCO2 treatments (Figure 4). There was no significant pCO2 effect on Q10
278
values for either males or females (Table 2). Across all pCO2 treatments, females had
279
significantly lower Q10 values than males with means of 1.61 ± 0.11 and 2.00 ± 0.12 for
280
females and males, respectively (Table 2). The interaction between pCO2 and sex, however,
281
was not significant (Table 2). 282
12 283
DISCUSSION 284
285
Independently of the impact of pCO2 we planned to test, one of the major issues of this
286
study was food limitation which was unintentionally imposed on the C. fornicata individuals 287
in the experiments. This food limitation was detected because of the decrease in condition 288
indices (CI) of both males and females from the beginning to the end of the experiment. Such 289
decreases in CI are usually related to food quantity or quality supplied to organisms (Norkko 290
& Thrush, 2006). Animals were maintained in unfiltered seawater which carried natural 291
phytoplankton at a concentration between 0.2 and 1 µg Chl a L-1 (SOMLIT data). The water 292
renewal in the aquarium was maintained constant at a rate of 0.9 L h-1 (i.e. 90% of the total 293
volume of each aquarium changed per hour). Water supply in our experimental system was 294
likely too low to provide sufficient food for the experimental animals, which thus relied on 295
internal energy reserves and so decreased their CI. A similar outcome was reported for 296
mussels by Mackenzie et al. (2014). 297
The use of stored reserves was similar in the different pCO2 conditions as CI at the end
298
of the experiment did not differ between the different pCO2 treatments, and this was the case
299
for both sexes. Previous studies have shown interspecific variability in the responses of 300
condition indices under high pCO2 levels, ranging from a lack of effect (Cummings et al.,
301
2011; Clark et al., 2013; Sanders et al., 2013) to large changes in condition under high pCO2
302
levels (Hiebenthal et al., 2013; Range et al., 2014). Energy availability is a major component 303
in mitigating the effects of ocean acidification (Pansch et al., 2014). Studies have shown that 304
an abundant food supply might counteract or even overcome the negative effects of high 305
pCO2 on adult and juvenile bivalves (Melzner et al., 2011; Thomsen et al., 2013). Thus, it is 306
important to consider that in this study C. fornicata were under limited food conditions when 307
13 interpreting their metabolic responses to elevated pCO2 conditions during the temperature
308
rise. The data here are representative of conditions where there is temperature stress and food 309
supplies are limited, conditions that can occur in the field. 310
The limitation of food supply was not markedly more important in any of our reduced 311
pH conditions as there were no differences in mortality rates between the different pCO2
312
treatments in C. fornicata males and females., This is a different outcome to that reported for 313
some other mollusk species held in elevated pCO2 levels (Shirayama & Thornton, 2005;
314
Beniash et al., 2010). However, similarly to our study, Pansch et al., (2014) showed that food 315
availability had no impact on mortalities of the barnacle Amphibalanus improvises held in 316
different pCO2 conditions. In the present study, important mortalities started to occur from
317
32°C and they became larger at and above 34°C for both males and females. These values are 318
consistent with the upper lethal temperature recorded for C. fornicata by Diederich & 319
Pechenick, (2013) in a laboratory study investigating a population from Rhode Island, USA, 320
in which only 40% of the adults survived after a 3 h exposure to 34°C, and all died after a 3 h 321
exposure to 36°C. Mortality was higher in females (larger individuals) than in males (small 322
individuals) even if, males started to die at lower temperatures than females. Similarly, Peck 323
et al., (2009) demonstrated for 14 species that smaller species survived to higher temperatures
324
than large ones when temperature was raised at 1°C day-1, and Peck et al. (2013) showed that 325
juveniles had higher upper temperature limits than adults in 4 species of marine invertebrates 326
at warming rates of 1°C day-1 and 1°C 3days-1. The mechanisms setting temperature limits at 327
acute rates of warming may not be energy availability (Peck et al., 2014) and females, which 328
had more energetic reserves than males, may thus have not had an advantage. 329
Despite the decreases in CI, mean respiration rates of C. fornicata at 18°C and pCO2
330
of 380 µatm were 31 and 26 µmol O2 g-1 AFDW h-1 for males and females, respectively,
331
which are close to the middle of the range of in situ values reported for wild individuals from 332
14 the Bay of Brest (Brittany, France) (6 to 63 µmol O2 g-1 AFDW h-1: Martin et al., 2006). This
333
indicates that animals in the experiments here had similar oxygen consumption to wild 334
specimens and were not metabolically depressed under insufficient food supply. In both C. 335
fornicata males and females, respiration rates increased with temperature, as previously
336
demonstrated for this species by Newell & Kofoed, (1977) and most ectotherm metabolic 337
rates are correlated positively with temperature (Cossins & Bowler, 1987). Respiration rates 338
were higher in C. fornicata males than in females regardless of the temperature. Generally, 339
mass-specific respiration rates of small individuals are higher than those of larger ones 340
because metabolic rate (normalized to the biomass) decreases with increasing organisms size 341
(von Bertalanffy, 1951; Parsons et al., 1984). 342
The relationship between oxygen consumption and temperature here for C. fornicata 343
was similar in all the different pCO2 treatments.The slopes and intercepts of the regressions
344
were not significantly different across the four pCO2 conditions which means temperature
345
effect on respiration rate was not affected by the different pCO2 levels in males or females. In
346
constrast to our results, Lannig et al., (2010) found that an acute temperature rise 347
(1.25°C/12h) caused a more rapid increase in metabolic rate in Crassostrea gigas under 348
elevated pCO2 conditions, and there was a synergistic effect of temperature and pCO2. The
349
lack of difference in respiration between animals held in different pCO2 conditions may be
350
related to a stronger ability to up-regulate their metabolism under a temperature stress 351
irrespective of pCO2. Thus, under warming conditions, C. fornicata can generate sufficient
352
energy to cope with any effects of decreased pH (Wood et al., 2010). Q10 values were also
353
similar across pCO2 treatments in both males and females and they were within the expected
354
range of values recorded for marine invertebrates (Branch et al., 1988; Marshall et al., 2003). 355
Even if C. fornicata individuals were food limited, their oxygen consumption remained 356
unaffected by elevated pCO2. A similar lack of pCO2 effect was reported for growth and shell
15 strength of the barnacle A. improvisus (Pansch et al., 2014). In our study, the low food supply 358
did not appear to affect the resistance or resilience of C. fornicata to CO2 stress.
359
Several studies investigating the response of mollusk respiration to elevated pCO2
360
have demonstrated metabolic depression under high pCO2 in both bivalves and gastropods
361
(Michaelidis et al., 2005; Bibby et al., 2007; Fernandez-Reiriz et al., 2011; Melatunan et al., 362
2011; Liu & He, 2012; Navarro et al., 2013). Conversely, others observed no pCO2 effect on
363
mollusk respiration and general metabolism (Gazeau et al., 2007; Marchant et al., 2010; 364
Fernandez-Reiriz et al., 2012; Clark et al., 2013) as reported in our study. In some rare cases, 365
O2 consumption was reported to increase under high pCO2 conditions (Wood et al., 2010;
366
Cummings et al., 2011). The effects of high CO2 concentrations on metabolism appear
367
species-specific and depend on resistance capacities of the organisms (Melzner et al., 2009). 368
It has been widely reported that exposure to environmental high pCO2 levels leads to changes
369
in homeostasis and extracellular acid-base balance counterbalanced by metabolic depression 370
in many cases (Pörtner et al., 2005; Pörtner, 2008), although it should be noted, as above, that 371
metabolic depression is often not seen in high pCO2 conditions. Differences in acid-base
372
regulatory capacities by increasing HCO3- internal concentrations (Michaelidis et al., 2005;
373
Gutowska et al., 2010) or H+ excretion (Pörtner et al., 2005) are taxon specific and are more 374
or less effective in mitigating the effects of hypercapnia. It has also been suggested that 375
organisms could maintain low metabolic rates without controlling internal pH by not using 376
pH-sensitive oxygen-binding pigments (Thomsen et al., 2010; Hiebenthal et al., 2013). Such 377
mechanisms may be crucial factors in explaining the observed variation in sensitivities and 378
resistances of marine invertebrates to elevated pCO2 conditions (Gutowska et al., 2010).
379
It is important to note here that many of the studies to date on the effects of elevated 380
pCO2 on organisms are short-term and acute (e.g. Tomanek et al., 2011), not reflecting the 381
long-term trade off in energy balance and physiological changes associated with acclimation 382
16 of new environmental conditions (Clark et al., 2013). For example, metabolic depression acts 383
as a time-limited compensation strategy to survive unfavorable condition such as high CO2
384
concentrations (Guppy & Withers, 1999; Willson & Burnett, 2000). Because C. fornicata 385
were held for 10 weeks in the different pCO2 treatments in this investigation, it is likely there
386
was enough time for them to acclimate to the new pH, and no difference in oxygen 387
consumption was detected between the different pCO2 conditions. However, the energetic cost
388
likely produced by the negative effects of elevated pCO2 may either be relatively small , or
389
difficult to maintain over longer time periods. This could be seen in impacts on other 390
physiological processes than respiration (Catarino et al., 2012). For example, Bibby et al., 391
(2008) demonstrated that exposure to hypercapnic conditions may compromise the ability to 392
express an immune response in mussels. They showed that Mytilus edulis phagocytosis 393
declined as function of decreased pH. In the same way, Matozzo et al., (2012) showed that 394
elevated pCO2 and temperature may strongly affect haemocyte functionality in the bivalves
395
Chamelea gallina and Mytilus galloprovincialis. Other cellular processes have also been
396
shown to be negatively impacted by high CO2 concentrations, including protein synthesis in
397
the sipunculid Sipunculus nudus (Langenbuch et al., 2006) or enzyme activities in C. gallina 398
and M. galloprovincialis (Matozzo et al., 2013). However, studies of the impact of reduced 399
pH on immune systems have generally been of short duration and it would be interesting to 400
investigate other physiological parameters than respiration (e.g. calcification, protein 401
production, immunity regulation, fertility) in C. fornicata acclimated over several months in 402
the different pCO2 conditions predicted for the end of the century. As a coastal species
403
adapted to relatively large fluctuations of abiotic parameters, C. fornicata in this study were 404
strongly resistant to both elevated pCO2 and increased temperature. Indeed, resistance to high
405
pCO2 levels can also come from pre-acclimation or pre-adaptation to fluctuations in the 406
environment where species live (Burnett, 1997). Species living in environments with large 407
17 abiotic variation have a high phenotypic plasticity which can allow them to survive in 408
stressful conditions (Hofmann & Todgham, 2010). Coastal organisms are more exposed to 409
physico-chemical variations than their open-ocean counterparts that live in more stable 410
thermal and pH environments (Berge et al., 2006; Peck et al., 2006). Species living in shallow 411
waters tolerate not only seasonal and extreme temperature events but also periodic large 412
fluctuations in seawater pH, driven by biological process that sequester and release large 413
amounts of CO2 (Beniash et al., 2010). This exposure to a wide environmental variation has
414
likely led to the evolution of resistance mechanisms to abiotic factors including variations in 415
pCO2 and/or pH (Lannig et al., 2010). 416
C. fornicata is an invasive species which has successfully colonized European coastal
417
shallow waters. This species is likely to have high phenotypic plasticity and resilience to 418
physico-chemical variations that determined its success. Indeed, successful invasive species 419
generally share characteristics that allow them to establish, colonize and expand their range. 420
Among these characteristics, tolerance to environmental stress is one of the most common 421
(Lenz et al., 2011). In a global change context, the movement of physico-chemical conditions 422
away from the optimum increases the energy required by marine species to fuel the extra 423
processes entrained to resist the stresses involved and to maintain homesostasis. This may 424
result in changes in overall physiological condition (Cummings et al., 2011) that could impact 425
ecological processes and community interactions. The high resilience to altered pCO2/low pH
426
levels observed here for C. fornicata may confer a competitive advantage to this invasive 427
species over taxonomically or functionally related species (Lenz et al., 2011). For example, 428
the performance of the scallop Pecten maximus, which is one of the C. fornicata competitors 429
(Thouzeau et al., 2000; Fresard & Boncoeur, 2006), has been shown to be negatively affected 430
by high pCO2 levels (Schalkhausser et al., 2013). These different sensitivities to
431
environmental factors will likely dictate “winners” and “losers” among marine species that 432
18 could lead to a restructuring of benthic communities. With other studies, our data suggest this 433
restructuring could favor invasive species as evidence is building that shows they are more 434
resistant to change than their native competitors (Dukes & Mooney, 1999; Occhipinti-435 Ambrogi, 2007). 436 437 438 439 440 441 ACKNOWLEDGMENTS 442
The authors thank the Marine Operations and Services Department from the Station 443
Biologique de Roscoff for the underwater sampling and the help for system building. This 444
work was supported by the CALCAO project funded from the Region Bretagne, and by the 445
Interreg IVa France (Channel) – England Marinexus project no. 4073 funded by the FEDER 446
programme. It also contributes to the ‘‘European Project on Ocean Acidification’’ (EPOCA) 447
which received funding from the European Community’s Seventh Framework Programme 448
(FP7/2007-2013) under grant agreement n° 211384 449 450 451 452 453 454 455 456 457
19 REFERENCES
458
Bamber R (1990) The effects of acidic seawater on three species of lamellibranch mollusc. 459
Journal of Experimental Marine Biology and Ecology 143: 181-191
460
Barry JP, Tyrrell T, Hansson L, Plattner GK, Gattuso JP (2010) Atmospheric CO2 targets for
461
ocean acidification perturbation experiments. In: Riebesell U. FVJ, Hansson L. & 462
Gattuso J.-P. (ed) Guide to best practices for ocean acidification research and data 463
reporting, Luxembourg: Publications Office of the European Union, pp 260 464
Beniash E, Ivanina A, Lieb NS, Kurochkin I, Sokolova IM (2010) Elevated level of carbon 465
dioxide affects metabolism and shell formation in oysters Crassostrea virginica. 466
Marine Ecology-Progress Series 419: 95-108
467
Berge JA, Bjerkeng B, Pettersen O, Schaanning MT, Øxnevad S (2006) Effects of increased 468
sea water concentrations of CO2 on growth of the bivalve Mytilus edulis L.
469
Chemosphere 62: 681-687
470
Bibby R, Cleall-Harding P, Rundle S, Widdicombe S, Spicer J (2007) Ocean acidification 471
disrupts induced defences in the intertidal gastropod Littorina littorea. Biology Letters 472
3: 699-701 473
Bibby R, Widdicombe S, Parry H, Spicer J, Pipe R (2008) Effects of ocean acidification on 474
the immune response of the blue mussel Mytilus edulis. Aquatic Biology 2: 67-74 475
Blanchard M (1995) Origine et état de la population de Crepidula fornicata (Gastropoda 476
Prosobranchia) sur le littoral français. Haliotis 24: 75-86 477
Blanchard M (1997) Spread of the slipper limpet Crepidula fornicata (L. 1758) in Europe. 478
Current state and consequences. Scientia Marina 61: 109-118 479
Branch GM, Borchers P, Brown CR, Donnelly D (1988) Temperature and food as factors 480
influencing oxygen consumption of intertidal organisms, particularly limpets. 481
American Zoologist 28: 137-146
20 Burnett LE (1997) The challenges of living in hypoxic and hypercapnic aquatic environments. 483
American Zoologist 37: 633-640
484
Byrne M (2011) Impact of ocean warming and ocean acidification on marine invertebrate life 485
history stages: vulnerabilities and potential for persistence in a changing ocean. In: 486
Gibson R, Atkinson R, Gordon J, Smith I, Hughes D (eds) Oceanography and Marine 487
Biology: An Annual Review. Taylor & Francis, pp 1-42
488
Caldeira K, Wickett ME (2003) Anthropogenic carbon and ocean pH. Nature 425: 365-365 489
Catarino AI, Bauwens M, Dubois P (2012) Acid-base balance and metabolic response of the 490
sea urchin Paracentrotus lividus to different seawater pH and temperatures. 491
Environmental Science and Pollution Research 19: 2344-2353
492
Clark MS, Thorne MAS, Amaral A, Vieira F, Batista FM, Reis J, Power DM (2013) 493
Identification of molecular and physiological responses to chronic environmental 494
challenge in an invasive species: the Pacific oyster, Crassostrea gigas. Ecology and 495
Evolution 3: 3283-3297
496
Clarke A (1983) Life in cold water: the physiological ecology of polar marine ectotherms. 497
Oceanography and Marine Biology 21: 341-453
498
Clarke A (2003) Costs and consequences of evolutionary temperature adaptation. Trends in 499
Ecology & Evolution, 18: 573-581.
500
Coe WR (1938) Influence of association on the sexual phases of gastropods having 501
protandric consecutive sexuality I. The Biological Bulletin 75: 274-285 502
Cossins AR, Bowler K (1987) Temperature biology of animals. Chapman and Hall London 503
Cummings V, Hewitt J, Van Rooyen A, Currie K, Beard S, Thrush S, Norkko J, Barr N, 504
Heath P, Halliday NJ, Sedcole R, Gomez A, McGraw C, Metcalf V (2011) Ocean 505
acidification at high latitudes: potential effects on functioning of the antarctic bivalve 506
Laternula elliptica. Plos One 6: e16069
21 De Montaudouin X, Audemard C, Labourg P-J (1999) Does the slipper limpet (Crepidula 508
fornicata, L.) impair oyster growth and zoobenthos biodiversity? A revisited
509
hypothesis. Journal of Experimental Marine Biology and Ecology 235: 105-124 510
Decottignies P, Beninger PG, Rincé Y, Riera P (2007) Trophic interactions between two 511
introduced suspension-feeders, Crepidula fornicata and Crassostrea gigas, are 512
influenced by seasonal effects and qualitative selection capacity. Journal of 513
Experimental Marine Biology and Ecology 342: 231-241
514
Dickson AG, Millero FJ (1987) A comparison of the equilibrium constants for the 515
dissociation of carbonic acid in seawater media. Deep Sea Research 34: 1733-1743 516
Dickson AG, Sabine CL, Christian JR (2007) Guide to best practices for ocean CO2
517
measurements PICES special publication. North Pacific Marine Science 518
Organization, Sidney, British Columbia, pp 176 519
Diederich CM, Pechenik JA (2013) Thermal tolerance of Crepidula fornicata (Gastropoda) 520
life history stages from intertidal and subtidal subpopulations. Marine Ecology-521
Progress Series 486: 173-187
522
Dukes JS, Mooney HA (1999) Does global change increase the success of biological 523
invaders? Trends in Ecology & Evolution 14: 135-139 524
Fabry VJ, Seibel BA, Feely RA, Orr JC (2008) Impacts of ocean acidification on marine 525
fauna and ecosystem processes. Ices Journal of Marine Science 65: 414-432 526
Fernandez-Reiriz MJ, Range P, Alvarez-Salgado XA, Espinosa J, Labarta U (2012) Tolerance 527
of juvenile Mytilus galloprovincialis to experimental seawater acidification. Marine 528
Ecology-Progress Series 454: 65-74
529
Fernandez-Reiriz MJ, Range P, Alvarez-Salgado XA, Labarta U (2011) Physiological 530
energetics of juvenile clams Ruditapes decussatus in a high CO2 coastal ocean. Marine
531
Ecology-Progress Series 433: 97-105
22 Fresard M, Boncoeur J (2006) Costs and benefits of stock enhancement and biological 533
invasion control: the case of the Bay of Brest scallop fishery. Aquatic Living 534
Resources 19: 299-305
535
Gazeau F, Quiblier C, Jansen JM, Gattuso J-P, Middelburg JJ, Heip CHR (2007) Impact of 536
elevated CO2 on shellfish calcification. Geophysical Research Letters 34: 5
537
Guppy M, Withers P (1999) Metabolic depression in animals: physiological perspectives and 538
biochemical generalizations. Biological Reviews of the Cambridge Philosophical 539
Society 74: 1-40
540
Gutowska MA, Melzner F, Langenbuch M, Bock C, Claireaux G, Pörtner H-O (2010) Acid-541
base regulatory ability of the cephalopod (Sepia officinalis) in response to 542
environmental hypercapnia. Journal of Comparative Physiology B 180: 323-335 543
Gutowska MA, Pörtner H-O, Melzner F (2008) Growth and calcification in the cephalopod 544
Sepia officinalis under elevated seawater pCO2. Marine Ecology-Progress Series 373: 545
303-309 546
Hale R, Calosi P, McNeill L, Mieszkowska N, Widdicombe S (2011) Predicted levels of 547
future ocean acidification and temperature rise could alter community structure and 548
biodiversity in marine benthic communities. Oikos 120: 661-674 549
Hellmann JJ, Byers JE, Bierwagen BG, Dukes JS (2008) Five potential consequences of 550
climate change for invasive species. Cinco Consecuencias Potenciales del Cambio 551
Climático para Especies Invasoras. Conservation Biology 22: 534-543 552
Hiebenthal C, Philipp EE, Eisenhauer A, Wahl M (2013) Effects of seawater pCO2 and
553
temperature on shell growth, shell stability, condition and cellular stress of Western 554
Baltic Sea Mytilus edulis (L.) and Arctica islandica (L.). Marine Biology 160: 2073-555
2087 556
23 Hofmann GE, Todgham AE (2010) Living in the now: physiological mechanisms to tolerate a 557
rapidly changing environment. Annual Review of Physiology 72: 127-145 558
Kroeker KJ, Gambi MC, Micheli F (2013a) Community dynamics and ecosystem 559
simplification in a high-CO2 ocean. Proceedings of the National Academy of Sciences
560
110: 12721-12726 561
Kroeker KJ, Kordas RL, Crim R, Hendriks IE, Ramajo L, Singh GS, Duarte CM, Gattuso J-P 562
(2013b) Impacts of ocean acidification on marine organisms: quantifying sensitivities 563
and interaction with warming. Global Change Biology 19: 1884-1896 564
Langenbuch M, Bock C, Leibfritz D, Pörtner H-O (2006) Effects of environmental 565
hypercapnia on animal physiology: A C-13 NMR study of protein synthesis rates in 566
the marine invertebrate Sipunculus nudus. Comparative Biochemistry and Physiology 567
A-Molecular & Integrative Physiology 144: 479-484
568
Lannig G, Eilers S, Pörtner H-O, Sokolova IM, Bock C (2010) Impact of ocean acidification 569
on energy metabolism of oyster, Crassostrea gigas - Changes in metabolic pathways 570
and thermal response. Marine Drugs 8: 2318-2339 571
Lenz M, da Gama BAP, Gerner NV, Gobin J, Groner F, Harry A, Jenkins SR, Kraufvelin P, 572
Mummelthei C, Sareyka J, Xavier EA, Wahl M (2011) Non-native marine 573
invertebrates are more tolerant towards environmental stress than taxonomically 574
related native species: Results from a globally replicated study. Environmental 575
Research 111: 943-952
576
Lewis E, Wallace DWR (1998) Program developed for CO2 system calculations. Carbon
577
Dioxide Information Analysis Center, Oak Ridge National Laboratory, U.S. 578
Department of Energy 579
24 Liu W, He M (2012) Effects of ocean acidification on the metabolic rates of three species of 580
bivalve from southern coast of China. Chinese Journal of Oceanology and Limnology 581
30: 206-211 582
Mackenzie CL, Ormondroyd GA, Curling SF, Ball RJ, Whiteley NM, Malham SK (2014) 583
Ocean warming, more than acidification, reduces shell strength in a commercial 584
shellfish species during food limitation. Plos One 9: e86764 585
Marchant HK, Calosi P, Spicer JI (2010) Short-term exposure to hypercapnia does not 586
compromise feeding, acid-base balance or respiration of Patella vulgata but 587
surprisingly is accompanied by radula damage. Journal of the Marine Biological 588
Association of the United Kingdom 90: 1379-1384
589
Marshall DJ, Perissinotto R, Holley JF (2003) Respiratory responses of the mysid 590
Gastrosaccus brevifissura (Peracarida : Mysidacea), in relation to body size,
591
temperature and salinity. Comparative Biochemistry and Physiology A-Molecular & 592
Integrative Physiology 134: 257-266
593
Martin S, Thouzeau G, Chauvaud L, Jean F, Guérin L (2006) Respiration, calcification, and 594
excretion of the invasive slipper limpet, Crepidula fornicata L.: Implications for 595
carbon, carbonate, and nitrogen fluxes in affected areas. Limnology & Oceanography 596
51: 1996-2007 597
Martin S, Thouzeau G, Richard M, Chauvaud L, Jean F, Clavier J (2007) Benthic community 598
respiration in areas impacted by the invasive mollusk Crepidula fornicata. Marine 599
Ecology-Progress Series 347: 51-60
600
Matozzo V, Chinellato A, Munari M, Bressan M, Marin MG (2013) Can the combination of 601
decreased pH and increased temperature values induce oxidative stress in the clam 602
Chamelea gallina and the mussel Mytilus galloprovincialis? Marine Pollution Bulletin
603
72: 34-40 604
25 Matozzo V, Chinellato A, Munari M, Finos L, Bressan M, Marin MG (2012) First evidence of 605
immunomodulation in bivalves under seawater acidification and increased 606
temperature. Plos One 7: e33820 607
Mehrbach C, Culberso.Ch, Hawley JE, Pytkowic RM (1973) Measurement of apparent 608
dissociation-constants of carbonic-acid in seawater at atmospheric-pressure. 609
Limnology & Oceanography 18: 897-907
610
Melatunan S, Calosi P, Rundle SD, Moody AJ, Widdicombe S (2011) Exposure to elevated 611
temperature and pCO2 reduces respiration rate and energy status in the periwinkle
612
Littorina littorea. Physiological and Biochemical Zoology 84: 583-594
613
Metzger R, Sartoris FJ, Langenbuch M, Pörtner H-O (2007) Influence of elevated CO2
614
concentrations on thermal tolerance of the edible crab Cancer pagurus. Journal of 615
Thermal Biology 32: 144-151 616
Melzner F, Gutowska MA, Langenbuch M, Dupont S, Lucassen M, Thorndyke MC, Bleich 617
M, Pörtner H-O (2009) Physiological basis for high CO2 tolerance in marine
618
ectothermic animals: pre-adaptation through lifestyle and ontogeny? Biogeosciences 6: 619
2313-2331 620
Melzner F, Stange P, Trubenbach K, Thomsen J, Casties I, Panknin U, Gorb SN, Gutowska 621
MA (2011) Food supply and seawater pCO2 impact calcification and internal shell
622
dissolution in the blue mussel Mytilus edulis. Plos One 6: e24223 623
Michaelidis B, Ouzounis C, Paleras A, Pörtner H-O (2005) Effects of long-term moderate 624
hypercapnia on acid-base balance and growth rate in marine mussels Mytilus 625
galloprovincialis. Marine Ecology-Progress Series 293: 109-118
626
Morley SA, Peck LS, Miller AJ, Pörtner HO (2007) Hypoxia tolerance associated with 627
activity reduction is a key adaptation for Laternula elliptica seasonal energetics. 628
Oecologia 153: 29-36
26 Navarro JM, Torres R, Acuña K, Duarte C, Manriquez PH, Lardies M, Lagos NA, Vargas C, 630
Aguilera V (2013) Impact of medium-term exposure to elevated pCO2 levels on the
631
physiological energetics of the mussel Mytilus chilensis. Chemosphere 90: 1242-1248 632
Newell RC, Kofoed LH (1977) Adjustment of components of energy-balance in gastropod 633
Crepidula fornicata in response to thermal acclimation. Marine Biology 44 : 275-286
634
Noisette F, Duong G, Six C, Davoult D, Martin S (2013) Effects of elevated pCO2 on the
635
metabolism of a temperate rhodolith Lithothamnion corallioides grown under different 636
temperatures. Journal of Phycology 49: 746-757 637
Norkko J, Thrush SF (2006) Ecophysiology in environmental impact assessment: implications 638
of spatial differences in seasonal variability of bivalve condition. Marine Ecology 639
Progress Series 326: 175-186
640
Occhipinti-Ambrogi A (2007) Global change and marine communities: Alien species and 641
climate change. Marine Pollution Bulletin 55: 342-352Pansch C, Schaub I, Havenhand 642
J, Wahl M (2014) Habitat traits and food availability determine the response of marine 643
invertebrates to ocean acidification. Global Change Biology 20: 265-277 644
Parsons TR, Takahashi M, Hargrave B (1984) Biological oceanographic processes (3rd ed). In: 645
(Eds) BH (ed), Oxford, pp 330 646
Peck LS, Clark MS, Morley SA, Massey A, Rossetti H (2009) Animal temperature limits and 647
ecological relevance: effects of size, activity and rates of change. Functional Ecology 648
23: 248-256 649
Peck LS, Convey P, Barnes DKA (2006) Environmental constraints on life histories in 650
antarctic ecosystems: Tempos, timings and predictability, Biological Reviews 81: 75-651
109 652
Peck LS, Morley SA, Richard J, Clark MS (2014) Acclimation and thermal tolerance in 653
Antarctic marine ectotherms. Journal of Experimental Biology 217: 16-22 654
27 Peck LS, Pörtner H-O, Hardewig I (2002) Metabolic demand, oxygen supply, and critical 655
temperatures in the Antarctic bivalve Laternula elliptica. Physiological and 656
Biochemical Zoology 75: 123-133
657
Peck LS, Souster T, Clark MS (2013) Juveniles are more resistant to warming than adults in 4 658
species of Antarctic marine invertebrates. PLoS One 8 : e66033 659
Peck LS, Webb KE, Bailey DM (2004) Extreme sensitivity of biological function to 660
temperature in Antarctic marine species. Functional Ecology 18: 625-630 661
Pörtner H-O (2008) Ecosystem effects of ocean acidification in times of ocean warming: a 662
physiologist's view. Marine Ecology-Progress Series 373: 203-217 663
Pörtner H-O (2012) Integrating climate-related stressor effects on marine organisms: unifying 664
principles linking molecule to ecosystem-level changes. Marine Ecology-Progress 665
Series 470: 273-290
666
Pörtner H-O, Langenbuch M, Michaelidis B (2005) Synergistic effects of temperature 667
extremes, hypoxia, and increases in CO2 on marine animals: from Earth history to
668
global change. Journal of Geophysical Research-Oceans 110: C09S10 669
Pörtner H-O, Peck LS, Hirse T (2006) Hyperoxia alleviates thermal stress in the Antarctic 670
bivalve, Laternula elliptica: evidence for oxygen limited thermal tolerance. Polar 671
Biology 29: 688-693
672
R Core Team (2013) R: a language and environment for statistical computing. R Foundation 673
for Statistical Computing, Vienna, Austria 674
Range P, Chicharo MA, Ben-Hamadou R, Pilo D, Fernandez-Reiriz MJ, Labarta U, Marin 675
MG, Bressan M, Matozzo V, Chinellato A, Munari M, El Menif NT, Dellali M, 676
Chicharo L (2014) Impacts of CO2-induced seawater acidification on coastal
677
Mediterranean bivalves and interactions with other climatic stressors. Regional 678
Environmental Change 14 (Suppl 1): S19-S30
28 Richard J, Morley SA, Deloffre J, Peck LS (2012) Thermal acclimation capacity for four 680
Arctic marine benthic species. Journal of Experimental Marine Biology and Ecology 681
424: 38-43 682
Sanders MB, Bean TP, Hutchinson TH, Le Quesne WJF (2013) Juvenile king scallop, Pecten 683
maximus, is potentially tolerant to low levels of ocean acidification when food is
684
unrestricted. Plos One 8: e74118 685
Schalkhausser B, Bock C, Stemmer K, Brey T, Pörtner H-O, Lannig G (2013) Impact of 686
ocean acidification on escape performance of the king scallop, Pecten maximus, from 687
Norway. Marine Biology 160: 1995-2006 688
Shirayama Y, Thornton H (2005) Effect of increased atmospheric CO2 on shallow water
689
marine benthos. Journal of Geophysical Research: Oceans 110 (C09S08): 1-8 690
Sokolova IM, Pörtner H-O (2003) Metabolic plasticity and critical temperatures for aerobic 691
scope in a eurythermal marine invertebrate (Littorina saxatilis, Gastropoda : 692
Littorinidae) from different latitudes. Journal of Experimental Biology 206: 195-207 693
Solomon S, Quin D, Manning M, Chen Z, Marquis M, Averyt K, Tignor M, Miler H (2007) 694
Contribution of working group I to the fourth assessment report of the 695
Intergovernmental Panel on Climate Change, Cambridge University Press, Cambridge, 696
pp 996 697
Thomsen J, Casties I, Pansch C, Kortzinger A, Melzner F (2013) Food availability outweighs 698
ocean acidification effects in juvenile Mytilus edulis: laboratory and field experiments. 699
Global Change Biology 19: 1017-1027
700
Thomsen J, Gutowska MA, Saphorster J, Heinemann A, Trubenbach K, Fietzke J, Hiebenthal 701
C, Eisenhauer A, Kortzinger A, Wahl M, Melzner F (2010) Calcifying invertebrates 702
succeed in a naturally CO2-rich coastal habitat but are threatened by high levels of
703
future acidification. Biogeosciences 7: 3879-3891 704
29 Thomsen J, Melzner F (2010) Moderate seawater acidification does not elicit long-term 705
metabolic depression in the blue mussel Mytilus edulis. Marine Biology 157: 2667-706
2676 707
Thouzeau G, Chauvaud L, Grall J, Guérin L (2000) Rôle des interactions biotiques sur le 708
devenir du pré-recrutement et la croissance de Pecten maximus (L.) en rade de Brest. 709
Comptes Rendus de l'Académie des Sciences - Series III - Sciences de la Vie 323:
815-710
825 711
Tomanek L, Zuzow MJ, Ivanina AV, Beniash E, Sokolova IM (2011) Proteomic response to 712
elevated pCO2 level in eastern oysters, Crassostrea virginica: evidence for oxidative
713
stress. Journal of Experimental Biology 214: 1836-1844 714
von Bertalanffy L (1951) Metabolic types and growth types. The American Naturalist 85: 715
111-117 716
Watson S-A, Peck LS, Tyler PA, Southgate PC, Tan KS, Day RW, Morley SA (2012) Marine 717
invertebrate skeleton size varies with latitude, temperature and carbonate saturation: 718
implications for global change and ocean acidification. Global Change Biology 18: 719
3026-3038 720
Willson LL, Burnett LE (2000) Whole animal and gill tissue oxygen uptake in the Eastern 721
oyster, Crassostrea virginica: effects of hypoxia, hypercapnia, air exposure, and 722
infection with the protozoan parasite Perkinsus marinus. Journal of Experimental 723
Marine Biology and Ecology 246: 223-240
724
Wood HL, Spicer JI, Lowe DM, Widdicombe S (2010) Interaction of ocean acidification and 725
temperature; the high cost of survival in the brittlestar Ophiura ophiura. Marine 726
Biology 157: 2001-2013
30 Wood HL, Spicer JI, Widdicombe S (2008) Ocean acidification may increase calcification 728
rates, but at a cost. Proceedings of the Royal Society B-Biological Sciences 275: 1767-729 1773 730 731 732 733 734 735 736 737 738 739 740 741 742 743 744 745 746 747 748 749 750 751 752 753 754 755 756 757 758 759 760
31 FIGURES CAPTIONS
761 762
Figure1: Cumulated mortalities of males (top) and females (bottom) of Crepidula fornicata 763
during temperature increase. Shading represents the different pCO2 levels at which C. 764
fornicata individuals were held during the experiment.
765
32 Figure 2: Mean (+SE) conditions indices at the beginning (black bar) and at the end of the 767
experiment for Crepidula fornicata females (white bars) and males (grey bars) under the 768
different pCO2. Sample sizes = 10–27.
769 770 771 772 773 774 775 776 777 778
33 Figure 3: Respiration rates as a function of increasing temperature in each pCO2 treatment,
779
for Crepidula fornicata males (top, triangles) and females (bottom, circles). For statistical 780
analyses of regressions see Table 3. 781
782
Figure 4: Mean (± SE) Q10 values for C. fornicata females (white bars) and males (grey bars)
783
in the different pCO2 treatments. N = 3
784
785 786 787
34 TABLES
788
789
Table 1: Mean (± standard error, SE) carbonate chemistry parameters for each pCO2
790
treatment. pH (on the total scale, pHT) was measured daily and total alkalinity (AT) was
791
measured every 3 weeks. Other parameters were calculated with CO2sys software. pCO2 :
792
CO2 partial pressure; ΩAr : saturation state of seawater with respect to aragonite.
793
794
pCO2 treatment pHT pCO2 (µatm) ΩAr AT (µEq kg-1 SW)
n = 69 n = 69 n = 69 n = 76 380 µatm 8.13 ± 0.01 324 ± 8 2.72 ± 0.06 2333 ± 1 550 µatm 7.89 ± 0.01 619 ± 16 1.69 ± 0.04 2334 ± 2 750 µatm 7.75 ± 0.01 873 ± 20 1.28 ± 0.03 2335 ± 2 1000 µatm 7.66 ± 0.01 1138 ± 65 1.05 ± 0.02 2334 ± 2 795 796
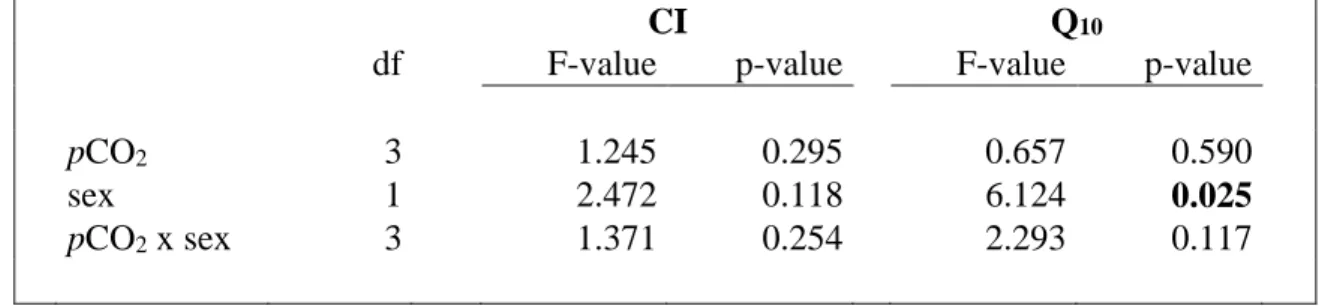
Table 2: Summary of two-way ANOVAs testing the effects of pCO2, sex and their interaction
797
on the final condition indices (CI) and the Q10 values determined for C. fornicata males and
798
females under the different pCO2 conditions (380, 550, 750 and 1000 µatm). Bold numbers
799
indicate significant level greater than 95%. 800
801
CI Q10
df F-value p-value F-value p-value
pCO2 3 1.245 0.295 0.657 0.590
sex 1 2.472 0.118 6.124 0.025
pCO2 x sex 3 1.371 0.254 2.293 0.117