Science Arts & Métiers (SAM)
is an open access repository that collects the work of Arts et Métiers Institute of
Technology researchers and makes it freely available over the web where possible.
This is an author-deposited version published in: https://sam.ensam.eu
Handle ID: .http://hdl.handle.net/10985/10013
To cite this version :
Lei SHENG, Zhibin ZHOU, Jean-Frederic CHARPENTIER, Mohamed BENBOUZID - Island Power Management using a Marine Current Turbine Farm and an Ocean Compressed Air Energy Storage System - In: Eleventh European Wave and Tidal Energy Conference EWTEC2015, France, 2015-09-06 - 11th EWTEC proceedings - 2015
Any correspondence concerning this service should be sent to the repository Administrator : archiveouverte@ensam.eu
Island Power Management using a Marine Current
Turbine Farm and an Ocean Compressed Air Energy
Storage System
Lei Sheng
1,2,3, Zhibin Zhou
2, Jean Frédéric Charpentier
1, Mohamed Benbouzid
21
French Naval Academy, EA 3634 IRENAV, Brest, France
Jean-Frederic.Charpentier@ecole-navale.fr
2University of Brest, EA 4325 LBMS, Brest, France
Mohamed.benbouzid@univ-brest.fr
3Huazhong University of Science and Technology, China-EU Institute of Clean and Renewable Energy, Wuhan, China
Abstract—Due to the high predictability and the high energy density, marine tidal resource has become an area of increasing interest with various academic and industrial projects around the world. In fact, several Marine Current Turbine (MCT) farm projects with multi-megawatt capacity are planned to be installed in the coming years. In this paper, an MCT farm is supposed to be associated to the energy supply of a stand-alone island. In order to compensate the MCT farm power variation due to tidal phenomenon, an Ocean Compressed Air Energy Storage (OCAES) system is considered to achieve the island power management. In this work, conventional Diesel Generators (DGs) would only serve as a backup supply while the main island power supply will be fulfilled by the proposed hybrid MCT/OCAES system. Simulations under different working conditions are carried out to validate the feasibility of the hybrid power system.
Keywords—Tidal energy, marine current turbine, island power supply, compressed air energy storage.
I. INTRODUCTION
Due to the intense energy density and the high predictability of tidal current resources, marine current turbine (MCT) is becoming a promising technology for generating electricity from the oceans. Industrial and academic research progresses on the MCT turbine designs are presented in [1]. Several megawatt level systems are currently under test and planned to be installed in pilot MCT farms in the coming years [2]. Similar to a wind turbine, the total kinetic power harnessed by a marine current turbine can be calculated by (1),
P=1
2Cp
ρ
Av3 (1)
Where ρ is the density of fluid acting on the turbine, A is the cross-sectional area of the turbine, and v is the fluid velocity perpendicular to the cross section of turbine. Cp is the
power coefficient of the turbine. Typical optimal Cp values for
a marine current turbine are in the range of 0.35-0.5 [3].
On a daily-time scale, the astronomic nature of tides causes seawater to flood and ebb regularly each day. An island grid load has its own variation pattern each day, which is related to the consumer’s behavior. Therefore, the energy storage system (ESS) is essential to solve the unbalances between the MCT generated power and the local load. A detailed comparison and evaluation of different ESS technologies for MCT application can be found in [4]. Daily power management for a single megawatt MCT based on battery storage system has been studied in [5].
It is practical to associate several MCTs in an offshore farm to increase the capability of the power generation and to share some common equipment (substation, power line, etc.) [6]. The power demand of some stand-alone islands in Western Europe is generally at several-megawatts level [7]. Some of these islands are located at the vicinity of high tidal current energy potential areas. This is why MCT farm can be an interesting solution to provide electricity for these islands.
Concerning the applicable range and the economic feasibility, CAES could be one of the most attractive candidates for MCT farm application in stand-alone islands. Usually CAES plants use underground cavern to store compressed air [8-9]. Advanced adiabatic CAES (AA-CAES) concept was proposed to reduce the fossil fuel consumption [10]. To be associated with a MCT farm, the geography limitation of conventional cavern-based CAES should be considered. An alternative concept of an ocean or underwater compressed air energy storage (OCAES or UWCAES) system was introduced by Seymour [11]. The overall efficiency of this conceptual OCAES is up to 65.9%, which is close to the highest efficiency (70%) of an ideal AA-CAES.
In this work, a stand-alone island is considered. The island electricity consumption (load demand) is originally satisfied by the diesel generator (DG) systems. A hybrid OCAES/MCT/DG power supply system is proposed in this work to reduce DG fuel consumption. The original DGs become the backup power source and they will work only when MCT output power fails to meet the load demand. The subsystem modeling of each part will be presented in Section II, and then the simulation results under different working
cases are analyzed in Section III, the conclusions and perspectives are given in Section IV.
II. MODELING OF THE HYBRID POWER SYSTEM
A. Parameters Estimation for the OCAES Model
It is supposed that the stand-alone island has a base load with a peak power of 3 MW, and varies following a typical load curve [12]. Referring to the developed MCT model described in [5], a 1.5 MW MCT is used in this paper. The daily tide velocity curve used in this work is shown in Fig. 1. We consider that the grid demand takes up about 90% of the total generated power of the MCT farm considering some possible losses. In this case, 6 MCTs are required to supply the island. The power curves of the MCT farm and the load of this island are shown in Fig. 2. It is supposed that the cut-off current velocity of the MCTs is 1 m/s.
For OCAES, the charge process is fulfilled by an air compressor while an air turbine is used for the discharge process. Therefore, the rated charge and discharge powers are independent. This independence makes it flexible to determine the size of the compressor and air turbine. The difference between MCTs power and load (in Fig. 2) is the reference for determining the OCAES power rating. And, the integration of the power difference gives a rough estimation of the needed OCAES energy capacity.
It can be seen from Fig. 3 that the maximum positive value of the difference is about 6 MW while the maximum negative
Fig. 1 Tide current speed during one day
Fig. 2 Power curve of the studied MCT farm and load curve for a typical island in one day
Fig. 3 Power difference (PMCTs-Pload) and its integration
value is about 3 MW. Therefore, the rated powers of the compressor and the gas turbine are designed to 6 MW and 3 MW respectively. The corresponding energy variation in the ESS can be estimated by integrating the power difference on the concerned period. The maximum value of this integration is about 13 MWh (shown in Fig. 3), therefore the energy capacity of the OCAES in this case can be designed to 15 MWh considering design margins.
B. Modeling of the OCAES
OCAES is proposed to be combined with thermal energy storage (TES) to increase the ESS efficiency. Based on the available literatures [13-15], main assumptions are made as follows: (1). The air storage is an ideal balloon, which can shrink totally during the discharge. No air leak happens in the air storage. The temperature of the air in the storage is same as that of the water, which is assumed to be 20℃; (2). TES is
modeled as an ideal and simple module, but it should be subject to the classical heat transfer theory. Synthetic oil is used as the heat transfer fluid (HTF), and the specific heat capacity of the oil is close to that of the air.
During the charge, the air temperature will increase while the air is compressed by the compressor. Before entering the next stage, the air will be cooled by the intercooler with the heat being stored in the TES. During the discharge, the air will expand and the air temperature decreases simultaneously; at the same time the air will be heated by the heat from TES. In this work, the pressure ratio is set to the same value for all three stages. For the polytropic compression and expansion, the ideal gas follows the well-known polytropic equation and the ideal gas equation simultaneously.
constant n
pv = (2)
a
pv=mR T (3) Based on these two equations, the outlet temperature of each stage in the compressor or turbine can be described by,
( 1)/ , ,
out in n n
i a i a i
T =T
β
− (4) where βi is the pressure ratio of each stage, it is equal to theratio of the outlet pressure to the inlet pressure. The electricity consumed by each stage of compressor is calculated by [14],
( 1) / , , , , 1 ( n n 1) in c a com p a ci a ci m c P m c T
β
η
− =∑
− (5) 0 2 4 6 8 10 12 14 16 18 20 22 24 -4 -2 0 2 4 Time (hour) V ( m /s ) 0 2 4 6 8 10 12 14 16 18 20 22 24 -1000 0 1000 2000 3000 4000 5000 6000 7000 8000 Time (hour) P o w e r (k W ) MCT farm load 0 2 4 6 8 10 12 14 16 18 20 22 24 -3 0 6 13 Time (hour) P ( M W )/ E (M W h ) Difference Integrationwhere, ηm,c is the mechanical efficiency of compressor, which
is assumed to be constant, Ra is the gas constant of air. As for
gas turbines, the generated power from air expansion is calculated by [14], ( 1) / , , , , (1 ) in n n t a tur m t p a ti a ti P =
η
m c∑
T −β
− (6) where, ηm,t is the mechanical efficiency of turbine; it is alsoassumed to be a constant.
The pressure in each stage is determined based on the pressure ratio setting, and the temperature determination in each stage is the critical issue for the calculation of the compression/expansion operation. A simplified ideal model is used for TES part. The TES is divided into the cold HTF storage and the hot HTF storage as shown in Fig. 4. This model is similar to those proposed in [15]. During the operation, the temperatures of cold and hot HTF storage are supposed to be constant. The temperature of the cold HTF before entering the coolers is assumed to be 40℃, while that
of the hot HTF is determined by the average temperature of the compressor outlet air.
For real application, a TES reservoir with large thermal capacity should be used. TES reservoir should be temperature stratified, in which the maximum and minimum temperatures are corresponding to the temperatures of hot and cold HTF in the simplified model. Fig. 5 shows the schematic diagram of the heat transfer for the equivalent conceptual TES reservoir. In order to determine the volume of the TES reservoir, the charge and discharge heat are calculated as follows
, 1,0 ,1
arg air p air
(
ci ci)
ch e
Q
=
m
c
∑
T
+−
T
(7), 1,0 ,1
arg air p air
(
ti ti)
disch e
Q
=
m
c
∑
T
+−
T
(8)C. Charge and Discharge Tests of OCAES
A charge/discharge test for the above OCAES model is carried-out. The State of Charge (SoC) of the OCAES equals the volume ratio of the air left in the storage to the maximum volume of the container, which is also the mass ratio because of the constant pressure of the container. The SoC is then calculated by, arg arg 0( ) t ch e disch e total m m dt SoC m − =
∫
(9) The designed total air volume in the storage is calculated by( 1) / arg arg , , 0 , , ( 1) n n ch e ch e m c a ambient air total in p air ci a ci P T R T V p c T η β − = ⋅ −
∑
(10)The designed volume of the TES reservoir is calculated by
arg arg ,
,
(
, ,)
ch e ch e
TES reservoir
p TES hot HTF cold HTF
Q
T
V
c
T
T
=
−
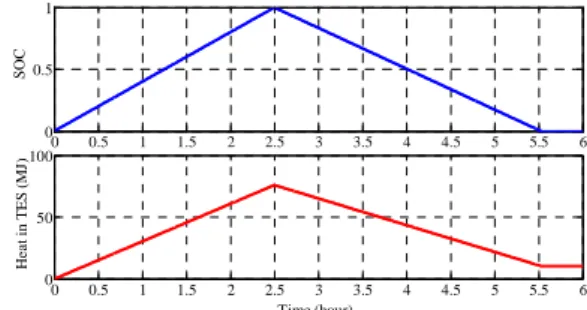
(11)The main parameters for the test of charge and discharge are listed in Table I (Appendix). The charge/discharge simulation results are shown in Fig. 6. The SoC increases from 0 to 1 after charging for 2.5h, and then decreases to 0 after discharging for 3.03h. Based on (12), the global efficiency of this OCAES can be estimated about 60.6%. Calculated from (13), the heat recycle efficiency of TES is about 86.2%.
Fig. 4 Principle schema of an AA-OCAES
Fig. 5 Schematic diagram of the inner heat transfer for the OCAES
Fig. 6 Evolution of SOC and heat energy in TES reservoir during the charge-discharge tests 0 0.5 1 1.5 2 2.5 3 3.5 4 4.5 5 5.5 6 0 0.5 1 S O C 0 0.5 1 1.5 2 2.5 3 3.5 4 4.5 5 5.5 6 0 50 100 Time (hour) H e a t in T E S ( M J)
arg arg arg arg disch e disch e global ch e ch e
P
T
P
T
η
=
(12) arg arg arg arg disch e disch e heat ch e ch eQ
T
Q
T
η
=
(13)D. Modeling of the Hybrid OCAES/MCT/DG System
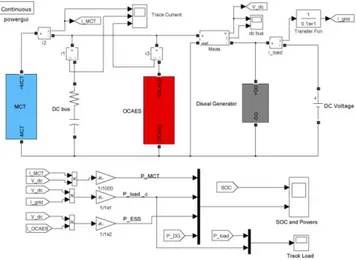
The hybrid power system for the stand-alone island includes a MCT farm, an OCAES with TES and DGs. A simplified equivalent DC grid system is applied as shown in Fig. 7. The DC voltage source in Fig. 7 simulates the island load in the hybrid power system. This equivalent DC grid system facilitates simulations on a long-time scale. The control design of the whole power system is aimed to utilize the renewable energy as much as possible to satisfy the load, and to maintain the grid balance between the supply and demand.
The power input and output of OCAES is realized by the compressor and turbine respectively. The charging and discharging powers of the OCAES are controlled by adjusting the air mass flow by controlling the compressor and turbine speed. The charge/discharge power control scheme proposed in [5] is applied in this work. As shown in Fig. 8, the power reference of OCAES is determined by the difference between load and the power of MCT farm with respecting the OCAES limitations (the OCAES will be shut down if the SoC reaches 0 or 1).
Fig. 7 Model of the hybrid power system in Matlab/Simulink
Fig. 8 Control scheme for OCAES
It is assumed that there are multiple Diesel generator sets with different rated powers that can run in parallel with high efficiency, and the total rated power of the DGs can meet the maximum load demand at any cases. DG control is directly linked to OCAES status. When the SoC of OCAES is lower than 0.05, DGs will start up. If the OCAES power reference is higher than the rated discharge power in some extreme cases, DG will operate to supply the load and keep OCAES power within its limitations.
III.SIMULATION OF THE HYBRID POWER SYSTEM IN TYPICAL
TEST CASES
A. One-day Normal Case
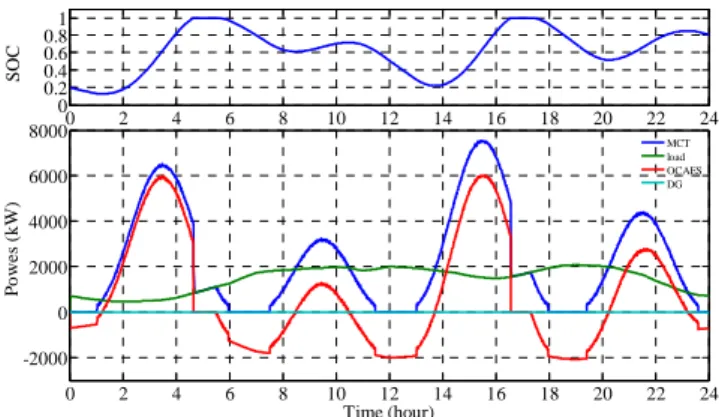
In this case, it is supposed that the load and the tide velocity are varying under the designed conditions (as shown in Fig. 3). In this normal case, a low initial SoC of 0.24 was setting based on the predictable excessive MCT-produced energy to be stored during 1 and 5 h (Fig. 2). The simulation results of SoC and powers under this normal working condition are shown in Fig. 9.
The MCT farm operates in MPPT mode to maximize the power harnessed from the tidal currents. In the beginning, the load is supplied by OCAES because the current velocity is too low for MCT operation. With the increases of the tide velocity, the increasing power generated by MCT farm will meet the load demand and OCAES stops discharging. When the MCT power is higher than the load, the surplus power will be used to charge OCAES.
It can be seen that the load is satisfied by MCT farm and OCAES in most cases, and DGs only start up two times in one day in this normal case. It can be calculated that DGs work for only 3h in one day and contributes about 5.43 MWh to the load, which corresponds to about 10% of the total island load consumption. Therefore, the hybrid power system significantly helps reduce the fossil fuel consumption and the greenhouse gas emission. OCAES is charged and discharged alternately four times in one day. The maximum charge power is about 5.8MW and the maximal discharge power is about 2.97MW, so the chosen design options seem to be suitable for this test case.
The maximum SoC of the ESS is about 0.97 and also reaches the lower limit sometimes. Although OCAES can be totally discharged theoretically, maintaining some remaining air in the balloon is good for the long service life. But the SOC is at a relatively high level at most time, which indicates that the volume design of air storage seems reasonable. Moreover, the final SoC is 0.19 after working one day, which is a little lower than the initial SoC.
B. Higher or Lower Load
The load curve used in the normal case is the base load, which can be taken as the average case for this island. However, real daily load curve will vary for different periods. As an example, this load can vary strongly with working days or holydays or with seasonal consumer behavior.
The higher load is set to be 1.3 times of the original normal load. The simulation results for this case are shown in Fig. 10. In this case, a remarkable increase of DG operation time and contribution can be noticed. DGs contribute about 26.6% to the load during one day in this case, which is more than two times of the contribution in corresponding to the previous case. The highest SoC of the OCAES attained in this case is only 0.87, and the SoC is at its lowest value for a long time. In addition, when OCAES reaches its rated discharge power at 6.74h, DGs start up and assume the excess load. DGs decrease the power first when MCT recover the power generation at 7.52h. When SoC reaches its lower limit, OCAES stops discharging and DGs assume the main load with MCT farm. This case shows that DGs still play an important role for insuring the load following ability in the hybrid system, especially in high load cases.
The lower load case is carried out when the load demand is set to be 0.7 times of the original normal load. From Fig. 11, the OCAES is fully charged two times by the flooding tide. In order to maintain the grid stability, there is a sharp power decrease both for MCT farm and OCAES at 4.66h and 16.57h when OCAES was fully charged. One distinguished characteristic in this case is that the entire island load can be supplied by the joint operation of MCT farm and OCAES during this day and no DG operation (and consumption) is needed.
Fig. 9 Simulation results (SOC and powers) in the normal case
Fig. 10 The simulation results (SOC and powers) for high load case (1.3 times normal load)
Fig. 11 The simulation results (SOC and powers) for low load (0.7 times normal load)
C. Higher or Lower Tide Speed
Figure 12 shows the simulation results in the case where the tide speed increases by 10%. As can be seen, OCAES will be quickly fully charged because of the high energy provided by MCT farm. However, in this case, the MCT cannot keep in MPPT operation when the OCAES charging power reaches its rated value at 2.69h or 14.82h; MCT control can limit the generated power to protect the OCAES from the over charge and maintain the stability of the grid [16]. When the OCAES is fully charged at 4.28h or 16.81h, the MCT limits the generated power to the load only. In this case, only about 4.1% of the island load is required to be supplied by DGs in one day.
A tidal cycle where the tide speed decreases by 20% is studied. As can be seen from Fig. 13, the highest SoC is 0.42 and it reaches the lower limit at most time of one day. Relatively, DGs work for the most time. It means that, the DG fuel consumption reduction is less efficient during a lower tidal speed cycle. In this case, the DGs are required to supply about 47.4% of the total load in the simulated day.
Fig. 12 Simulation results (SOC and power)s when the tide speed amplitude is increased by 10% 0 2 4 6 8 10 12 14 16 18 20 22 24 0 0.2 0.4 0.6 0.8 1 S O C 0 2 4 6 8 10 12 14 16 18 20 22 24 -4,000 -2000 0 2000 4000 6000 8000 Time (hour) P o w e rs ( k W ) MCT load OCAES DG 0 2 4 6 8 10 12 14 16 18 20 22 24 -3000 0 2,000 4,000 6,000 8,000 Time (hour) P o w er s (k w ) 0 2 4 6 8 10 12 14 16 18 20 22 24 0 0.2 0.4 0.6 0.8 1 S O C MCT load OCAES DG 0 2 4 6 8 10 12 14 16 18 20 22 24 0 0.2 0.4 0.6 0.81 S OC 0 2 4 6 8 10 12 14 16 18 20 22 24 -2000 0 2000 4000 6000 8000 Time (hour) P o we s (k W ) MCT load OCAES DG 0 2 4 6 8 10 12 14 16 18 20 22 24 0.050.2 0.4 0.6 0.8 1 S O C 0 2 4 6 8 10 12 14 16 18 20 22 24 -2000 0 2000 4000 6000 8000 Time (hour) P o w e r (k W ) MCT load OCAES DG
Fig. 13 Simulation results (SOC and powers) when the tide speed amplitude is decreased by 20%
IV.CONCLUSIONS AND PERSPECTIVES
In the present study, a stand-alone island power supply was considered. The proposed power supply solution is retrofitted from conventional DGs sets to a MCT-OCAES-DGs hybrid power system. A simplified OCAES model with TES was proposed in this paper. The control strategies of different subsystems were proposed and presented. Simulations were carried-out in different test cases to validate the proposed approach. The main conclusions of the present study are as follows: 1) Hybrid MCT-OCAES can greatly reduce DG operating duration; 2) The tests for different cases validated the efficiency of the proposed control strategy; 3) The proposed hybrid system can provide a flexible power supply to the load in continuous operation even in extreme cases.
APPENDIX
TABLE I MAIN INPUT PARAMETERS FOR THE OCAES
nc 1.5
nt 1.33
ηm,c 0.92
ηm,t 0.92
Tambient (K) 293
Pressure ratios of compressor 6, 2.6, 2.57 Pressure ratios of turbine 1/3.5, 1/3.5, 1/3.27
Cpair (J/kg.k) 1003.5 Raair (J/kg.k) 286.7 ρHTF (kg/m3) 570 CpHTF (J/kg.k) 1260 ρTES (kg/m3) 2750 CpTES (J/kg.k) 916 Depth (m) 400 p0 (bar) 40 Rating power (kW) 6000/3000 Charge time (h) 2.5 Tcold, HTF (K) 313 VTES (m3) 121.4 Vair storage (m3) 2133 ACKNOWLEDGMENT
The authors gratefully acknowledge the supports from French Navy Academy, University of Brest and China-EU Institute of Clean and Renewable Energy.
REFERENCES
[1] K.W. Ng, W.H. Lam and K.C. Ng, “ 2002–2012: 10 years of research progress in horizontal-axis marine current turbines,” Energies, vol. 6, n°3, pp. 1497-1526, 2013.
[2] Z. Zhou, F. Scuiller, J.F. Charpentier, M.E.H. Benbouzid and T. Tang, “An up-to-date review of large marine current turbine technologies,” in
Proceedings of the 2014 IEEE PEAC, Shanghai (China), pp. 480-484,
November 2014.
[3] W.M.J. Batten, A.S. Bahaj, A.F. Molland and J. R. Chaplin, “The prediction of the hydrodynamic performance of marine current turbines,” Renewable Energy, vol. 33, n°5, pp. 1085-1096, May 2008. [4] Z. Zhou, M.E.H. Benbouzid, J.F. Charpentier, F. Scuiller and T. Tang,
“A review of energy storage technologies for marine current energy systems,” Renewable and Sustainable Energy Reviews, vol. 18, pp. 390-400, February 2013.
[5] Z. Zhou, F. Scuiller, J.F. Charpentier, M.E.H. Benbouzid and T. Tang, “Application of flow battery in marine current turbine system for daily power management,” in Proceedings of the 2014 IEEE ICGE, Sfax (Tunisia), pp. 8-13, March 2014.
[6] A.T. Jones and A. Westwood, “Recent progress in offshore renewable energy technology development,” in Proceedings of the 2005 IEEE
PESGM, vol. 2, pp. 2017-2022, San Francisco (USA), June 2005.
[7] US DOE, “Ocean energy technology overview,”
DOE/GO-102009-2823, July 2009.
[8] H. Ibrahim, A. Ilinca and J. Perron, “Energy storage systems—Characteristics and comparisons,” Renewable and Sustainable Energy Reviews, vol. 12, n°5, pp. 1221–1250, June 2012.
[9] H.M. Kim, J. Rutqvist, D.W. Ryu, B.H. Choi, C. Sunwoo and W.K. Songa, “Exploring the concept of compressed air energy storage (CAES) in lined rock caverns at shallow depth: A modeling study of air tightness and energy balance,” Applied Energy, vol. 92, pp. 653-667, 2012.
[10] C. Bullough, C. Gatzen, C. Jakiel, M. Koller, A. Nowi and S. Zunft, “Advanced adiabatic compressed air energy storage for the integration of wind,” in Proceedings of the 2004 EWEC, London (UK), November 2004.
[11] R.J. Seymour, “Ocean energy on-demand using underocean compressed air storage,” in Proceedings of the 2007 OMAE, San Diego (USA), pp. 527-531, June 2007.
[12] B. Wu, B. Zhang, J. Wang, J. Li, X. Zheng, Y. Liu, B. Mao and Y. Gao, “Theoretical research for the application of flow storage battery in demand side management,” in Proceedings of the 2010 IEEE
POWERCON, Hangzhou (China), pp. 1-7, October 2010.
[13] D. Laing, W. Steinmann, R. Tamme and C. Richter, “Solid media thermal storage for parabolic trough power plants,” Solar Energy, vol. 80, n°10, pp. 1283-1289, October 2006.
[14] I. Arsie, V. Marano, G. Nappi and G.Rizzo, “A model of a hybrid power plant with wind turbines and compressed air energy storage,” in
Proceedings of the 2005 ASME Power Conference, Chicago (USA), pp.
987-1000, April 2005.
[15] A. Gil, M. Medrano, I. Martorell, A. Lazaro, P. Dolado, B. Zalba and L.F. Cabeza, “State of the art on high temperature thermal energy storage for power generation. Part 1—Concepts, materials and modellization,” Renewable and Sustainable Energy Reviews, vol. 14, pp. 31-55, January 2010.
[16] Z. Zhou, F. Scuiller, J.F. Charpentier, M.E.H. Benbouzid and T. Tang, “Power control of a non-pitchable PMSG-based marine current turbine at over-rated current speed with flux-weakening strategy,” IEEE
Journal of Oceanic Engineering, vol. PP, n°99, p.1-10, 2015.
0 2 4 6 8 10 12 14 16 18 20 22 24 0.05 0.5 S O C 0 2 4 6 8 10 12 14 16 18 20 22 24 -4000 -2000 0 2000 4000 Time (hour) P o w e rs ( k W ) MCT load OCAES DG