Science Arts & Métiers (SAM)
is an open access repository that collects the work of Arts et Métiers Institute of Technology researchers and makes it freely available over the web where possible.
This is an author-deposited version published in: https://sam.ensam.eu Handle ID: .http://hdl.handle.net/10985/9654
To cite this version :
Denis DEZEST, Olivier THOMAS, Fabrice MATHIEU, Laurent MAZENQ, Caroline SOYER, Jean COSTECALDE, Denis REMIENS, Jean-François DEÜ, Liviu NICU - Wafer-scale fabrication of self-actuated piezoelectric nanoelectromechanical resonators based on lead zirconate titanate (PZT) - Journal of Micromechanics and Microengineering - Vol. 25, n°3, p.35002-35013 - 2015
Any correspondence concerning this service should be sent to the repository Administrator : archiveouverte@ensam.eu
Science Arts & Métiers (SAM)
is an open access repository that collects the work of Arts et Métiers ParisTech researchers and makes it freely available over the web where possible.
This is an author-deposited version published in: http://sam.ensam.eu Handle ID: .http://hdl.handle.net/null
To cite this version :
Denis DEZEST, Olivier THOMAS, Fabrice MATHIEU, Laurent MAZENQ, Caroline SOYER, Jean COSTECALDE, Denis REMIENS, Jean-François DEÜ, Liviu NICU - Wafer-scale fabrication of self-actuated piezoelectric nanoelectromechanical resonators based on lead zirconate titanate (PZT) - Journal of Micromechanics and Microengineering - Vol. 25, n°3, p.035002 - 2015
Any correspondence concerning this service should be sent to the repository Administrator : archiveouverte@ensam.eu
Wafer-scale fabrication of self-actuated piezoelectric nanoelectromechanical resonators
1. Introduction
The transition from micro to nano-scale raises a major interest for both scientific and technological communities. With advances in nanotechnology the realm of electromechanical systems has witnessed the emergence of nanoelectromechan-ical systems (NEMS) over the last decade. The significant
enhancement of devices’ performance when scaling down the size has been widely reported for NEMS-based resona-tors [1–3]. Characteristics such as high resonant frequencies (MHz–GHz range), low masses and high quality factors have led to unprecedented sensitivities to extremely small forces and additional mass loading. In recent years, new records for the limit of detection (i.e. the minimum resolvable added
Wafer-scale fabrication of self-actuated
piezoelectric nanoelectromechanical
resonators based on lead zirconate
titanate (PZT)
D Dezest1,2, O Thomas3,4, F Mathieu1,2, L Mazenq1,2, C Soyer5,6,7,
J Costecalde5,6,7, D Remiens5,6,7, J F Deü4 and L Nicu1,2
1 LAAS-CNRS, 7 avenue du Colonel Roche, F-31077, Toulouse, France 2 University of Paul Sabatier, F-3100, Toulouse, France
3 Arts et Métiers ParisTech, LSIS UMR CNRS 7296, 8 bd. Louis XIV 59046 Lille, France
4 Structural Mechanics and Coupled Systems Laboratory, Conservatoire National des Arts et Métiers, 2
Rue Conté, 75003 Paris, France
5 IEMN-CNRS, Avenue Point Carré, F-59652, Villeneuve d’Ascq, France 6 University of Lille Nord de France, F-59652, Villeneuve d’Ascq, France 7 University of Valenciennes, F-59313, Valenciennes, France
E-mail: ddezest@laas.fr
Abstract
In this paper we report an unprecedented level of integration of self-actuated
nanoelectromechanical system (NEMS) resonators based on a 150 nm thick lead zirconate titanate (PZT) thin film at the wafer-scale. A top-down approach combining ultraviolet (UV) lithography with other standard planar processing technologies allows us to achieve high-throughput manufacturing. Multilayer stack cantilevers with different geometries have been implemented with measured fundamental resonant frequencies in the megahertz range and Q-factor values ranging from ~130 in air up to ~900 in a vacuum at room temperature. A refined finite element model taking into account the exact configuration of the piezoelectric stack is proposed and demonstrates the importance of considering the dependence of
the beam’s cross-section upon the axial coordinate. We extensively investigate both
experimentally and theoretically the transduction efficiency of the implemented piezoelectric layer and report for the first time at this integration level a piezoelectric constant of
=
d31 15 fm V−1. Finally, we discuss the current limitations to achieve piezoelectric detection. Keywords: NEMS, PZT, large-scale integration
D Dezest et al Printed in the UK 035002 jmm © 2015 IOP Publishing Ltd 2015 25 j. micromech. microeng. jmm 0960-1317 10.1088/0960-1317/25/3/035002
Papers
3journal of micromechanics and microengineering AT
2
mass) have been continuously established [4–6] until the ultimate mass-sensing limit in the yoctogram range (10−24 g) was recently achieved by Bachtold and co-workers [7]. These attributes make NEMS resonators particularly promising can-didates for a wide range of technological applications such as biosensing [8, 9] and mass spectrometry [7, 10] as well as more fundamental studies on quantum phenomena [11, 12].
However, most of the tremendous demonstrations reported here have been obtained with individually fabri-cated NEMS based on external transducers (i.e. off-chip) for which actuation and read-out means typically exceed the size of the device itself. These barriers currently limit their widespread use as cheap portable sensing tools. In order to exploit the full potential of NEMS and to start being a viable alternative to their microscale counterparts (i.e. MEMS), the fully integrated transduction (i.e. on-chip) combined with large-scale integration are the ultimate goals to achieve. So far, minimal effort has been focused on the development of nanoresonators with on-chip transducers at the wafer-scale. As the size of the mechanical element is scaled downward so is its motional range and developing suitable transduc-tion techniques of sub-nanometer displacements at high frequencies remains an important technological challenge [13]. Relevant results in that sense have been obtained mostly at the chip level either by carrying over traditional transduction schemes at the nano-scale from the MEMS domain [14–16] or by delivering brand new schemes exclu-sively adapted to the NEMS realm [17]. Recent efforts have been made to demonstrate full-wafer fabricated NEMS with integrated transduction means [18, 19] but these are rather infrequent, which demonstrates how critical the gap between chip and wafer is.
Compared to most of the conventionally-employed mag-netomotive [20], electrostatic [14] and electrothermal [4, 21] excitations for which the integration potential may be lim-ited by either the need for an external magnetic source, low actuation efficiency or high power consumption, piezoelectric transducers scale attractively to the sub-micron range. Such transducers offer fully-integrated transduction mechanisms to convert an electrical signal into a mechanical motion and vice versa. If the converse piezoelectric effect (strain upon applica-tion of an electric field) can be used as an actuator, the direct piezoelectric effect (generation of charges under an applied stress) can be employed for sensing. However, implementing such transducers with preserved piezoelectric properties at the nano-scale remains challenging.
In this paper we report an unprecedented level of integra-tion of piezoelectrically self-actuated NEMS resonators at the wafer-scale. We use PZT as piezoelectric material mainly because of its excellent actuation properties compared to other ceramics [22, 23] even when geometrically constrained at extreme scale [24]. This study is part of a comprehensive approach that addresses the design, fabrication, modeling and characterization of these devices. The objectives of the paper are (i) to report a fabrication process to integrate at the wafer-scale a 150 nm thick sputtered PZT thin film onto arrays of NEMS resonators; (ii) to experimentally investigate the mechanical dynamical behavior of the fabricated resonators
and (iii) to assess the actuation and sensing capabilities of the integrated piezoelectric layer.
The outline of the paper is as follows. A detailed description of the beams’ geometries and the implemented fabrication pro-cess is presented in section 2. Then a refined finite element (FE) model taking into account the complex laminated configura-tion of the piezoelectric stack is proposed in secconfigura-tion 3. Finally, the characterization results are gathered and analyzed in sec-tion 4: first, the experimental resonant frequencies of several resonators are compared to the theoretical ones, validating the FE model and assessing the mechanical integrity of the resona-tors; then, the piezoelectric actuation and detection capabilities of the piezoelectric layer are identified and analyzed.
2. Experiments
2.1. Design
Chips (16 × 16 mm) of 256 silicon-based cantilevers have been designed to be fabricated on a 4 inch silicon-on-insulator (SOI) wafer. Resonators with different sizes and geometries have been implemented into 64 arrays of 4 cantilevers. The width of the cantilevers has been varied from 0.7 to 5 µm in width and from 2 to 12 µm in length. A multilayer stack composed of a 150 nm thick PZT 54/46 (PbZr0.54Ti0.46O3) thin film
sand-wiched between a 100 nm thick lanthanum nickelate (LaNiO3
or LNO) bottom electrode and a 12/120 nm thick titanium/plat-inum (Ti/Pt) top electrode serves as the integrated piezoelectric transducer. Two different geometries for the piezoelectric stack have been implemented. In geometry A, the piezoelectric stack covers almost the full length of the resonator and each layer of the stack is completely covered by the upper layer. In geometry B, half-length of the cantilever is covered by the piezoelectric stack for which both the bottom and top electrodes have the same dimensions. The four cantilevers of the same array have the same width and geometry but different lengths.
2.2. Fabrication process
Resonators have been fabricated by using standard surface micromachining techniques. We chose ultraviolet (UV) lithography as a parallel top-down approach to simultaneously manufacture a high number of devices with small features size in an integrated fashion at the wafer-scale. UV stepper photo-repeater equipment was used (I-line FPA 3000 i4/i5 N A 0.63, Canon Inc) to perform the photolithography steps during the fabrication process. The I-line photolithography (of wavelength λ = 365 nm) combined with an X5 (lens reduc-tion factor) projecreduc-tion system allows us to reach a resolureduc-tion of 350 nm for a periodic pattern and up to 100 nm for an iso-lated structure with a precision alignment of 50 nm. We used 4 inch (1 0 0) P-type silicon on insulator (SOI) wafers (340 nm thick device layer / 1 µm thick buried oxide / 525 µm thick handle, purchased from Soitec Inc, France) as the starting material. The buried oxide acted as a sacrificial layer for the final release of the structures. The main steps of the six-mask fabrication process are shown in figure 1 and described in the following.
First, a 30 nm thick layer of SiO2 is thermally grown to
serve as an electrical insulation layer. Both thermal oxide (CF4:
40 sccm, RF power: 39 W, ICP power: 500 W, etching time: 35 s) and silicon device (C4F8: 400 sccm, SF6: 300 sccm, RF
power: 60 W, ICP power: 2800 W, pressure: 0.07 mbar, sample temperature: −5 °C, etching time: 20 s) layers are then succes-sively etched by reactive ion etching (AMS4200, Alcatel Inc) to pattern the shape of the structures. Collective integration of the piezoelectric stack onto individual structures starts with the deposition of the bottom electrode. A 100 nm thick layer of LaNiO3 is sputtered [24] and patterned on the structures by
lift-off using a high-resolution bi-layer positive photoresist LOR3A/ ECI3012 (purchased from MicroChemicals, Germany). LNO acts as a diffusion barrier against the migration of lead atoms during the PZT crystallization step. It prevents lead atoms from diffusing and reacting with any underlying Si-based material. Then a 150 nm thick active layer of PZT 54/46 is deposited by RF magnetron sputtering (Addax Technologies) from a PbZr54Ti46O3 compact power target (diameter 76.2 mm) under
a pure argon gas atmosphere with a pressure set at 0.01 mbar and with a RF power fixed at 100 W [24]. The deposition is performed at room temperature to be compatible with a lift-off patterning. The PZT composition is close to the morphotropic phase boundary (MPB) where PZT exhibits optimal piezoelec-tric and dielecpiezoelec-tric properties [25]. PZT patterning by lift-off is an alternative approach to conventional dry and wet etching techniques. The former has been reported to deteriorate the PZT material properties due to a combination of both physical damages and chemical contamination [26, 27] while the latter requires the use of a hydrofluoric (HF) solution which can be incompatible with other etchant-sensitive materials and suffers
from undesirable undercut of the masked features. After deposi-tion, a mandatory annealing at 625 °C for 30 min is performed to crystallize the PZT into the perovskite phase. A 12/120 nm thick layer of Ti/Pt is then deposited and patterned by lift-off as the top electrode. Each array of structures is then individually addressed with 100/700 nm thick Ti /Au interconnections. The structures are released by wet etching of the sacrificial layer after a photoresist encapsulation to protect other sensitive layers. We use a 2.6 µm thick ECI 3012 positive photoresist (purchased from MicroChemicals, Germany) with an additional baking at 115 °C for 1 min before etching to enhance the photoresist adhe-sion. A buffered oxide etchant (BOE) composed of a 7-1 ratio of an ammonium fluoride (NH4F)–HF acid mixture with an isotropic etch rate of around 77 nm min−1 is used at room
tem-perature to release the structures. Two subsequent wet etching -photoresist encapsulations are performed to reduce photoresist adhesion defects due to long etching time while being able to release the largest structures up to 5 µm wide. Nevertheless, this critical step imposes the final yield (around 33%) of the imple-mented fabrication process. Optical and SEM pictures of the fabricated devices are shown in figure 2.
2.3. Measurement setup
Actuation of the resonators is performed according to two different configurations: external actuation (off-chip) and inte-grated actuation (on-chip). In the former, a chip is mounted onto a piezodisk electrically driven by a network analyzer, as shown in figure 3(a). Resonators are therefore collectively actuated through the piezoshaker and individually read-out. In the latter configuration, a chip is glued to a metallized
Figure 1. Process flow for the cantilevers’ fabrication (geometry A) with an integrated PZT-based piezoelectric transducer. (a) 4 inch SOI wafer (340 nm thick top Si layer, 1 µm-thick buried oxide) as the starting material. (b) Dry thermal growth of 30 nm thick silicon dioxide (SiO2). (c) Definition of the shape of the cantilevers by reactive ion etching (RIE). (d) Deposition and lift-off patterning of a 100 nm
thick LNO bottom electrode. (e) Deposition by RF-magnetron sputtering and lift-off patterning of a 150 nm thick PZT active layer. (f) Deposition and lift-off patterning of a 12/120 nm thick Ti/Pt top electrode. (g) Metallization and lift-off patterning of 100/700 nm thick Ti/Au interconnections. (h) Devices released by two subsequent anisotropic wet etchings of the sacrificial buried SiO2 layer. The color code
4
polyimide support with dedicated gold-wiring interconnec-tions. Devices of the same array are then self-actuated by imposing a voltage between the top and bottom electrodes with the network analyzer (see figure 3(b)).
For both actuation configurations, the mechanical motion of individual cantilevers is optically read-out by a home-made Fabry–Pérot interferometer bench shown in figure 3(c). In this setup, a chip is clamped onto a motorized piezoelectric precision stage (XYZ translations) inside a vacuum chamber and pumped down to a secondary vacuum (around 10−6 mbar) at room temperature. A 30 mW helium-neon laser (of wave-length λ = 633 nm) is focused through a beam expander (X5) and a long-working distance microscope objective (20X, N A 0.28) onto the surface of a resonator. The fine positioning of the laser is controlled by the piezo-stage displacement while the operation is monitored with a complementary metal oxide semiconductor (CMOS) camera under a light emitting diode blue light (of wavelength λ = 470 nm). The air gap between the suspended resonator and the substrate underneath acts as a Fabry–Pérot cavity. Mechanical oscillations of the driven resonator modify the gap size of the optical cavity and mod-ulate the intensity of the interferences between the multiple reflected beams. The intensity of the reflected optical signal is modulated at the driving frequency and its amplitude is proportional to the resonator displacement. Details of the
Fabry–Pérot interferometry principle used as a sensing tech-nique for MEMS have been described by Carr and Craighead [28]. The optical signal is reflected back through the micro-scope objective and diverted through a beam splitter toward an ac-coupled photodetector (New Focus model 1601, Newport Inc). The photodetector ac output is connected to the network analyzer (Agilent model 4395 A) to measure the mechanical response of the resonator at the frequency of the excitation signal, in a similar manner to a lock-in amplifier detection.
3. Model for laminated resonating cantilevers
A reduced-order model of the vibrating cantilevers, restricted to one eigenmode, is proposed hereafter. We are interested in the tip transverse displacement u tt( ) (at time t). It can be shown (see appendix A) that it verifies:
∫
∫
ω ω χ Φ Φ Φ + − + + = = u Q u u V p L M M L m x x x L x x ¨ ˙ , ( ) ( ) d ( ) ( ) d t t t c L L 1 0 02 0 eff eff 0 2 0 (1) where Q is the quality factor, ω0 is the angular frequency, χc isthe modal converse piezoelectric-coupling coefficient, V t( ) is the voltage across the electrodes, L is the length of the canti-lever, m x( ) is the cantilever mass per unit of length and Φ x( ) is the mode shape at axial position x. Only a uniform mechan-ical loading p0 (a force per unit of length) of the cantilevers
is considered here (it will be associated with the thermome-chanical noise in section 4.2). Meff is the effective mass, which
depends on the detection location (the free end) and the type of loading (uniform in this case). Equation (1) is associated with the converse piezoelectric effect.
For the direct piezoelectric effect, one obtains [29, 30] the electric charge q in the electrodes as:
χ
= +
q CV d tu (2)
where C is the static capacitance of the piezoelectric layer and χd is the modal direct piezoelectric-coupling coefficient. In
this latter equation, one clearly observes two physical effects that generate electric charges in the electrodes: (i) a capacitive effect CV, directly proportional to the input voltage V and (ii) a direct piezoelectric transduction effect χ u .d t
As explained in section 2.1, the geometries of the cantile-vers are not homogeneous since they are composed of several materials, resulting in a complex layered structure which depends on the axial coordinate (see figure 4).
In the current study, a home-made finite element (FE) model, fully described elsewhere [29–31], enables us to compute all the model parameters
(
ω Φ0, ( ) ,x Meff,χcandχd)
. It is based on 1D beam finite elements, with Euler–Bernoulli assump-tions and a uniform electric field inside the piezoelectric layer. 100 finite elements are used in the model, which enables us to accurately take into account the dependence of the lamination as a function of the axial coordinate, by changing the value of the equivalent mass and stiffness properties of the elements. Four types (resp. three types) of cross-sections for cantileversFigure 2. (a) Wafer-scale fabrication of NEMS cantilevers on a 4 inch SOI wafer. (b) Each chip is composed of 64 arrays of 4 cantilevers. Colored scanning electron microscope (SEM) pictures of 2 arrays of 2.4 µm wide cantilevers with geometries A and B are respectively shown in (c) and (d). A close view of the two configurations for the multilayer stack is shown in (e) and (f).
with geometry A (resp. geometry B) are defined, whereas other works in the literature based on analytical models are limited to only one cross section [32, 33] or two [30]. Table 1
gathers the parameters used for the computations.
4. Results and discussion
The fabricated resonators are characterized in their dynamic mode. For each measurement, the dynamic parameters such as the resonant frequency f0 and the quality factor Q are
extracted from the mechanical response by a Lorentzian curve fitting based on the least squares method. Table 2 gathers
Table 1. Values of the numerical parameters used for the FE simulations. The Young’s moduli values are from [34] (Si, SiO2,
PZT, Pt [35]), (LNO) and [36] (Ti). The density values are the common ones from equivalent bulk materials.
Material Thickness [nm] Density [kg m−3] Young’s modulus [GPa]
Si 340 2500 169 SiO2 30 2150 70 LNO 100 7215 180 PZT 150 7800 96 Ti 12 4510 110 Pt 120 21450 145
Figure 3. Scheme of the entire measurement setup. The two actuation configurations external (off-chip) and integrated (on-chip) are respectively shown in (a) and (b). The optical interferometry setup is depicted in (c).
Figure 4. Geometries of the beams used in the finite element simulations.
2 sections cross Geometry B Geometry A PZT Ti Pt LNO Si SiO
6
the dimensions and geometries of the different cantilevers reported in this work.
In addition to the dynamic and piezoelectric responses of the fabricated resonators reported in the following sec-tion, experimental characterizations of other major attributes for mass-sensing applications, such as the Q-factor depend-ence with air pressure and the added-mass limit of detection (5 ag µm−2), are available as supplementary data (stacks.iop. org/JMM/25/035002/mmedia).
4.1. Model validation
A first characterization of the cantilevers is performed in a vacuum at room temperature, according to the external transduction configuration (see figure 3(a)). Cantilevers are collectively actuated by applying an ac voltage to the piezo-electric disk and individually read-out with the Fabry–Pérot setup (see figure 3(c)).
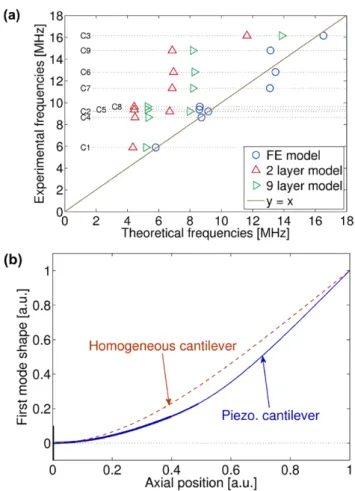
Values of the fundamental resonant mode measured for the cantilevers are plotted on figure 5(a). They are compared to theoretical values obtained by the FE model described in section 3, which takes into account the exact geometries and configurations of the piezoelectric stack. Figure 5(a) shows that a very good agreement is obtained, since all the meas-ured points are located around the y = x line. The agreement is excellent (from 0.2% to 2.5%) for cantilevers with geom-etry A (C1, C2, C3), whereas it is not as good for cantilevers with geometry B (C4 to C9, from 1 to 16%). Figure 5(a) also shows the comparison between the experimental results and the natural frequencies obtained from a classical analytical model (see [32, 33] among others) applied to a cantilever beam with a uniform cross section along the axial coordinate (homogeneous stack). Two configurations are considered for this latter analytical model: a 2-layer stack composed of only the first two layers of Si and SiO2 (the piezoelectric stack
being neglected) and a 6-layer stack (with a homogeneous piezoelectric stack covering the whole length and width of the beam). The obtained points are far from the y = x line since they are related to discrepancies between 12% and 54%.
Figure 5(b) shows the mode shape of the first mode of a cantilever with geometry A, computed with the FE model and with a homogeneous beam model. The mechanical (mass and stiffness) influence of the piezoelectric stack on the elasticity of the beam is clearly noticeable.
In conclusion, these results show that the influence of both the mass and stiffness of the piezoelectric stack on the elas-ticity of the beam cannot be neglected and that the dependence of the beam’s cross-section upon the axial coordinate has to be taken into account. Those features are correctly captured by the refined FE model. It must be noted that the inherent undercut due to the wet etching release was not taken into account in the FE modeling. Its influence for single layer cantilevers has been studied elsewhere [37] and is probably negligible compared to the one of the piezoelectric stack for the current piezoelectric beams. Finally, the good agreement between theory and experiment demonstrates the preserved mechanical integrity of the structures after fabrication. 4.2. Thermomechanical noise as a calibration tool
Thermomechanical fluctuations arise from the thermal coupling of a resonator with its environment at a nonzero
Table 2. Dimensions and geometries of the stratified cantilevers studied in this work.
Cantilever Length L [µm] Width w [µm] Geometry
C1 10.3 2.4 A C2 8.3 2.4 A C3 6.3 2.4 A C4 10.15 1.6 B C5 10.2 1.8 B C6 8.15 1.6 B C7 8.2 1.8 B C8 10.2 2 B C9 8.2 2 B
Figure 5. (a) Experimental natural frequencies as a function of the theoretical ones for the first mode of cantilevers C1 to C9. Results from the refined FE model (blue circle symbols) are compared to a classical analytical model of a cantilever beam with a uniform cross section composed of the first two layers Si and SiO2 (red
triangle symbols) and composed of the whole stack (green triangle symbols). The first bisector y = x (solid brown line) is represented to visualize the discrepancies between the measurements and the predictions. (b) Comparison of the first mode shape between a homogeneous cantilever (dashed line) and a laminated cantilever beam with geometry B (solid line). The thickness of the line is proportional to the thickness of the cantilever.
temperature. They result in the random displacement of the resonator around its equilibrium position in response to a time randomly fluctuating force. The thermomechanical force noise F tth( ) is commonly characterized by its power spectral density (PSD) SF,th defined as the Fourier transform of its autocorrelation function. The PSD (N2 Hz−1) associated with
the force noise has a white spectrum and its expression can be obtained from the fluctuation-dissipation theorem:
ω = = S k Tc k TM Q 4 4 F,th B B eff 0 (3)
where Meff is the equivalent mass of the resonator, Q is the quality factor, ω0= f2π0 is the fundamental angular frequency (rad s−1), c is the damping coefficient defined as c=M ω /Q
eff 0 in the one degree of freedom harmonic oscillator equivalent model of the resonator, kB is the Boltzmann constant and T is
the temperature.
In the frequency domain, the PSD related to the random displacement SU,th( )f (m2 Hz−1) is connected to the PSD of the fluctuating force noise SF,th by the transfer function H f( ) of the resonator according to [38]:
⎡ ⎣⎢ ⎤⎦⎥ π = = − −
(
)
S f H f S S M f f ( ) ( ) 16 U F F f f Q ,th 2 , ,th 4 eff2 2 02 2 th 2 02 2 (4) The thermomechanical displacement at resonance is therefore obtained for =f f0 : π =( )
S f k TQ M 2 f U, th 0 B eff 303 (5)Assuming an implementation with low-noise electronics, the thermomechanical noise sets the intrinsic and fundamental limit of detection for dynamic resonators. Roukes and co-workers reported an elegant way to use the thermomechanical noise as a calibration tool for the response of their optical read-out scheme [15]. The same method is followed here.
Our Fabry–Pérot measurement setup is sufficiently sensi-tive to detect the thermomechanical fluctuations of cantilevers in a vacuum (1.1 × 10⁻⁶ mbar) at room temperature (23 °C).
The voltage spectral density SV1/2,th( )f (V/ Hz) related to the displacement of a cantilever with geometry C4 is plotted in figure 6(a) and is obtained from the square root of the meas-ured PSD. The spectrum has a background noise floor of
≈
SV1/2,background( )f 1.745 µV/ Hz near resonance due to the presence of other noise sources (laser, photodiode, spec-trum analyzer). Since the noise sources are uncorrelated, the total measured PSD is the sum of the contributions of each individual noise source: SV=SV,th+SV,background. The voltage noise spectral density related to thermo-mechanical fluctuations can therefore be resolved by subtracting the contribution from the noise background according to: SV1/2,th=
(
SV−SV,background)
1/2≈1.694 µV/ Hz . A Lorentzian fit allows us to determine both the resonant frequency f0 ≈8.656 MHz and the quality factor Q≈296. The effective mass is computed according to the FE model (cf. equation (1)) for a cantilever vibrating in the funda-mental flexural mode, under a uniform mechanical loading(Fth=Lp0,) a zero external voltage (V = 0) and a displace-ment measured at the tip (free end). The FE simulations give:
= × ≈
Meff 0.31226 M 9.36 pg, with M the total mass of the cantilever. Equation (5) yields to: SU1/2,th
( )
f ≈0.060 pm/ Hz
at room temperature. The optical transduction responsivity defined as the conversion coefficient of the photodetector output voltage into the resonator’s mechanical displacement is finally obtained: R=SV1/2,th/SU ≈30
,th
1/2 µV pm−1.
This calibration technique is quite straight forward since it only depends on the cantilever’s dynamic properties, assuming the optical setup is sensitive enough to detect the thermomechanical motion. However, one has to keep in mind the possible uncertainty sources. First, the calculation requires the effective mass of the cantilever which is experimentally unknown and which is here computed with the FE model for a displacement measured at the end of the beam. Secondly, the positioning accuracy of the laser spot exactly at the cantile-ver’s tip during the experiment may also affect the calculation. However, we believe that a fair estimation of the range of the mechanical displacement is obtained.
Figure 6. (a) Measurement in a vacuum (1.1 × 10⁻⁶ mbar) at room
temperature (23 °C) of the total voltage spectral density SV1/2 of a cantilever with geometry C4 due to the thermomechanical noise (blue circle symbols) and its Lorentzian fit (red solid line). (b) Fundamental resonant response (blue circle symbols) obtained for the cantilever C4 by imposing a driving voltage between the top and bottom electrodes with an amplitude of 156 mV and its Lorentzian fit (red solid line).
8
4.3. Assessment of the piezoelectric actuation
In this configuration, devices are self-actuated by imposing a voltage between the top and bottom electrodes (see figure 3(b)) while the mechanical motion is optically read-out with the Fabry–Pérot setup (see figure 3(c)). Due to the converse piezo-electric effect, the transverse piezo-electric field resulting from the applied voltage causes a longitudinal strain in the PZT thin film. Since the piezoelectric layer is offset from the neutral axis of the resonator, the strain causes a bending moment in the cantilever. The active layer elongates and contracts at the frequency of the excitation voltage, thereby driving the cantilever in oscillations at the driving frequency. A typical resonant response measured in a vacuum for a cantilever with geometry C4 under a driving amplitude of 156 mV is shown in figure 6(b). The transduction responsivity calculated in section 4.2 can be used to convert the photodetector output voltage into an estimated mechanical displacement of the tip of around 20 pm at resonance.
The resonator’s dynamic with in the linear regime was also investigated by varying the ac driving voltage. Resonant peaks of a cantilever with geometry C5 were measured over almost two orders of magnitude of driving voltage at room temperature in a vacuum, as well as atmospheric pressure (see figure 7). The resonant frequency for the fundamental mode is found constant over the entire range of driving voltage (≈ 23 ppm variation), and with a variation of the Q-factor of
around 3%. For both vacuum and air environments the peak amplitude at resonance varies linearly with a constant dis-sipation confirming that the resonator operates in the linear regime. The Q-factor is found to drop by a factor of 7 during the transition from vacuum to air but remains sufficiently high to be easily measured.
The photodetector output voltage is converted into a mechanical displacement by using the calibration technique as explained in section 4.2. The actuation efficiency of the piezoelectric layer for this cantilever in a vacuum can then be characterized by the coefficient η , defined as the slope
of the linear curve shown in figure 7(b). A tip displacement of =η u Vt/ ≈181 fm mV−1 at resonance is obtained for a cantilever with geometry C5. This constant can be related to the modal converse piezoelectric-coupling coefficient χc
(consider equation (1) in resonant harmonic piezoelectric driving):
η χ
ω = cQ
02 (6)
Since χc is proportional to the piezoelectric material constant
d31, computing χc with the FE code of section 3 (which takes
into account the theoretical laminated geometry of the piezo-electric stack), leads us to estimate an experimental value of
=
d31 1.89 fm V−1 for a cantilever with geometry C5.
Figure 7. Resonant spectra of a cantilever with geometry C5 under a range of driving voltages measured in a vacuum (a) and in air (c) environments. The amplitude of the tip displacement at resonance in vacuum (b) and in air (d) varies linearly with the driving voltage. The slope of the linear fit corresponds to the piezoelectric response coefficient η.
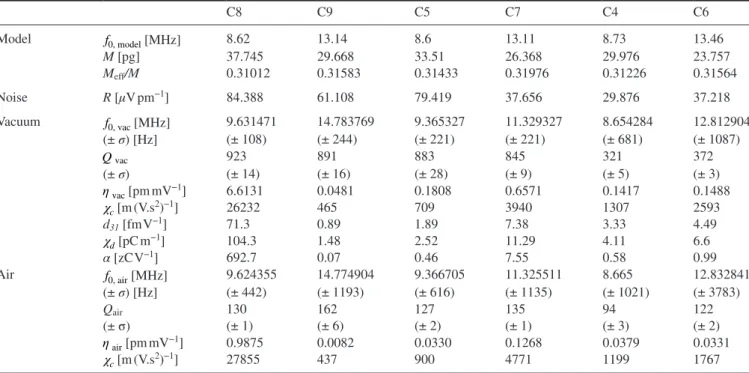
This extensive study has been repeated in total on 6 dif-ferent cantilevers to map the homogeneity and the quality of the piezoelectric thin film. The results are gathered in table 3. A maximum value of d31=71.3 fm V−1 was obtained for a cantilever with geometry C8. However, the piezoelectric constant is found to vary significantly among the measured cantilevers, reflecting the non-uniformity of the deposited piezoelectric thin film. The mean value calculated over the 6 cantilevers is equal to 15 fm V−1, which approximately
corre-sponds to an absolute value for the piezoelectric coefficient of: e31=Y dp 31=1.4 mC m−2, where Yp=96 GPa is the
theo-retical value of the piezoelectric material Young’s modulus. Even though this value is sufficient to perform actuation, it is around 3 orders of magnitude lower compared to the one reported elsewhere [39] for a sputtered PZT thin film in the same thickness range onto cantilevers. However, the value reported by Arndt et al is given for only one cantilever with in-plane dimensions significantly larger than the sizes of the resonators presented here. The lateral confinement of the piezoelectric layer may play an important part in the global response. Still, this is the first time to our knowledge that large-scale integration of a sputtered PZT-based piezoelectric transducer onto cantilevers with such confined dimensions is demonstrated.
4.4. Discussion on the piezoelectric detection
After validation of the structures’ dynamic behavior and piezoelectric actuation capabilities, an electrical detection scheme was implemented to replace the external optical
detection setup. A 1 pF charge amplifier was used to detect charges generated by the resonating structure due to the direct piezoelectric effect. In order to compensate inherent parasitic effects another structure usually serves as a [32]. The reference is expected to compensate the static capaci-tance of the piezoelectric stack as well as the resiscapaci-tance and capacitance of the interconnections. In a previous study, we investigated through electrical simulations the nature and the critical impact of parasitic effects on the behavior at reso-nance and experimentally validated the implementation of this detection scheme for larger structures with different geometries [40]. For the NEMS resonators studied in this current work, static capacitances with typical values of ~ 20 pF have been compensated by using the same electrical scheme. However, after compensation a residual voltage of
~ 20 mV was measured at the output of the charge ampli-fier near the mechanical resonance. One identified source for this background level is the difference in the wiring resis-tance of the interconnections as well as the difference in the resistance of the PZT layer between the resonator and the reference. The former was not optimized in the design while the latter is inherent in the fabrication process. A detection sensitivity of ~ 20 µV was achieved with a spectrum analyzer but still no resonance was observed which would suggest a charge generated by the PZT lower than 20 aC under 1 V excitation. Impedance measurements of the piezoelectric stack have shown resistances (hundreds of kΩ) significantly lower than typical values (in the GΩ range) for thicker PZT thin films. Dielectric losses within the piezoelectric material could therefore be responsible for a poor coupling coefficient
Table 3. Data obtained from both the FE model and measurements for 6 cantilevers with the same geometry B but with different
dimensions. Measurements performed in a vacuum and in air are shown. f0 is the resonance of the fundamental mode, M is the total mass of
the cantilever, Meff/M is the dimensionless effective mass with a uniform mechanical loading, R is the optical responsivity, Q is the quality
factor, σ is the standard deviation, η is the actuation efficiency of the piezoelectric layer, χc is the modal converse piezoelectric-coupling coefficient, d31 is the piezoelectric constant, χd is the modal direct piezoelectric-coupling coefficient and α is the detection efficiency of the piezoelectric layer. C8 C9 C5 C7 C4 C6 Model f0, model [MHz] 8.62 13.14 8.6 13.11 8.73 13.46 M [pg] 37.745 29.668 33.51 26.368 29.976 23.757 Meff/M 0.31012 0.31583 0.31433 0.31976 0.31226 0.31564 Noise R [µV pm−1] 84.388 61.108 79.419 37.656 29.876 37.218 Vacuum f0, vac [MHz] 9.631471 14.783769 9.365327 11.329327 8.654284 12.812904 (± σ) [Hz] (± 108) (± 244) (± 221) (± 221) (± 681) (± 1087) Qvac 923 891 883 845 321 372 (± σ) (± 14) (± 16) (± 28) (± 9) (± 5) (± 3) η vac [pm mV−1] 6.6131 0.0481 0.1808 0.6571 0.1417 0.1488 χc [m (V.s2)−1] 26232 465 709 3940 1307 2593 d31 [fm V−1] 71.3 0.89 1.89 7.38 3.33 4.49 χd [pC m−1] 104.3 1.48 2.52 11.29 4.11 6.6 α [zC V−1] 692.7 0.07 0.46 7.55 0.58 0.99 Air f0, air [MHz] 9.624355 14.774904 9.366705 11.325511 8.665 12.832841 (± σ) [Hz] (± 442) (± 1193) (± 616) (± 1135) (± 1021) (± 3783) Qair 130 162 127 135 94 122 (± σ) (± 1) (± 6) (± 2) (± 1) (± 3) (± 2) η air [pm mV−1] 0.9875 0.0082 0.0330 0.1268 0.0379 0.0331 χc [m (V.s2)−1] 27855 437 900 4771 1199 1767
10
due to energy dissipation into heat and the limitation of the signal-to-noise ratio.
Equation (2) leads us to estimate the direct effect of the piezoelectric layer and thus the detection efficiency of the device. Numerical values for the piezoelectric direct-coupling coefficient χd are obtained by numerical computations with
the FE model using the estimated d31 values and are reported
in table 3. Then, inserting equation (6) in equation (2), one obtains the following expression for the electric charge gener-ated by the piezoelectric direct effect at resonance:
⏟
χ χ ω = α q c dQV 02 (7)where the coefficient α (C/V) characterizes the detection
efficiency of the piezoelectric layer. For a cantilever with geometry C8 which exhibits the highest estimated piezoelec-tric constant d31 (see table 3), the calculated charge generated
by the piezoelectric direct effect yields to ≈q 0.7 aC under a driving amplitude of 1 V. The estimated generated charge is therefore well below the minimum resolution achievable with our detection setup. These results show how critical the transi-tion from the micro-scale to the nano-scale is and highlight the challenge of developing integrated transducers dedicated to the NEMS realm.
5. Conclusion
Collective fabrication at the wafer-scale of self-actuated cantilever-based resonators with an integrated 150 nm thick PZT thin film has been reported. Standard surface micro-machining technologies such as UV lithography appear as a good compromise between the degree of miniaturization and high-throughput manufacturing of resonators with integrated transduction means. Dynamic mechanical characteriza-tion of the fabricated cantilevers with different geometries have shown a preserved mechanical integrity and a dynamic behavior in a fair agreement with the finite element analysis. Quality factor values of ~900 in a vacuum and ~130 in air have been obtained at room temperature for fundamental reso-nant responses in the megahertz range. Piezoelectric actuation capabilities were validated in the linear regime for the first time at this integration level in spite of a low piezoelectric constant probably due to the lateral confinement. Discussion on the piezoelectric sensing shows how critical the transition from the micro-scale to the nano-scale is. This work shows promise and paves the way for further research dedicated to the NEMS realm to address the challenge of the transduc-tion integratransduc-tion at the nano-scale to provide fabricatransduc-tion at the wafer-scale.
Acknowledgments
The French General Delegation for Armament and the French National Agency for Research (grant ANR/PNANO 2008, project NEMSPIEZO ‘ANR-08-NANO-015’) are gratefully acknowledged for financial support. Bernard Legrand is
acknowledged for insightful discussions on the noise-related data acquisition and interpretation.
Appendix A. Reduced order model of the laminated cantilever beams and effective mass
Following the theoretical model of [30], the equation of motion for a laminated cantilever beam of arbitrary cross sec-tion can be written: ⎡ ⎣⎢ ⎤ ⎦⎥ Θ Δ ∂ ∂ + ∂∂ ∂∂ − = m x u t x D x u x V t x p x t ( ) 22 22 ( ) 22 ( ) ( ) ( , ) (A.1)
where u x t( , ) is the transverse displacement of the beam at axial position x and time t, m x( ) is the beam mass per unit of length, D x( ) is the beam bending stiffness, Θ is the
piezo-electric transduction constant of the piezopiezo-electric layer, proportional do d31 and e31, V t( ) the applied voltage and:
Δ x = − δ −
x x x
( ) d
d ( p) (A.2)
where δ x( ) is the Dirac function and xp is the axial position
of the piezoelectric layer end. The external mechanical force per unit of length is p x t( , ) . Considering a given mode shape Φ x( ) , the associated modal mass is:
∫
Φ = Φ m m x( ) ( ) dx x L 0 2 (A.3)Then, expanding u x t( , ) on the modal basis and truncating the result to a given mode shape Φ x( ) only, one obtains:
Φ
=
u x t( , ) ( ) ( )x r t (A.4) where the modal coordinate verifies:
∫
ω ω χ Φ ¨ + ˙ + −∼ = Φ − r Q r r V m p x t x x 1 ( , ) ( ) d c L 1 0 02 0 (A.5) where: χ Θ Φ ⌣ = = Φ m x x x d d ( ) c p (A.6)Considering that the tip displacement of the beam is Φ
=
ut ( ) ( )L r t and a uniform loading p x t( , )=p t0( ) , and introducing those expressions in (A.5), one obtains equa-tion (1) with χc =⌣ Lχ Φc ( ) . Using the finite element model of [29, 31] leads us to compute the integrals in mΦ and M1 with
matrix products.
References
[1] Craighead HG 2000 Nanoelectromechanical systems Science 290 1532–5
[2] Roukes M L 2001 Nanoelectromechanical systems face the future Phys. World 14 25–31
[3] Ekinci K L and Roukes M L 2005 Nanoelectromechanical systems Rev. Sci. Instrum. 76 061101
[4] Lavrik N V and Datskos P G 2003 Femtogram mass detection using photothermally actuated nanomechanical resonators Appl. Phys. Lett. 82 2697
[5] Ekinci K L, Huang X M H and Roukes M L 2004 Ultrasensitive nanoelectromechanical mass detection Appl. Phys. Lett. 84 4469
[6] Yang Y T, Callegari C, Feng X L, Ekinci K L and Roukes M L 2006 Zeptogram-scale nanomechanical mass sensing Nano Lett. 6 583–6
[7] Chaste J, Eichler A, Moser J, Ceballos G, Rurali R and Bachtold A 2012 A nanomechanical mass sensor with yoctogram resolution Nat. Nano 7 301–4
[8] Ilic B, Yang Y and Craighead H G 2004 Virus detection using nano electromechanical devices Appl. Phys. Lett. 85 2604
[9] Arlett J L, Myers E B and Roukes M L 2011 Comparative advantages of mechanical biosensors Nat. Nano 6 203–15
[10] Hanay M S, Kelber S, Naik A K, Chi D, Hentz S, Bullard E C, Colinet E, Duraffourg L and Roukes M L 2012 Single-protein nanomechanical mass spectrometry in real time Nat. Nano 7 602–8
[11] Schwab K C and Roukes M L 2005 Putting mechanics into quantum mechanics Phys. Today 58 36
[12] LaHaye M D, Suh J, Echternach P M, Schwab K C and Roukes M L 2009 Nanomechanical measurements of a superconducting qubit Nature 459 960–4
[13] Ekinci K L 2005 Electromechanical transducers at the nanoscale: actuation and sensing of motion in nanoelectromechanical systems (NEMS) Small 1 786–97
[14] Truitt P A, Hertzberg J B, Huang C C, Ekinci K L and Schwab K C 2007 Efficient and sensitive capacitive readout of nanomechanical resonator arrays Nano Lett. 7 120–6
[15] Karabalin R B, Matheny M H, Feng X L, Defaÿ E, Le Rhun G, Marcoux C, Hentz S, Andreucci P and Roukes M L 2009 Piezoelectric nanoelectromechanical resonators based on aluminum nitride thin films Appl. Phys. Lett. 95 103111
[16] Li M, Tang H X and Roukes M L 2007 Ultra-sensitive NEMS-based cantilevers for sensing, scanned probe and very high-frequency applications Nat. Nanotechnol. 2 114–20
[17] Unterreithmeier Q P, Weig E M and Kotthaus J P 2009 Universal transduction scheme for nanomechanical systems based on dielectric forces Nature 458 1001–4
[18] Bargatin I, Myers E B, Aldridge J S, Marcoux C, Brianceau P, Duraffourg L, Colinet E, Hentz S, Andreucci P
and Roukes M L 2012 Large-scale integration of nanoelectromechanical systems for gas sensing applications Nano Lett. 12 1269–74
[19] Arcamone J, Boogaart M A F van den, Serra-Graells F, Fraxedas J, Brugger J and Pérez-Murano F 2008 Full-wafer fabrication by nanostencil lithography of micro/ nanomechanical mass sensors monolithically integrated with CMOS Nanotechnology 19 305302
[20] Cleland A N and Roukes M L 1996 Fabrication of high frequency nanometer scale mechanical resonators from bulk Si crystals Appl. Phys. Lett. 69 2653
[21] Bargatin I, Kozinsky I and Roukes M L 2007 Efficient electrothermal actuation of multiple modes of high-frequency nanoelectromechanical resonators Appl. Phys. Lett. 90 093116
[22] Trolier-McKinstry S and Muralt P 2004 Thin film piezoelectrics for MEMS J. Electroceram. 12 7–17
[23] Tadigadapa S and Mateti K 2009 Piezoelectric MEMS sensors: state-of-the-art and perspectives Meas. Sci. Technol. 20 092001
[24] Guillon S, Saya D, Mazenq L, Costecalde J, Remiens D, Soyer C and Nicu L 2012 Lead zirconate titanate nanoscale patterning by ultraviolet-based lithography lift-off technique for nano-electromechanical system applications IEEE Trans. Ultrason. Ferroelectr. Freq. Control 59 (9) 1955–61
[25] Chen H D, Udayakumar K R, Gaskey C J and Cross L E 1995 Electrical properties’ maxima in thin films of the lead zirconate–lead titanate solid solution system Appl. Phys. Lett. 67 3411–3
[26] Chung C W and Kim C J 1997 Etching effects on ferroelectric capacitors with multilayered electrodes Japan J. Appl. Phys. 36 2747
[27] Kim K-T, Kang M-G and Kim C-I 2004 Study on the etching damage characteristics of PZT thin films after etching in Cl-based plasma Microelectron. Eng. 71 294–300
[28] Carr D W and Craighead H G 1997 Fabrication of nanoelectromechanical systems in single crystal silicon using silicon on insulator substrates and electron beam lithography J. Vac. Sci. Technol. B 15 2760–3
[29] Thomas O, Deü J-F and Ducarne J 2009 Vibrations of an elastic structure with shunted piezoelectric patches: efficient finite element formulation and electromechanical coupling coefficients Int. J. Numer. Methods Eng. 80 235–68
[30] Ducarne J, Thomas O and Deü J-F 2012 Placement and dimension optimization of shunted piezoelectric patches for vibration reduction J. Sound Vib. 331 3286–303
[31] Lazarus A, Thomas O and Deü J-F 2012 Finite element reduced order models for nonlinear vibrations of piezoelectric layered beams with applications to NEMS Finite Elem. Anal. Des. 49 35–51
[32] Ivaldi P, Abergel J, Matheny M H, Villanueva L G, Karabalin R B, Roukes M L, Andreucci P, Hentz S and Defaÿ E 2011 50 nm thick AlN film-based piezoelectric cantilevers for gravimetric detection J. Micromech. Microeng. 21 085023
[33] DeVoe D L 2001 Piezoelectric thin film micromechanical beam resonators Sensors Actuators A: Phys. 88 263–72
[34] Ayela C, Nicu L, Soyer C, Cattan E and Bergaud C 2006 Determination of the d31 piezoelectric coefficient of PbZrxTi1-xO3 thin films using multilayer buckled micromembranes J. Appl. Phys. 100 054908
[35] Zhao S, Ma F, Song Z and Xu K 2008 The growth behavior and stress evolution of sputtering-deposited LaNiO3 thin films Mater. Sci. Eng.: A 474 134–9
[36] Chinmulgund M, Inturi R B and Barnard J A 1995 Effect of Ar gas pressure on growth, structure and mechanical properties of sputtered Ti, Al, TiAl and Ti3Al films Thin Solid Films 270 260–3
[37] Guillon S, Saya D, Mazenq L, Perisanu S, Vincent P, Lazarus A, Thomas O and Nicu L 2011 Effect of non-ideal clamping shape on the resonance frequencies of silicon nanocantilevers Nanotechnology 22 245501
[38] Arlett J L, Maloney J R, Gudlewski B, Muluneh M and Roukes M L 2006 Self-sensing micro- and nanocantilevers with attonewton-scale force resolution Nano Lett. 6 1000–6
[39] Arndt G, Defay E, Rhun G L, Rey P, Perruchot F, Aid M, Liu L and Miller M 2010 Dynamic analytical modelling and piezoelectric characterization of a Pb(Zr, Ti)O3/SiN cantilever with losses J. Micromech. Microeng. 20 115019
[40] Mathieu F, Larramendy F, Dezest D, Huang C, Lavallee G, Miller S, Eichfeld C M, Mansfield W, Trolier-McKinstry S and Nicu L 2013 Reducing parasitic effects of actuation and sensing schemes for piezoelectric microelectromechanical resonators Microelectron. Eng. 111 68–76