Time evolution of the O
2
IR Atmospheric nightglow:
VIRTIS observations and comparison with a 2-D model
L. Soret (1), J.-C. Gérard (1), A. Collet (1), G. Piccioni (2) and P. Drossart (3)
(1) LPAP, Université de Liège, Belgium, (2) INAF-IAPS, Rome, Italy, (3) LESIA, Observatoire de Paris, Paris, France ([email protected]) / Fax: +32-4-3669711
Abstract
The O2 (a 1∆
) emission at 1.27 µm results from three-body recombination of O atoms produced on the day side and transported to the night side by the global solar to antisolar circulation. It is variable in brightness and shows a peak generally located between 95 and 100 km. In this study, we present individual nadir images of the O2 (a1∆) nightside airglow emission [1,2] obtained with VIRTIS IR on board Venus Express [3]. A total of 460 VIRTIS images lasting several hours are used to determine the spatial and temporal variations of regions of enhanced excited O2 (a1∆) density.
Figure 1: example of a region of enhanced O2 infrared airglow emission.
The intensity may either increase or decrease during the observation period. Intensity drop is expected as a result of three competing processes: (1) the radiative lifetime of the O2 (a1∆) metastable state of 75 min, (2) the effective lifetime of oxygen atoms versus chemical recombination and (3) changes in the local downward flux of O atoms carried by dynamical processes (diffusion, advection).
From the intensity variations, we determine the characteristic rate of change of the bright airglow
spots. Their e-folding times have been calculated. The mean decay time is in good agreement with the previous study by [4] who calculated O and CO2 density profiles using VIRTIS and SPICAV observations. Indeed, if quenching of O2 (a1∆) is neglected: d O
[ ]
dt = −k O[ ]
2 CO2[
]
= −1 τ[ ]
O ⇒τ= 1 k O[ ]
[
CO2]
where k=3.1x10⁻³² cm6 s-1, [CO2]=7.2x1014 cm-3 and [O]=(2/0.5)/2x2x1011=4x1011 cm-3 at 97 km. In this case, we find a value of τ~1900 min, which is in very good agreement with the value deduced from observations.
We compare these results with those of a two-dimensional model of the oxygen chemistry and dynamics [5]. In this model, a time and space varying flux of O atoms is prescribed through the upper boundary and a free boundary condition is used on the lateral boundary. The spot brightness evolution has been simulated with a 2-D model by imposing a localized increase of the oxygen flux at the upper boundary. The evolution of the O2(a1∆) volume emission rate is represented in Figure 2.
Figure 2: two-dimensional simulation of the volume emission rate at 1.27 µ m with a horizontal wind of 25 m s-1.
EPSC Abstracts
Vol. 7 EPSC2012-55-1 2012
European Planetary Science Congress 2012 c
The horizontal motion of the spots is used to determine the wind speed in the 95-100 km region. Values are in the range of 25 to 150 m s-1, in good agreement with an earlier study.
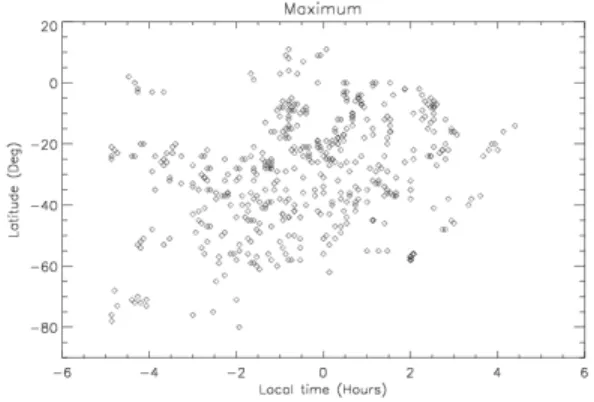
A statistical study of the location of the brightest region of emission in each picture frame indicates that their locations on the Venus nightside are very variable. However, a concentration of peak detection is observed at low latitude around the midnight, in agreement with earlier results based on a statistical map.
Figure 3: variable position of the centers of the 1.27 µ m bright patches
Acknowledgements
We gratefully thank all members of the ESA Venus Express project and of the VIRTIS and SPICAV scientific and technical teams. J.-C. Gérard
acknowledges support from the Belgian Fund for Scientific Research (FNRS). This research was supported by the PRODEX program of ESA, managed in collaboration with the Belgian Federal Science Policy Office (BELSPO). This work was funded by Agenzia Spaziale Italiana and the Centre National d'Etudes Spatiales.
References
[1] Gérard, J. C., Saglam, A., Piccioni, G., Drossart, P., Montmessin, F., Bertaux, J.-L.: Atomic oxygen distribution in the Venus mesosphere from observations of O2 infrared
airglow by VIRTIS-Venus Express, Icarus, 199(2), pp. 264-272, 2009.
[2] Piccioni, G., Zasova, L., Migliorini, A., Drossart, P., Shakun, A., Munoz, A. G., Mills, F. P., Cardesin-Moinelo, A.: Near-IR oxygen nightglow observed by VIRTIS in the Venus upper atmosphere, Journal of Geophysical Research-Planets, 114, 2009.
[3]Drossart, P. et al.: Scientific goals for the observation of Venus by VIRTIS on ESA/Venus express mission, Planetary and Space Science, 55(12), pp. 1653-1672, 2007. [4] Soret, L., Gérard, J.-C., Montmessin, F., Piccioni, G., Drossart, P., Bertaux, J.-L.: Atomic oxygen on the Venus nightside: Global distribution deduced from airglow mapping, Icarus, 217, pp. 849-855, 2012.
[5] Collet, A., Cox, C., Gérard, J.-C.: Two-dimensional time-dependent model of the transport of minor species in the Venus night side upper atmosphere, Planetary and Space Science, 58, pp. 1857-1867, 2010.